. 2017 Nov;102(11):1850-1860.
doi: 10.3324/haematol.2016.157636. Epub 2017 Sep 14.

Senescence is a Spi1-induced anti-proliferative mechanism in primary hematopoietic cells

Affiliations

Senescence is a Spi1-induced anti-proliferative mechanism in primary hematopoietic cells

Laure Delestré et al. Haematologica. 2017 Nov.

Abstract

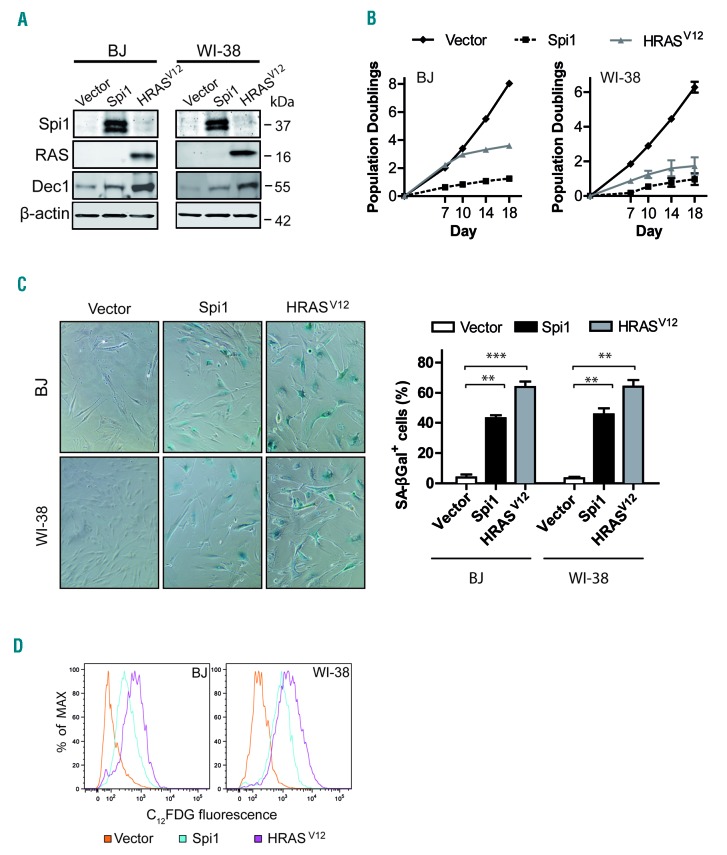
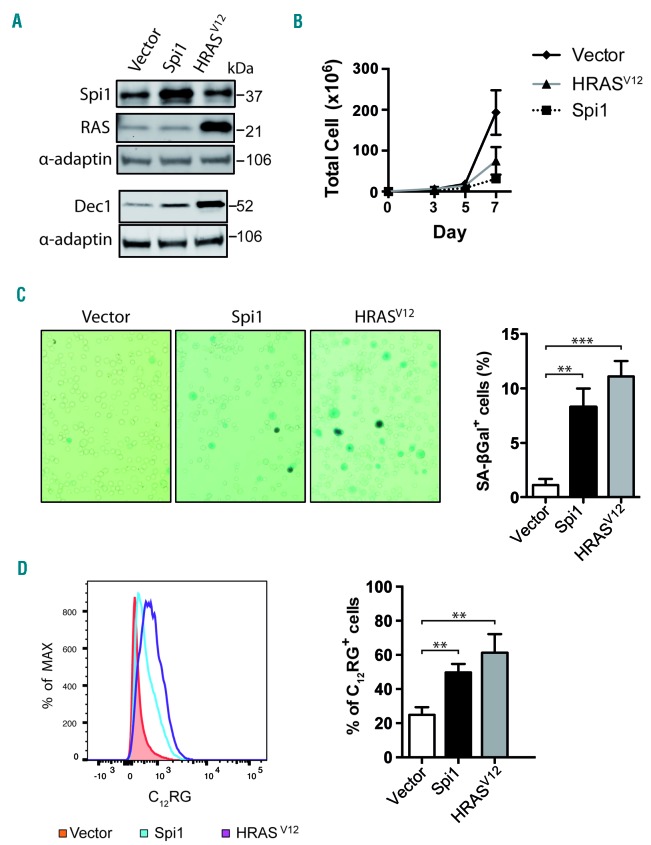
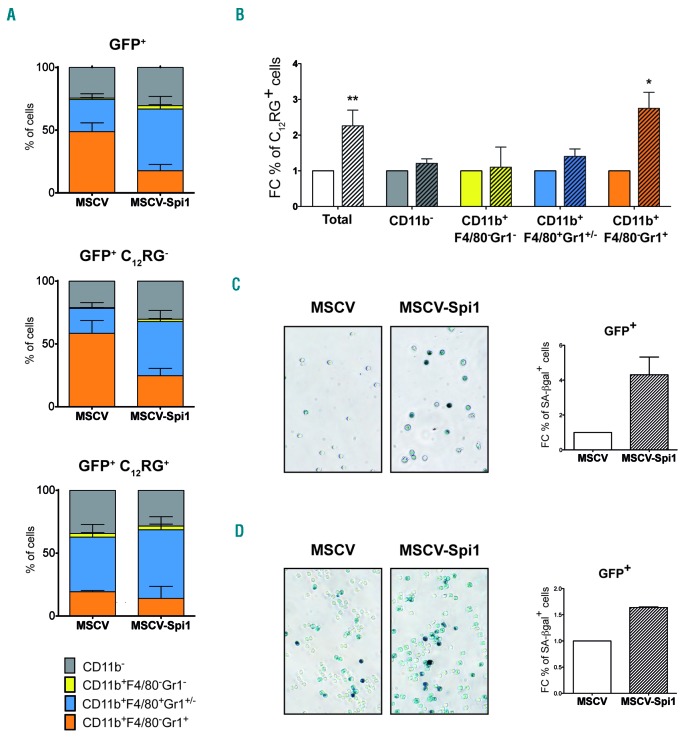
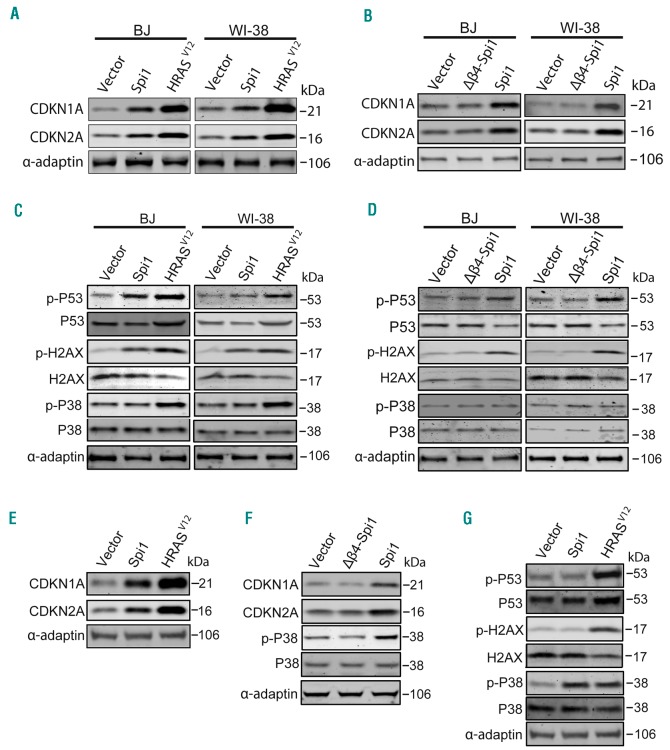
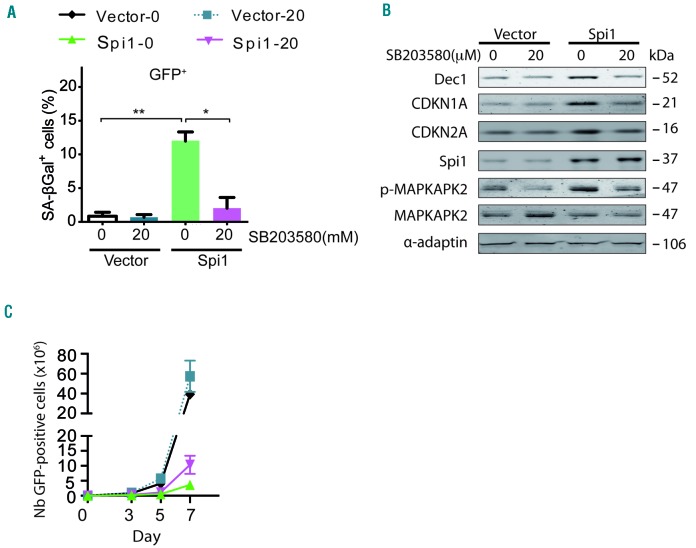
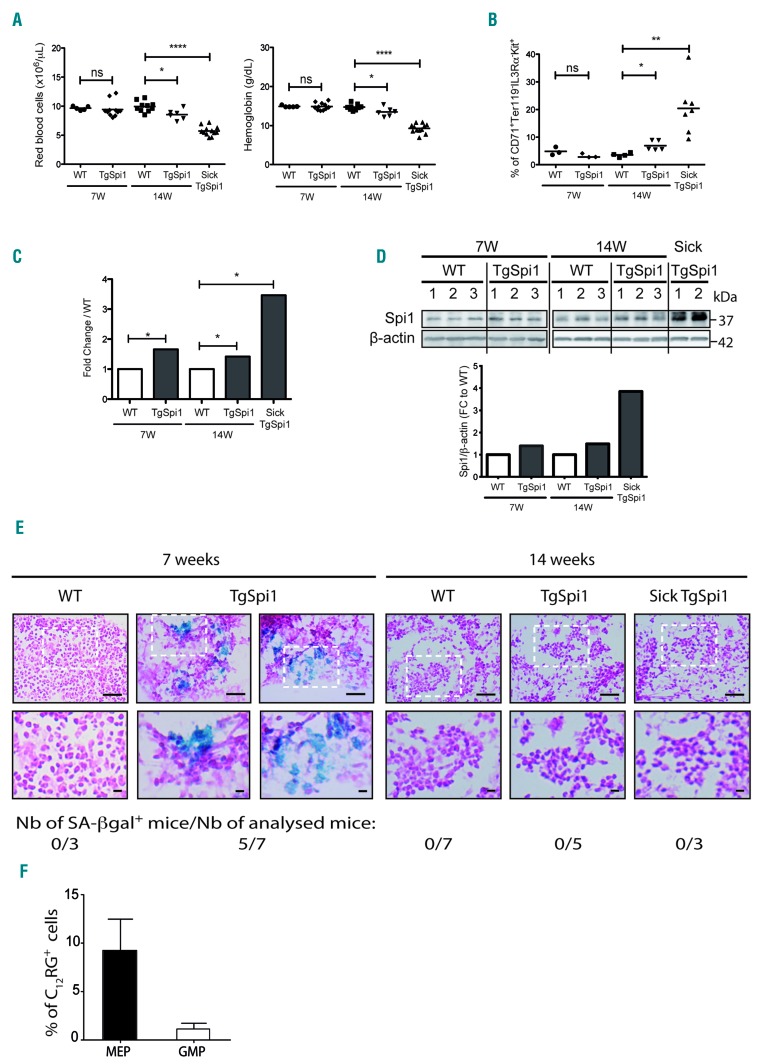
Transcriptional deregulation caused by epigenetic or genetic alterations is a major cause of leukemic transformation. The Spi1/PU.1 transcription factor is a key regulator of many steps of hematopoiesis, and limits self-renewal of hematopoietic stem cells. The deregulation of its expression or activity contributes to leukemia, in which Spi1 can be either an oncogene or a tumor suppressor. Herein we explored whether cellular senescence, an anti-tumoral pathway that restrains cell proliferation, is a mechanism by which Spi1 limits hematopoietic cell expansion, and thus prevents the development of leukemia. We show that Spi1 overexpression triggers cellular senescence both in primary fibroblasts and hematopoietic cells. Erythroid and myeloid lineages are both prone to Spi1-induced senescence. In hematopoietic cells, Spi1-induced senescence requires its DNA-binding activity and a functional p38MAPK14 pathway but is independent of a DNA-damage response. In contrast, in fibroblasts, Spi1-induced senescence is triggered by a DNA-damage response. Importantly, using our well-established Spi1 transgenic leukemia mouse model, we demonstrate that Spi1 overexpression also induces senescence in erythroid progenitors of the bone marrow in vivo before the onset of the pre-leukemic phase of erythroleukemia. Remarkably, the senescence response is lost during the progression of the disease and erythroid blasts do not display a higher expression of Dec1 and CDKN1A, two of the induced senescence markers in young animals. These results bring indirect evidence that leukemia develops from cells which have bypassed Spi1-induced senescence. Overall, our results reveal senescence as a Spi1-induced anti-proliferative mechanism that may be a safeguard against the development of acute myeloid leukemia.


Figures

Figure 1.
Figure 1.
Ectopic expression of Spi1 and HRASV12 induces growth arrest and senescence in BJ and WI-38 fibroblast cells. (A) Western blot analysis of Spi1, HRASV12, and the senescence marker Dec1 in BJ and WI-38 cells subjected to the retroviral-mediated expression of Spi1, HRASV12 or an empty vector as a control 10 days after puromycin selection. β-actin served as the loading control. (B) Population doublings (PDs) of BJ (left panel) and WI-38 (right panel) cells transduced as described in (A) over the indicated periods of time. Day 0 was the first day after puromycin selection. PDs for each time point are the mean of triplicate experiments. (C) Representative SA-βgal staining and percent of SA-βgal positive cells (histograms) in samples of BJ and WI-38 cells subjected to the retroviral-mediated expression of Spi1, HRASV12 or an empty vector as a control 10 days after puromycin selection. Magnification of images, 200X. The means ± SD of at least 3 independent experiments are shown. **P<0.005; ***P<0.0005 from two-tailed Student’s t-tests. (D) Flow cytometric detection of SA-βgal activity using C12FDG as a fluorogenic substrate in cells as described in (C).
Figure 2.
Figure 2.
Overexpression of Spi1 and HRASV12 in LinKit+Sca1+ (LSK) cells leads to senescence. (A) Western blot analysis of Spi1, HRASV12 and the senescence marker Dec1 in hematopoietic cells subjected to the retroviral-mediated expression of Spi1, HRASV12 or an empty vector. Protein extracts of GFP-positive sorted cells were analyzed 7 days post-infection as described in Online Supplementary Figure S2. α-adaptin served as the loading control. (B) Number of total living cells retrovirally transduced with Spi1 and HRASV12 or an empty vector (control), at the indicated periods of time. The means ± SEM of at least 3 independent experiments are shown. (C) Representative SA-βgal staining and mean percentages of SA-βgal positive cells (histograms) in samples of hematopoietic cells subjected to the retroviral-mediated expression of Spi1, HRASV12 or an empty vector as a control. SA-βgal assays for sorted GFP-positive cells were performed 7 days post-infection as described in Online Supplementary Figure S2. The counting of GFP-positive SA-βgal cells was performed in 9 randomly selected fields with a total of more than 2000 cells from each group. Magnification of images, 200X. The means ± SD of at least 3 independent experiments are shown. **P<0.005; ***P<0.0005 from two-tailed Student’s t-test. (D) Flow cytometric detection of SA-βgal activity using C12RG as a fluorogenic substrate in cells retrovirally transduced with Spi1, HRASV12 or an empty vector. The histograms represents the % of C12RG positive cells among GFP-positive cells. The means ± SD of at least 3 independent experiments are shown. **P<0.005 from two-tailed Student’s t-test.
Figure 3.
Figure 3.
Spi1 triggers senescence in granulocytes, monocytes/macrophages and myeloid and erythroid progenitor cells. (A) Distribution of the cells according to CD11b, Gr1 and F4/80 myeloid markers and SA-βgal activity using C12RG as fluorogenic substrate by flow cytometry among total GFP+, GFP+C12RG or GFP+C12RG+, 7 days after transduction of LSK cells with MSCV-Spi1 or MSCV control vectors. The means ± SEM of 3 independent experiments are shown. (B) Fold change (FC) of the % of C12RG positive cells between Spi1-overexpressing cells (hatched histograms) and control cells among GFP+ cells inside each indicated cells compartment, granulocytes (CD11b+F4/80Gr1+), monocytes/macrophages (CD11b+F4/80+Gr1+), immature myeloid progenitors (CD11b+F4/80Gr1) or CD11b cells. *P<0.05 from two-tailed Student’s t-test. (C and D) Representative SA-βgal staining using cytochemical staining and FC of the % of SA-βgal positive cells in MEP (C) and in GMP (D) progenitor cells subjected to the retroviral-mediated expression of Spi1 (MSCV-Spi1) relative to empty vector as a control (MSCV). SA-βgal assays for sorted GFP-positive cells were performed 4 or 6 days post-infection for MEP and GMP, respectively. The counting of GFP-positive SA-βgal cells was performed in 3 randomly selected fields with a total of more than 100 cells from each group. Magnification of images, 200X. Results are from 3 independent experiments. GFP: green fluorescent protein; MSCV: murine stem cell virus.
Figure 4.
Figure 4.
Spi1 induces senescence through distinct mechanisms in fibroblasts and in hematopoietic cells. (A-B) Western blot analysis of CDKN1A and CDKN2A in BJ and WI-38 cells subjected to the retroviral-mediated expression of Spi1, Δβ4-Spi1, HRASV12 or an empty vector (vector) 10 days after puromycin selection. α-adaptin served as the loading control. (C-D) Western blot analysis of S15-phosphorylated (p-p53) and total p53, S139-phosphorylated (p-H2AX) and total H2AX, and Thr180/182-phosphorylated and total p38MAPK14 (p-P38 and P38) in the same cells described in (A). (E, G) Western blot analysis of CDKN1A and CDKN2A (E) and S15-phosphorylated and total p53, S139-phosphorylated and total H2AX, and Thr180/182-phosphorylated and total p38MAPK14 (p-P38 and P38) (G) in hematopoietic cells subjected to the retroviral-mediated expression of Spi1, HRASV12 or an empty vector. Protein extracts of GFP-positive sorted cells were analyzed 7 days post-infection as described in Online Supplementary Figure S2. α-adaptin served as the loading control. (F). Thr180/182-phosphorylated and total p38MAPK14 (p-P38 and P38), and CDKN1A and CDKN2A expression were analyzed via Western blotting in hematopoietic cells subjected to the retroviral-mediated expression of Spi1, Δβ4-Spi1 or an empty vector. Protein extracts of GFP-positive sorted cells were analyzed 7 days post-infection as described in Online Supplementary Figure S2. α-adaptin served as the loading control.
Figure 5.
Figure 5.
Spi1-induced senescence requires P38MAPK14 signaling in hematopoietic cells. (A) Mean percentage of SA-βgal positive cells (histograms) subjected to the retroviral-mediated expression of Spi1 or an empty vector, and maintained in cultures with or without 20 μM of SB203580 in samples of GFP-positive sorted hematopoietic cells 7 days post-infection. The means ± SD of at least 3 independent experiments are shown. *P<0.05; **P<0.005 from two-tailed Student’s t-tests. (B) Hematopoietic cells transduced with empty vectors (vector) or Spi1 expression vectors and maintained in cultures with or without 20 μM of SB203580 were sorted for GFP-positive cells 7 days post-infection and subjected to Western blot analyses of CDKN1A, CDKN2A, p-MAPKAPK2, MAPKAPK2, Dec1 and Spi1. α-adaptin served as the loading control. (C) Number of GFP-positive cells retrovirally transduced with empty vectors (vector) or Spi1 expression vectors and maintained in cultures with or without 20 μM of SB203580 from day 1 to day 6 at the indicated periods of time. The means ± SD of at least 3 independent experiments are shown.
Figure 6.
Figure 6.
Spi1 induces senescence in vivo in the bone marrow of young TgSpi1 mice and is lost before the onset of the pre-leukemic syndrome. (A) Red blood cell numbers and hemoglobin concentrations of wild-type (WT) and TgSpi1 mice at the indicated ages. Bars indicate the mean values. *P<0.05; ****P<0.0001 from two-tailed Student’s t-tests. (B) Scatter plots represent the results of flow cytometry analyses of whole bone marrow cells for CFU-E markers (CD71+Ter119Kit+IL3Rα) in WT and TgSpi1 mice at the indicated ages. Bars indicate the mean values. *P<0.05; **P<0.001 from two-tailed Student’s t-tests. (C) Spi1 messenger ribonucleic acid (mRNA) levels in bone marrow cells from 7- and 14-week-old WT, healthy TgSpi1 and sick TgSpi1 mice were quantified via real-time quantitative polymerase chain reaction (qPCR) and normalized to the Polr2α mRNA level (ΔCt, Ctgene-CtPolr2α). Between 4 and 6 animals were analyzed for each category of mice. Bars represent the fold change relative to values for age-matched WT mice, as calculated from the 2−ΔΔCt values. Statistical analysis of the 2−ΔCt values was carried out using Student’s t-test; *P<0.05. (D) Spi1 protein levels in bone marrow cells from 7- and 14-week-old WT, healthy TgSpi1 and sick TgSpi1 mice were analyzed by Western blotting. The histograms represent the quantified results, using ImageJ, relative to β-actin and to values for age-matched WT mice. (E) SA-βgal activity was examined in fresh bone marrow sections. Staining was performed on bone marrow from 7- and 14-week-old WT, healthy TgSpi1 and sick TgSpi1 mice. The number of mice displaying SA-βgal positive cells in their bone marrow is indicated for each category of mice. Bars represent 50μm (top) and 10μm (bottom) pictures. (F) MEP (LinScaKit+CD34CD16/32) and GMP (LinScaKit+CD34+CD16/32+) from bone marrow cells of 7-week-old WT and healthy TgSpi1 mice were analyzed for SA-βgal activity using C12RG as a fluorogenic substrate. The histograms represent the means of percentage of C12RG+ cells in TgSpi1 mice considering WT mice as negative control, as presented in Online Supplementary Figure S10A. N= 4 animals for WT and 5 animals for TgSpi1 mice. Ns: non-significant.

References

    1. DeKoter RP, Kamath MB, Houston IB. Analysis of concentration-dependent functions of PU.1 in hematopoiesis using mouse models. Blood Cells, Mol Dis. 2007;39(3): 316–320. - PMC - PubMed
    1. Iwasaki H, Somoza C, Shigematsu H, et al. Distinctive and indispensable roles of PU.1 in maintenance of hematopoietic stem cells and their differentiation. Blood. 2005;106(5): 1590–1600. - PMC - PubMed
    1. Kim HG, de Guzman CG, Swindle CS, et al. The ETS family transcription factor PU.1 is necessary for the maintenance of fetal liver hematopoietic stem cells. Blood. 2004;104(13):3894–3900. - PubMed
    1. Nutt SL, Metcalf D, D’Amico A, Polli M, Wu L. Dynamic regulation of PU.1 expression in multipotent hematopoietic progenitors. J Exp Med. 2005;201(2):221–231. - PMC - PubMed
    1. Staber PB, Zhang P, Ye M, et al. Sustained PU.1 levels balance cell-cycle regulators to prevent exhaustion of adult hematopoietic stem cells. Mol Cell. 2013;49(5):934–946. - PMC - PubMed

Publication types

MeSH terms