. 2017 Sep 15;357(6356):1160-1163.
doi: 10.1126/science.aan3842.

A Neolithic expansion, but strong genetic structure, in the independent history of New Guinea

Affiliations

A Neolithic expansion, but strong genetic structure, in the independent history of New Guinea

Anders Bergström et al. Science. .

Abstract

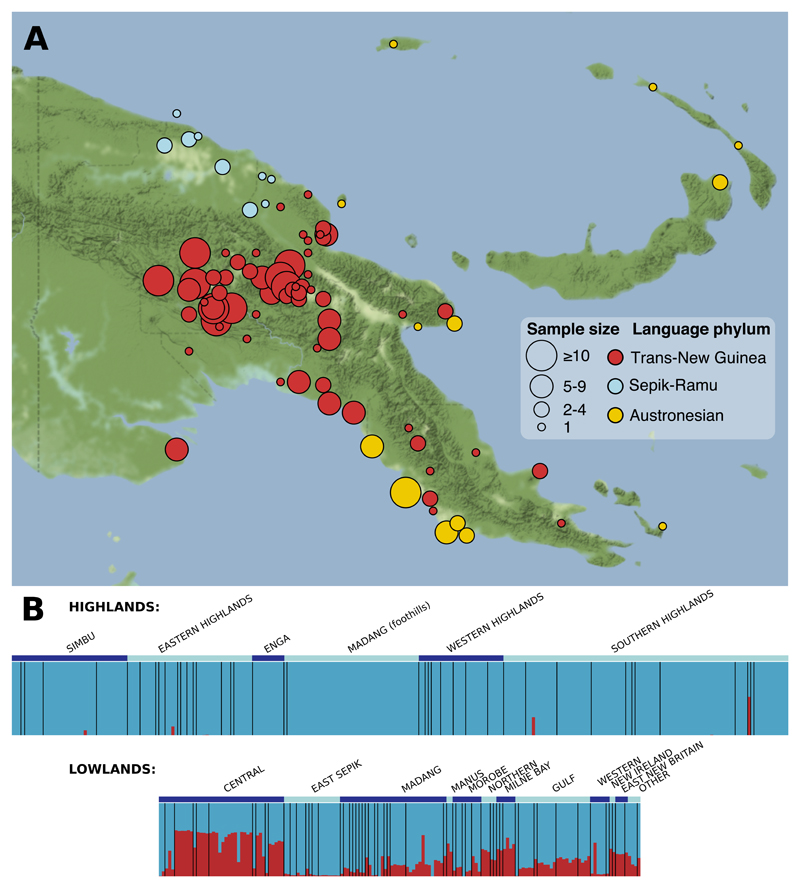
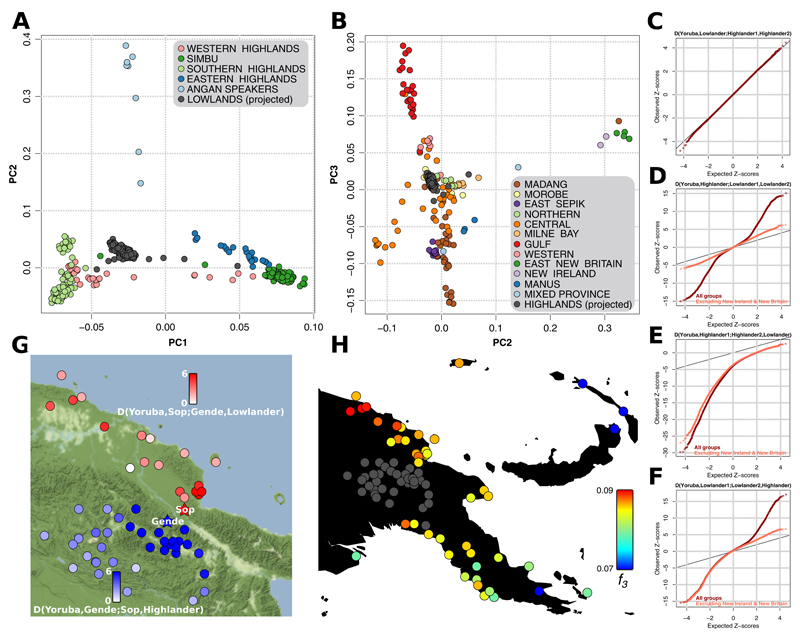
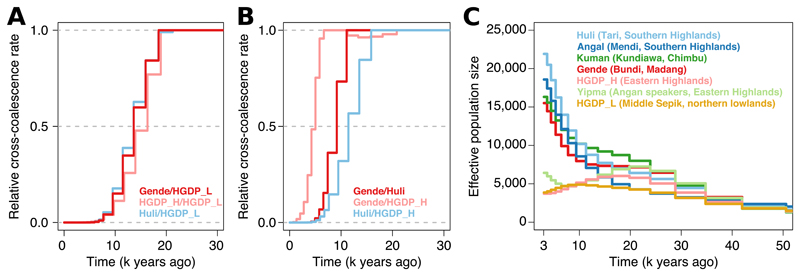
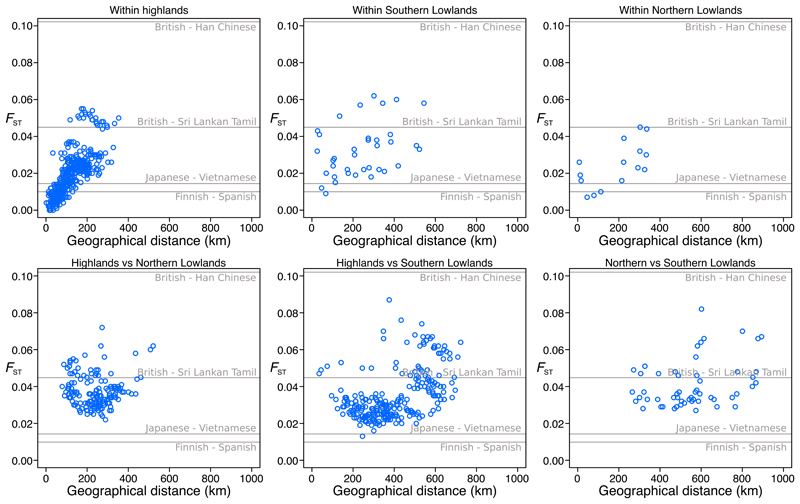
New Guinea shows human occupation since ~50 thousand years ago (ka), independent adoption of plant cultivation ~10 ka, and great cultural and linguistic diversity today. We performed genome-wide single-nucleotide polymorphism genotyping on 381 individuals from 85 language groups in Papua New Guinea and find a sharp divide originating 10 to 20 ka between lowland and highland groups and a lack of non-New Guinean admixture in the latter. All highlanders share ancestry within the last 10 thousand years, with major population growth in the same period, suggesting population structure was reshaped following the Neolithic lifestyle transition. However, genetic differentiation between groups in Papua New Guinea is much stronger than in comparable regions in Eurasia, demonstrating that such a transition does not necessarily limit the genetic and linguistic diversity of human societies.


Figures

Fig. 1
Fig. 1. PNG samples.
(A) Each language group is represented by a circle, the area of which indicates the number of genotyped individuals and the colour the top-level language phylum. 39 individuals are not included as the specific language is unknown or the two parents are from different language groups. Also see fig. S1. (B) Papuan (blue) and Southeast Asian (red) ancestry proportions as estimated by ADMIXTURE (K=2 with 504 East Asian individuals from the 1000 Genomes Project, also see fig. S3); individuals are grouped by province and then language group (separated by black bars). Ancestry proportions correlate strongly (r = 0.988) with those estimated using f4-ratios (11).
Fig. 2
Fig. 2. PNG Population structure.
(A) When projected onto principal components constructed with only highlander genotypes, all lowlanders (excepting a few outliers) group uniformly. Also see fig. S10. (B) When projected onto principal components constructed with only lowlander genotypes, all highlanders (excepting a few outliers) group uniformly. Also see fig. S11. (C-F) Quantile-quantile plots comparing Z-scores from D-statistics relating highlanders and lowlanders to those expected under a normal distribution (11). (C) Lowlanders are equally similar to different highlander groups. (D) Highlanders have stronger affinity to some lowlander groups than to others. (E) Highlanders are more similar to each other than to lowlanders. (F) Lowlanders are not always more similar to each other than to highlanders. (G) Z-scores (capped at 6) of two different D-statistics, the first measuring if the highland Gende speakers are more similar to the lowland Sop speakers, living just 40 km away, or to other highlanders (blue meaning more highlander similarity), and the second if Sop are more similar to Gende or to other lowlanders (red meaning more lowlander similarity). (H) Genetic affinity of highlanders (treated as a single group, in grey) to different lowland groups measured by the outgroup f3 statistic f3(Highlanders,X;Aboriginal Australian) (red meaning higher affinity). C-H were calculated after masking lowlander genomes for Southeast Asian ancestry.
Fig. 3
Fig. 3. Time depth of population separation and growth in PNG.
(A) Cross-coalescence curves between highlanders and a northern lowlands Middle Sepik group suggests a split time between 10 and 20 kya. (B) Cross-coalescence curves between highland groups suggest split times within the last ~10 ky (Huli representing the western cluster, Gende and HGDP_H the eastern, figs. S8, S10). These were inferred using MSMC on genomes physically phased using linked-read sequencing. Also see fig. S12. (C) Effective population size histories inferred using SMC++ on five genomes per group. Also see fig. S14.
Fig. 4
Fig. 4. Genetic differentiation in PNG.
Geographical distance between groups plotted against FST, after masking lowlander genomes for Southeast Asian ancestry. Grey lines indicate FST between selected 1000 Genomes Project populations.

Comment in

References

    1. O'Connell JF, Allen J. The process, biotic impact, and global implications of the human colonization of Sahul about 47,000 years ago. J Archaeol Sci. 2015;56:73–84.
    1. Denham T, Barton H. The emergence of agriculture in New Guinea: a model of continuity from pre-existing foraging practices. In: Kennett DJ, Winterhalder B, editors. Behavioral Ecology and the Transition to Agriculture. 2006. pp. 237–264.
    1. Lewis MP, Simons GF, Fennig CD. Ethnologue: Languages of the World. Nineteenth edition. 2016.
    1. Pawley A. The chequered career of the Trans New Guinea hypothesis: recent research and its implications. In: Pawley A, Attenborough R, Golson J, Hide R, editors. Papuan Pasts: cultural, linguistic and biological histories of Papuan-speaking peoples. 2005. pp. 67–107.
    1. Bergström A, Nagle N, Chen Y, McCarthy S, Pollard MO, Ayub Q, Wilcox S, Wilcox L, van Oorschot RA, McAllister P, Williams L, et al. Deep Roots for Aboriginal Australian Y Chromosomes. Curr Biol. 2016;26:809–813. - PMC - PubMed

Publication types

LinkOut - more resources