

doi: 10.1038/s41598-017-11854-1.
Measuring critical transitions in financial markets
Affiliations
- PMID: 28912453
- PMCID: PMC5599602
- DOI: 10.1038/s41598-017-11854-1
Item in Clipboard
Measuring critical transitions in financial markets
Sci Rep.
.
Abstract
Tipping points in complex systems are structural transitions from one state to another. In financial markets these critical points are connected to systemic risks, which have led to financial crisis in the past. Due to this, researchers are studying tipping points with different methods. This paper introduces a new method which bridges the gap between real-world portfolio management and statistical facts in financial markets in order to give more insight into the mechanics of financial markets.
Conflict of interest statement
The authors declare that they have no competing interests.
Figures

Similarity matrix ζ for the minimal variance investor approximation. There is a clear separation in October 2008 and again in October 2011. The subclusters are also a sign of minor changes within the minimum-variance portfolios.
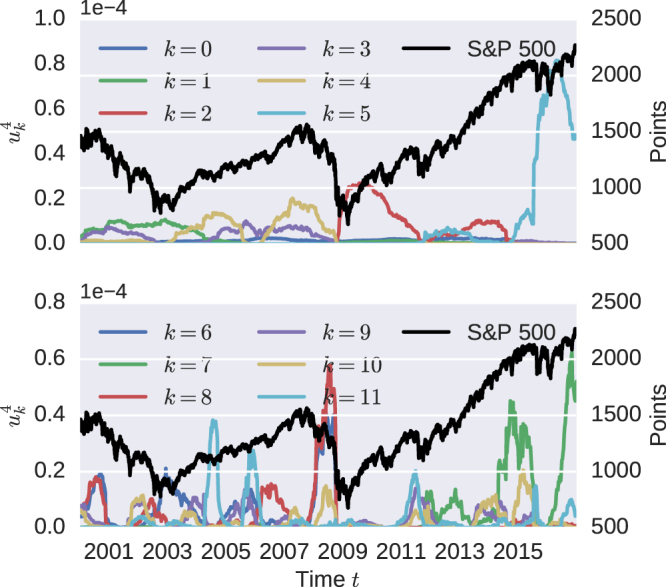
The fourth power of the first twelve eigenvectors for the minimum-variance similarity matrix (γ = 0) in comparison to the S&P 500 Index (black line). There are several transition present from 2000–2017. For example, the high similarity between portfolios are mainly described by eigenvectors k = 6, 8, 10.

States for the minimal variance investor for different sets of eigenvectors. The eigenvectors k = 0, 1 cover 39%, k = 0, ..., 3 cover 57% and k = 0, .., 5 make up 71% of the similarity matrix information.
References
-
- Petersen, A. M., Wang, F., Havlin, S. & Stanley, H. E. Market dynamics immediately before and after financial shocks: Quantifying the Omori, productivity, and Bath laws. Physical Review E - Statistical, Nonlinear, and Soft Matter Physics82 (2010). - PubMed
-
- Preis T, Stanley HE. Switching phenomena in a system with no switches. Journal of Statistical Physics. 2010;138:431–446. doi: 10.1007/s10955-009-9914-y. - DOI
-
- Preis T. Econophysics—complex correlations and trend switchings in financial time series. The European Physical Journal-Special Topics. 2011;194:5–86. doi: 10.1140/epjst/e2011-01397-y. - DOI
LinkOut - more resources
Full Text Sources
Other Literature Sources
Miscellaneous
