. 2017 Sep 14;8(1):542.
doi: 10.1038/s41467-017-00630-4.

Serial millisecond crystallography for routine room-temperature structure determination at synchrotrons

Affiliations

Serial millisecond crystallography for routine room-temperature structure determination at synchrotrons

Tobias Weinert et al. Nat Commun. .

Abstract

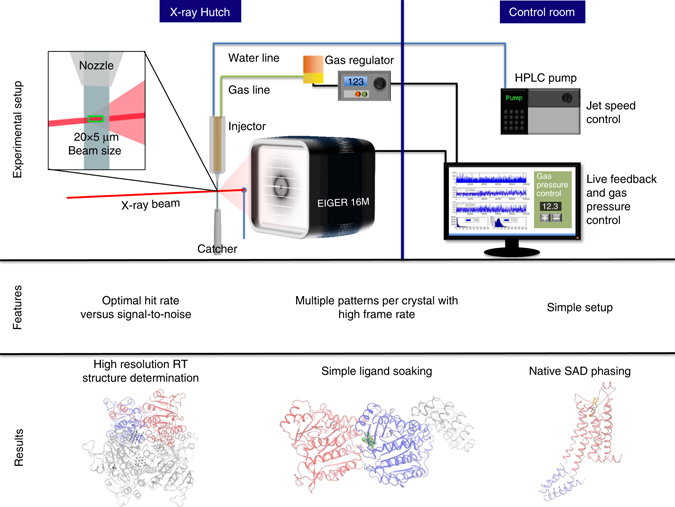
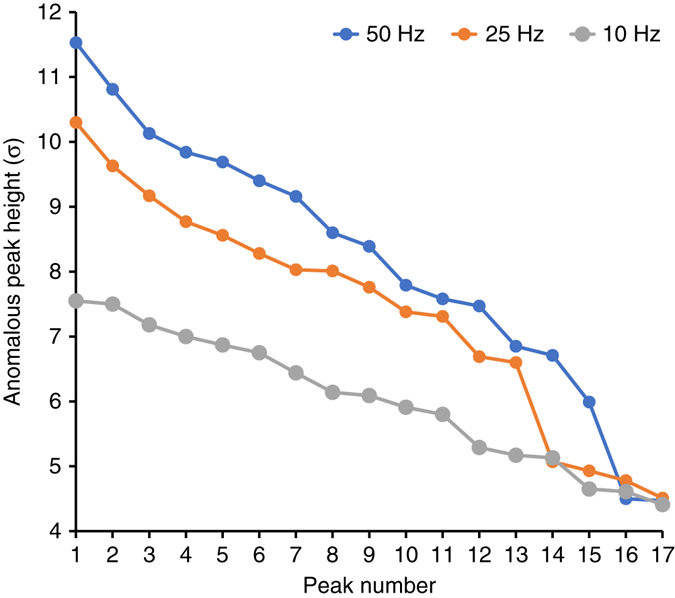
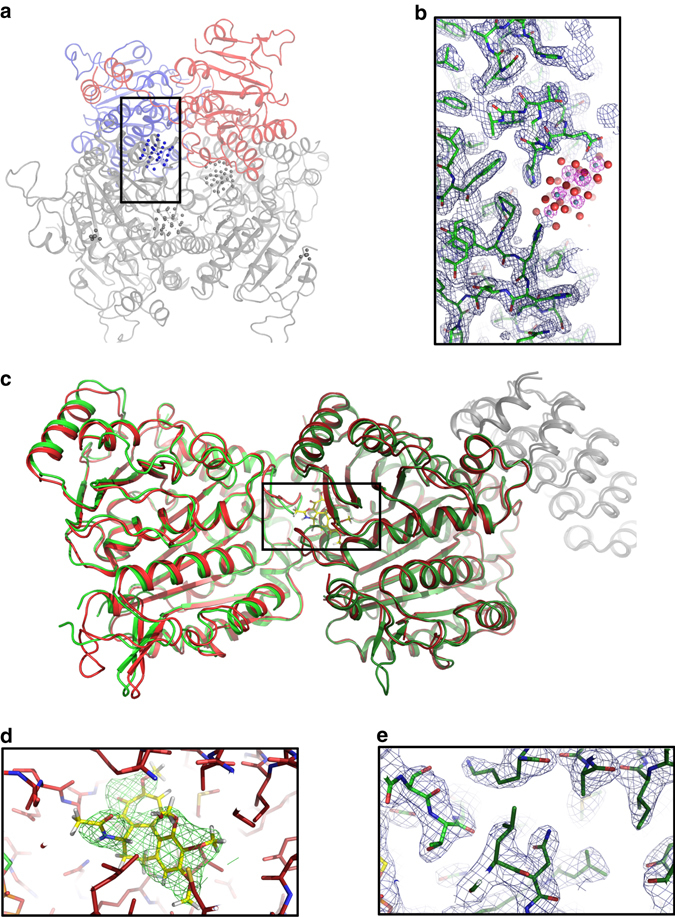
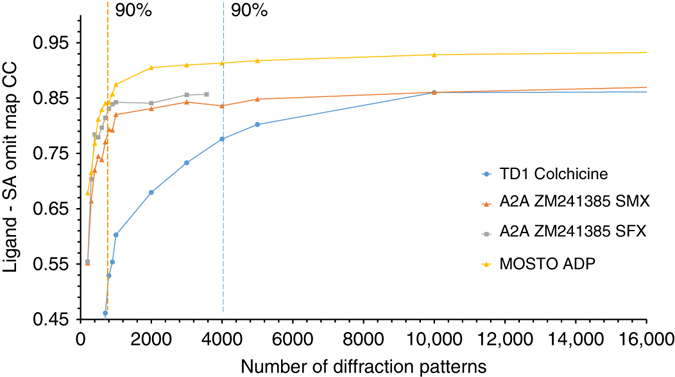
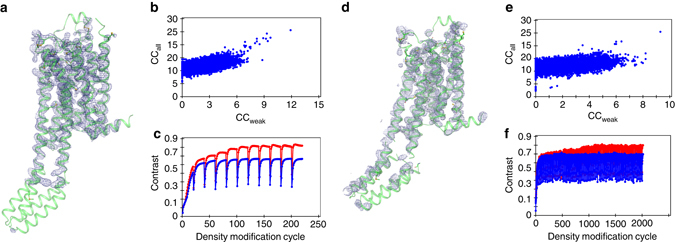
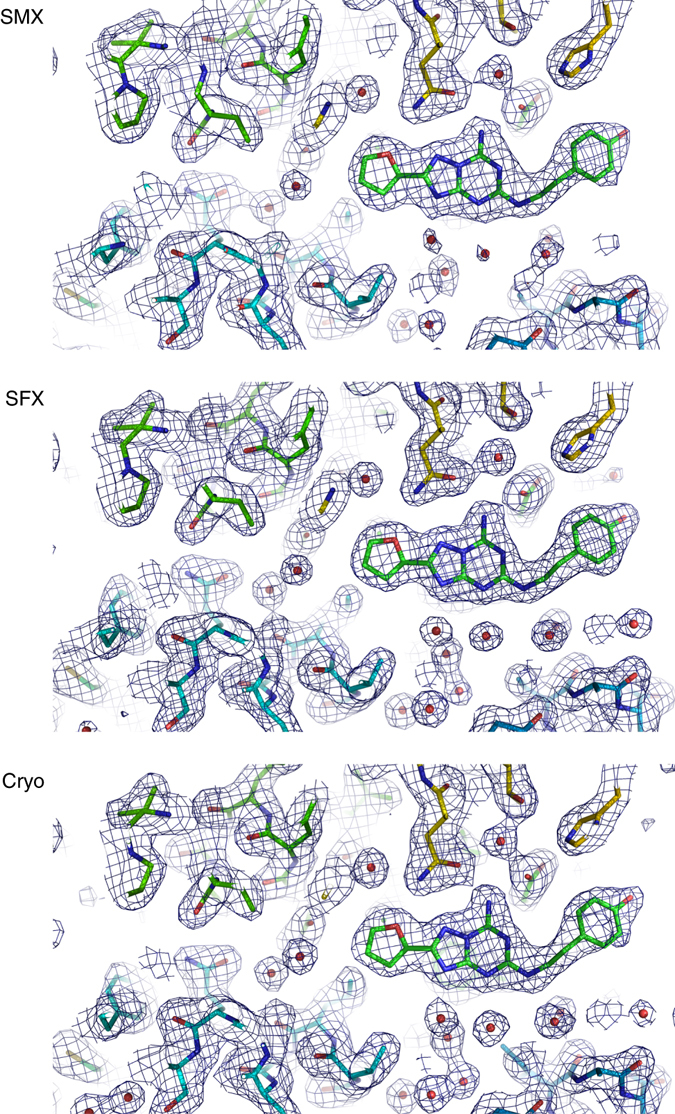
Historically, room-temperature structure determination was succeeded by cryo-crystallography to mitigate radiation damage. Here, we demonstrate that serial millisecond crystallography at a synchrotron beamline equipped with high-viscosity injector and high frame-rate detector allows typical crystallographic experiments to be performed at room-temperature. Using a crystal scanning approach, we determine the high-resolution structure of the radiation sensitive molybdenum storage protein, demonstrate soaking of the drug colchicine into tubulin and native sulfur phasing of the human G protein-coupled adenosine receptor. Serial crystallographic data for molecular replacement already converges in 1,000-10,000 diffraction patterns, which we collected in 3 to maximally 82 minutes. Compared with serial data we collected at a free-electron laser, the synchrotron data are of slightly lower resolution, however fewer diffraction patterns are needed for de novo phasing. Overall, the data we collected by room-temperature serial crystallography are of comparable quality to cryo-crystallographic data and can be routinely collected at synchrotrons.Serial crystallography was developed for protein crystal data collection with X-ray free-electron lasers. Here the authors present several examples which show that serial crystallography using high-viscosity injectors can also be routinely employed for room-temperature data collection at synchrotrons.


Conflict of interest statement

M.H. and G.S. are co-founders of leadXpro AG, a company exploring serial crystallography for structure based drug design. R.C. is an employee of leadXpro AG. A.D., T.G. and R.M.C. are employees of Heptares, a drug discovery and development company working in the field of G-protein-coupled receptor structure-based drug design. The remaining authors declare no competing financial interests.

Figures

Fig. 1
Fig. 1
SMX setup, features and overview of results. The schematic of the SMX experimental setup at the Swiss Light Source shows the high-viscosity injector set to extrude a 50 µm diameter stream of crystal laden LCP (or other viscous carrier) vertically through the interaction region with the X-ray beam and into a catcher for safe and clean disposal of material. The micro-focused beam is centered on the extruded medium ~50 µm below the nozzle. The jet speed determines exposure time and is calculated from the nozzle diameter and sample flow rate (which is calculated from the pump flow rate). The extrusion is controlled with a helium sheath, which can be adjusted with the pressure regulator to maximize jet stability. A typical beam size in our experiments is 20 µm horizontal and 5 µm vertical with respect to the extruded medium. This size allows for a large interaction volume and maximum flux. Data are sent to the beamline data collection servers where real-time peak finding is fed back to the user
Fig. 2
Fig. 2
Detector frame rate vs. anomalous peak height. The plot reveals that high frame rate data collection results not only in larger anomalous peak heights but also resolves more sites
Fig. 3
Fig. 3
Structures of the molybdenum storage protein (MOSTO) and Tubulin (TD1). a The protein forms a heterohexameric (αβ)3 cage-like structure with polyoxomolybdate clusters bound inside the cage. The α- and β- subunits present in the asymmetric unit of the SMX structure are shown as red and blue cartoons and the remaining two αβ-units completing the heterohexamer are shown in gray. b The zoomed polyoxomolybdate cluster binding site was drawn for the polypeptide with an 2Fo–Fc electron density in blue at 1σ and for the molybdenum cluster (molybdenum and oxygen shown as gray and red spheres) in pink at 10σ, highlighting the positions of the polynuclear molybdenum-oxide aggregates. c Overlay of TD1apo and TD1col SMX structures shown as green and red cartoons, respectively. The DARPin is shown as gray cartoon and α-tubulin and β-tubulin subunits are shown as bright red or bright green and dark red or dark green, respectively. d Zoom in on TD1col. Surrounding residues are shown as red sticks and colchicine is shown as yellow sticks with the surrounding Fo–Fc density of the structure refined without the ligand at 3σ. e Zoom in on TD1apo. Surrounding residues are shown as green sticks with the surrounding 2Fo–Fc density of the structure at 1σ
Fig. 4
Fig. 4
Data convergence. The plot shows the cross correlation between the final refined positions of soaked colchicine bound to TD1, co-crystallized ZM241385 bound to A2AR for SMX and SFX data and intrinsic ADP bound to MOSTO with the 2Fo–Fc simulated annealing ligand omit map vs. the number of indexed diffraction patterns. The dotted lines mark the spot were 90% of the final cross correlation is reached
Fig. 5
Fig. 5
Native SAD phasing of the human A2AR with high quality (19 h data collection) and minimal (5 h data collection) data sets. a Experimental density of the high-quality data set after SHELXE phasing, density modification and chain tracing superimposed with the refined structure. b Substructure solution of the high-quality data set in SHELXD. c Combined phasing, chain tracing and density modification of the high-quality data set in SHELXE. d Experimental density of the minimal data set after SHELXE phasing, density modification and chain tracing superimposed with the refined structure. e Substructure solution of the minimal data set in SHELXD. f Combined phasing, chain tracing and density modification of the minimal data set in SHELXE
Fig. 6
Fig. 6
Comparison of the A2A receptor electron density obtained using SMX, SFX and conventional cryo-crystallographic data. The structures show the ligand binding pocket with 2Fo–Fc maps shown at 1σ. All data sets were collected using A2AR crystals prepared in the same way to facilitate a direct comparison of the techniques. The SMX density is well defined, but the overall resolution (2.1 Å) is lower than in SFX (1.7 Å) and cryo-crystallography (1.95 Å)

References

    1. Chapman HN, et al. Femtosecond X-ray protein nanocrystallography. Nature. 2011;470:73–77. doi: 10.1038/nature09750. - DOI - PMC - PubMed
    1. Suga M, et al. Native structure of photosystem II at 1.95 Å resolution viewed by femtosecond X-ray pulses. Nature. 2014;517:99–103. doi: 10.1038/nature13991. - DOI - PubMed
    1. Weierstall U, et al. Lipidic cubic phase injector facilitates membrane protein serial femtosecond crystallography. Nat. Commun. 2014;5:3309. doi: 10.1038/ncomms4309. - DOI - PMC - PubMed
    1. Zhang H, et al. Structure of the angiotensin receptor revealed by serial femtosecond crystallography. Cell. 2015;161:833–844. doi: 10.1016/j.cell.2015.04.011. - DOI - PMC - PubMed
    1. Kang Y, et al. Crystal structure of rhodopsin bound to arrestin by femtosecond X-ray laser. Nature. 2015;523:561–7. doi: 10.1038/nature14656. - DOI - PMC - PubMed

Publication types

LinkOut - more resources