. 2017 Sep 14;7(1):11652.
doi: 10.1038/s41598-017-10412-z.

Global organization of a binding site network gives insight into evolution and structure-function relationships of proteins

Affiliations

Global organization of a binding site network gives insight into evolution and structure-function relationships of proteins

Juyong Lee et al. Sci Rep. .

Abstract

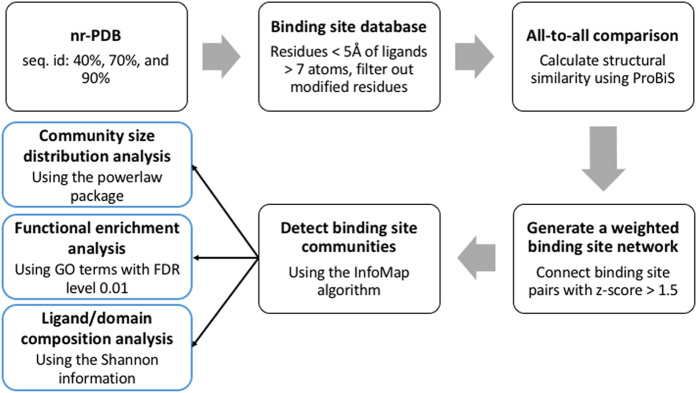
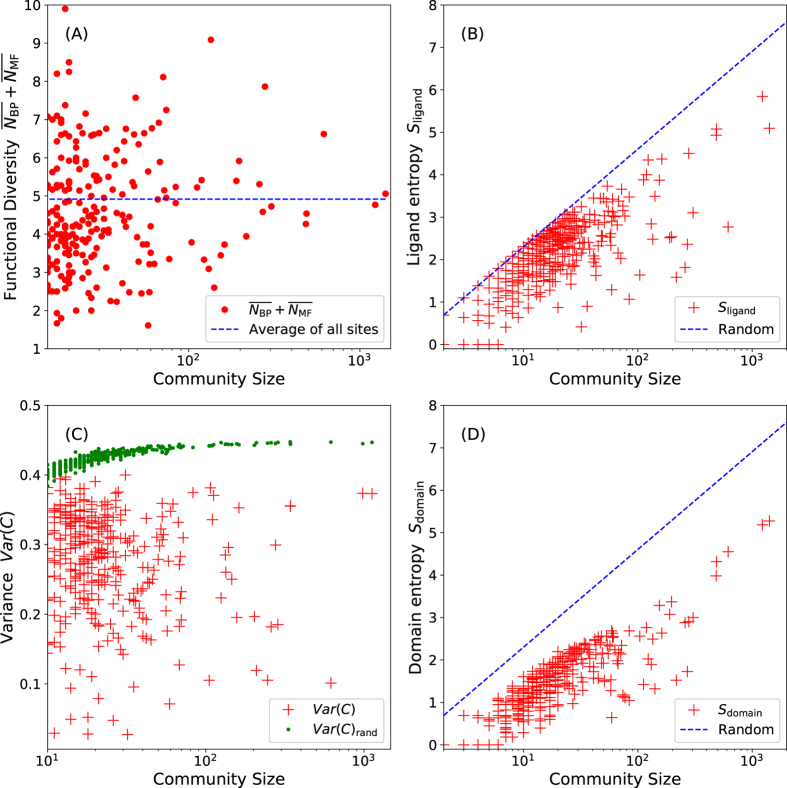
The global organization of protein binding sites is analyzed by constructing a weighted network of binding sites based on their structural similarities and detecting communities of structurally similar binding sites based on the minimum description length principle. The analysis reveals that there are two central binding site communities that play the roles of the network hubs of smaller peripheral communities. The sizes of communities follow a power-law distribution, which indicates that the binding sites included in larger communities may be older and have been evolutionary structural scaffolds of more recent ones. Structurally similar binding sites in the same community bind to diverse ligands promiscuously and they are also embedded in diverse domain structures. Understanding the general principles of binding site interplay will pave the way for improved drug design and protein design.


Conflict of interest statement

The authors declare that they have no competing interests.

Figures

Figure 1
Figure 1
Flow diagram for binding site community analysis.
Figure 2
Figure 2
Binding site community network. The 39 highest similarities between binding site communities and associated 20 binding site communities using ProBiS are displayed. A node corresponds to a binding site community and its size is proportional to the number of included binding sites and the bigger nodes correspond to higher ranked communities. Node shade represents the aggregated structural similarity between binding sites in the community. Edge width is proportional to the structural similarities between communities. Node label, e g., C1.HEM.CLA, is composed of the community rank (C1 is the community of rank one) according to the number of the included binding sites, and of the PDB codes of the two most populated ligands (HEM stands for heme, CLA is chloropyll a). The binding site communities shown in this network contain 43.3% of all non-redundant existing binding sites in the PDB database. The ligand IDs associated with binding site communities from C1 to C10 are listed as follows: CIT – citric acid, AKG – alpha-ketoglutaric acid, CLA – chloropyll a, HEM – heme, GDP – guanosine-5′-diphosphate, ADP - adenosine-5′-diphosphate, IPE – isopentenyl pyrophosphate, POP – pyrophosphate 2, AP5 - bis(adenosine)-5′-pentaphosphate, NAD - nicotinamide adenine dinucleotide, NAP - nicotinamide adenine dinucleotide phosphate, ANP - phosphoaminophosphonic acid-adenylate ester, ATP - adenosine-5′-triphosphate, SAH - S-adenosyl-L-homocysteine, SAM - S-adenosylmethionine, FAD - flavin adenine dinucleotide, HEC – heme C. The full list of community detection results as well as the rest of ligand IDs and their associated names are listed in Supplementary Information.
Figure 3
Figure 3
Size distributions of binding site communities. (A) The frequency of binding site communities of size k, (B) the complementary cumulative distribution function (cdf) of community sizes P(k), and (C) the cumulative fraction of binding sites included in binding site communities whose sizes are larger than k are plotted. The cdf function is plotted using the minimum community size of 15, which is determined by the power-law fitting. The inset of the plot (C) shows the cumulative fraction of binding sites included in the communities with more than 14 binding sites. N total is the total number of binding sites in the network. The blue dotted lines in (C) represent the cumulative fractions included in the 30 largest communities. When all communities are considered, 50% of sites are included in the 30 largest communities. If only the communities larger than 14 are considered, 58% of binding sites are included.
Figure 4
Figure 4
Shannon information (entropy) values of the ligand/domain compositions and the functional diversity of binding site communities The x-axes represent the community size using a log-scale. The y-axis of (A) represents the functional diversity of the communities. The average functional diversity of a community is measured by the average number of distinct GO-BP (NBP¯) and GO-MF (NMF¯) terms of included proteins. The average functional diversity of all proteins in the network, 4.9, is denoted as the blue dotted line. The y-axes of subplot (B) and (D) represent the Shannon information values of ligand and domain compositions of communities. The Shannon information values were calculated as follows: S=ipilnpi, where i is the ligand or the domain index. The y-axis of subplot (C) represents the variance of the distances between ligands in a community: Var(C)=1n2ij>i(1Tij)2, where T ij is the Tanimoto coefficient between ligands i and j. The variances of the binding sites communities are plotted with red crosses and the green dots correspond to the variances of the same number of randomly selected ligands.

References

    1. Berman HM, et al. The Protein Data Bank. Nucleic Acids Res. 2000;28:235–242. doi: 10.1093/nar/28.1.235. - DOI - PMC - PubMed
    1. Konc J, Janežič D. ProBiS algorithm for detection of structurally similar protein binding sites by local structural alignment. Bioinformatics. 2010;26:1160–1168. doi: 10.1093/bioinformatics/btq100. - DOI - PMC - PubMed
    1. Konc J, Depolli M, Trobec R, Rozman K, Janežič D. Parallel-ProBiS: Fast parallel algorithm for local structural comparison of protein structures and binding sites. J. Comput. Chem. 2012;33:2199–2203. doi: 10.1002/jcc.23048. - DOI - PubMed
    1. Konc J, Česnik T, Konc JT, Penca M, Janežič D. ProBiS-database: Precalculated binding site similarities and local pairwise alignments of PDB structures. J. Chem. Inf. Model. 2012;52:604–612. doi: 10.1021/ci2005687. - DOI - PMC - PubMed
    1. Konc J, Janežič D. ProBiS-ligands: A web server for prediction of ligands by examination of protein binding sites. Nucleic Acids Res. 2014;42:215–220. doi: 10.1093/nar/gku460. - DOI - PMC - PubMed

Publication types

LinkOut - more resources