. 2017 Sep 14;7(1):11577.
doi: 10.1038/s41598-017-11002-9.

ROS induced distribution of mitochondria to filopodia by Myo19 depends on a class specific tryptophan in the motor domain

Affiliations

ROS induced distribution of mitochondria to filopodia by Myo19 depends on a class specific tryptophan in the motor domain

Boris I Shneyer et al. Sci Rep. .

Abstract

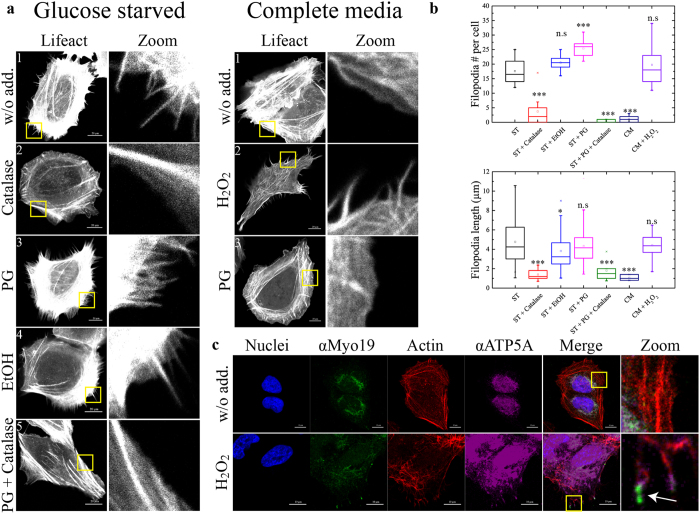
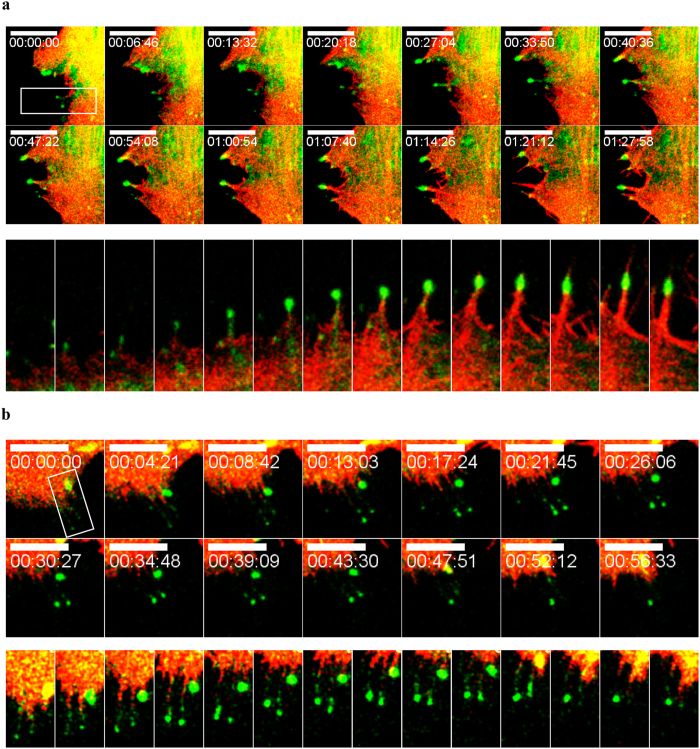
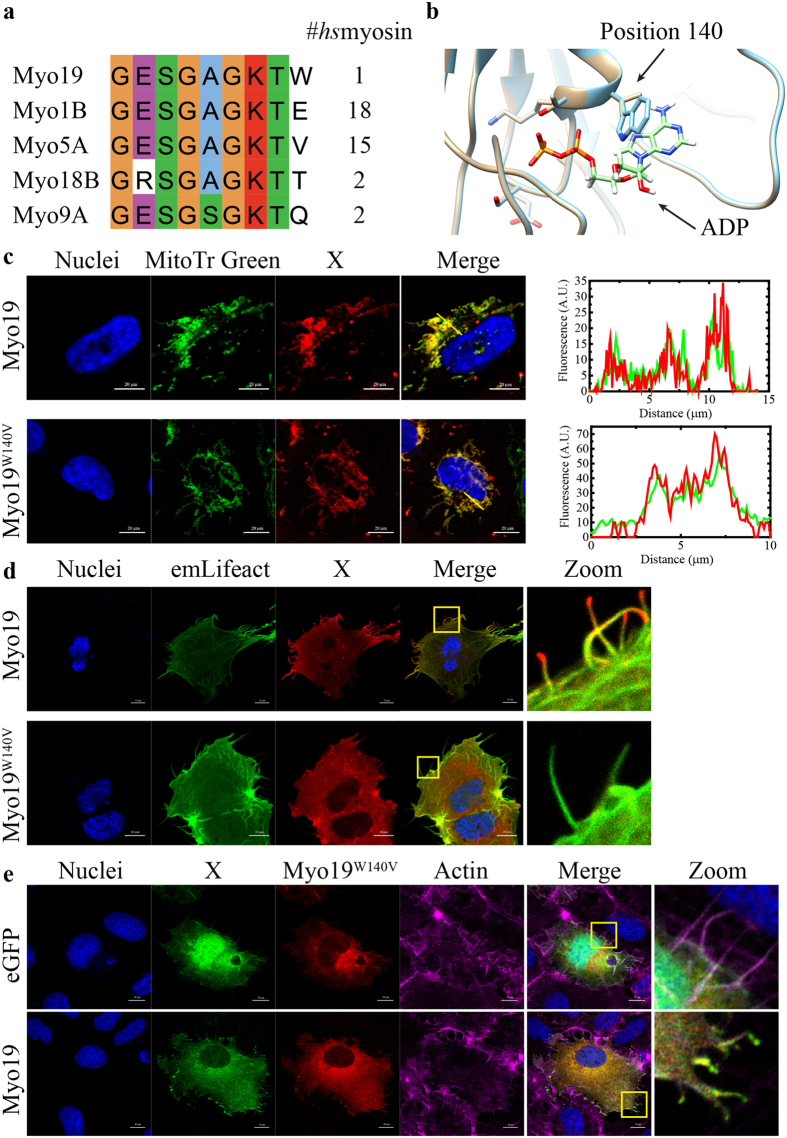
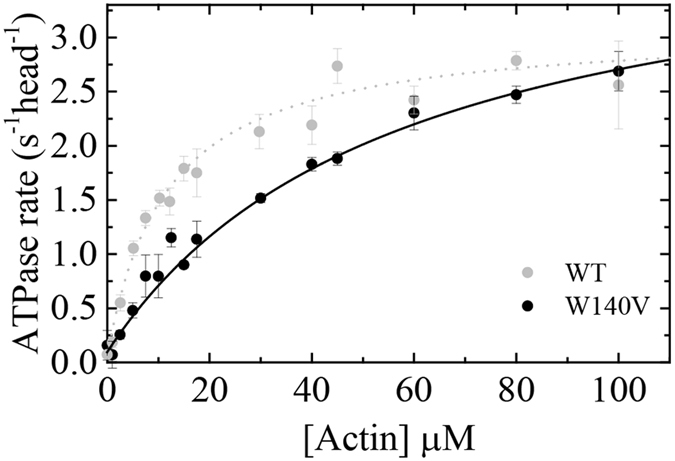
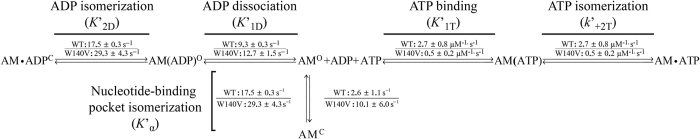
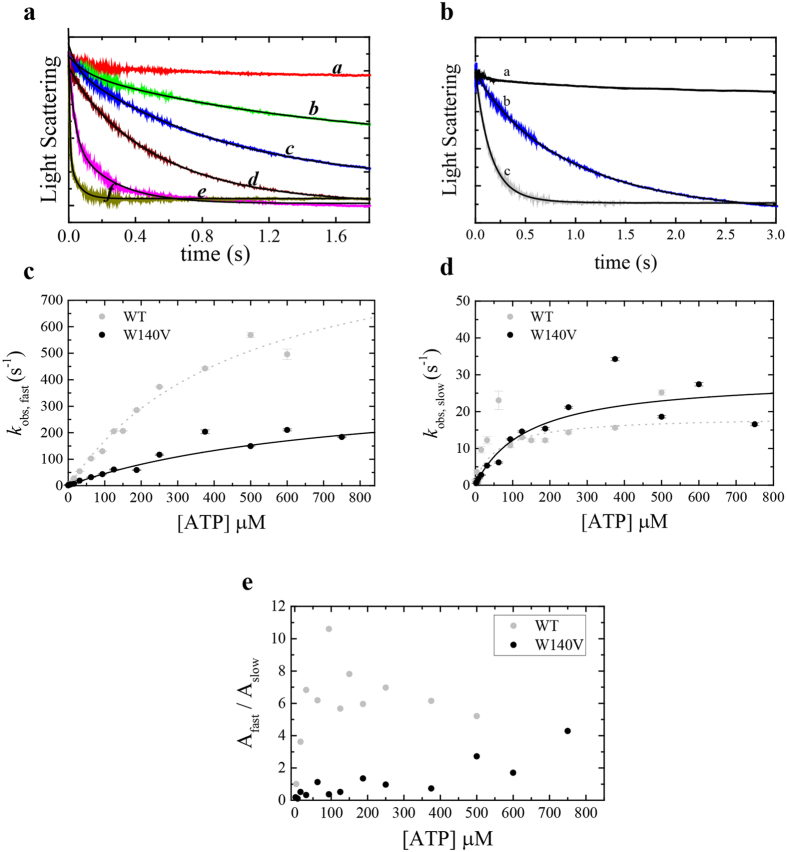
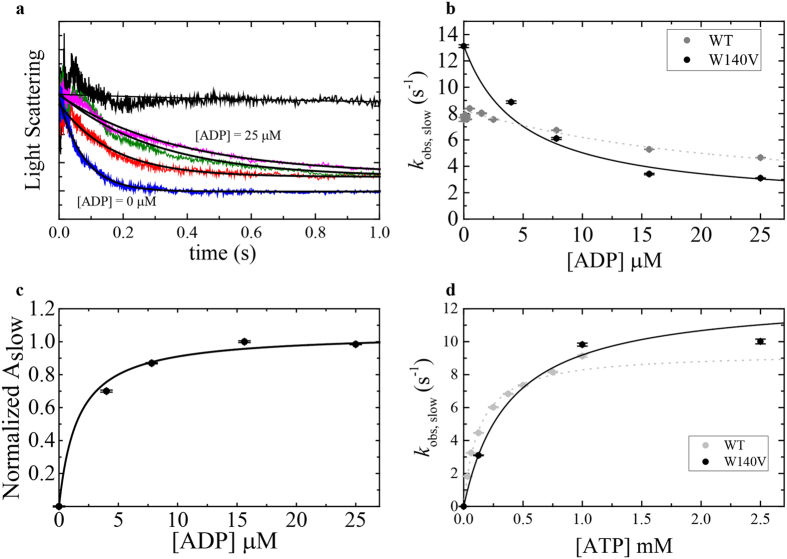
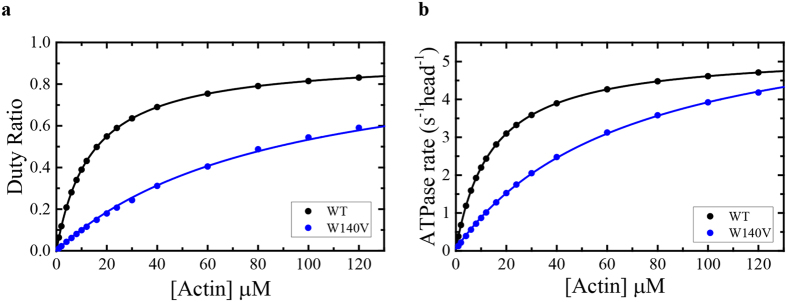
The role of the actin cytoskeleton in relation to mitochondria function and dynamics is only recently beginning to be recognized. Myo19 is an actin-based motor that is bound to the outer mitochondrial membrane and promotes the localization of mitochondria to filopodia in response to glucose starvation. However, how glucose starvation induces mitochondria localization to filopodia, what are the dynamics of this process and which enzymatic adaptation allows the translocation of mitochondria to filopodia are not known. Here we show that reactive oxygen species (ROS) mimic and mediate the glucose starvation induced phenotype. In addition, time-lapse fluorescent microscopy reveals that ROS-induced Myo19 motility is a highly dynamic process which is coupled to filopodia elongation and retraction. Interestingly, Myo19 motility is inhibited by back-to-consensus-mutation of a unique residue of class XIX myosins in the motor domain. Kinetic analysis of the purified mutant Myo19 motor domain reveals that the duty ratio (time spent strongly bound to actin) is highly compromised in comparison to that of the WT motor domain, indicating that Myo19 unique motor properties are necessary to propel mitochondria to filopodia tips. In summary, our study demonstrates the contribution of actin-based motility to the mitochondrial localization to filopodia by specific cellular cues.


Conflict of interest statement

The authors declare that they have no competing interests.

Figures

Figure 1
Figure 1
Glucose-starvation induction of filopodia formation is mediated by ROS. (a) Left panel: Filopodia induced by glucose-starvation are inhibited by supplementation of antioxidants to the starvation media. emLifeact (fluorescently tagged actin binding protein) was transiently expressed in U2OS cells to visualize actin and filopodia. The cells were then starved in starvation medium without supplements or supplemented with either catalase (60 µg/ml), Propyl Gallate (PG, 20 µM) or a combination of both (EtOH was used as vehicle). Right panel: ROS induces filopodia formation. emLifeact expressing U2OS cells were exposed to either PG or 0.2 mM H2O2 for two hrs, inducing filopodia formation in complete growth media. Note the lack of effect of PG in complete medium compared to starvation medium. Bar is 20 µm. (b) Quantification of the number and length of the filopodia in (a). Over 300 filopodia were manually counted for each condition from three independent experiments. The significance of the change in both number and length of filopodia was assessed via two tailed Student’s T-test. pVal for filopodia number per cell = 1.4 × 10−6, 0.083, 0.0001, 3.91 × 10−11, 3.57 × 10−11, 0.4.pVal for filopodia length = 1.27 × 10−14, 0.01, 0.093, 0.0027, 0.0035, 0.161 (same order as the chart). (c) Immunofluorescence for endogenous Myo19 in H2O2 stimulated U2OS cells reveals that it localizes with mitochondria at filopodia tips. Blue – nuclei, green – αMyo19, red – phalloidin stained actin, Magenta – The mitochondrial marker ATP5A (ATP-synthase subunit alpha). Bar is 10 µm. Zoom – magnification of the area indicated by the yellow rectangle. We note that the staining of ATP5A is also nuclear, however this is due to the secondary antibody used for detection of ATP5A stains which stains nuclei even in the absence of the ATP5A antibody.
Figure 2
Figure 2
Myo19 selectively localizes to a subset of filopodia. U2OS cells were co-transfected with ruby tagged Myo19 and either GFP tagged Myo10 or GFP tagged mDia2ΔDAD (constitutively active form of the formin mDia2) that induce filopodia formation. Both Myo10 and mDia2ΔDAD expressing cells exhibit multiple filopodia, however Myo19 localized only to mDia2ΔDAD induced filopodia tips. Blue – nuclei, green – Myo10 or mDia2ΔDAD, red – ruby tagged Myo19, Magenta – phalloidin stained actin. Bar is 10 µm.
Figure 3
Figure 3
Dynamics of emMyo19 localization to filopodia tips. Montage of fluorescent microscopy images from a time-lapse movie revealing the dynamic nature of emMyo19 motility and localization to filopodia tips and back to the cell body following 0.2 mM H2O2 stimulation. (a) Anterograde motility of emMyo19 towards filopodia tips (b) Retrograde motility of emMyo19 towards the cell body. Kymographs of the boxed region are presented under each panel. Green – emMyo19, Red- Ruby-Lifeact. Bar is 10 µm.
Figure 4
Figure 4
W140 is a conserved residue in Myo19 motor domain which is essential for filopodia tip localization. (a) Sequence alignment of human myosin sequences deposited in Swiss-Prot shows the presence of a unique Tryptophan instead of the consensus Valine or Glutamic acid, the unique Tryptophan is preserved in almost all Myo19 homologs (38/39). (b) Homology based structure prediction of Myo19 (cyan) and Myo19W140V(tan) via the Phyre2 server, aligned with two solved human Myo5 structures (not shown, RCSB: 4ZG4, 1W7J) with bound ADP (shown) in the P-Loop. (c) Co-localization of Halo tagged Myo19 or the Myo19W140V mutant with the mitochondrial stain, MitoTracker Green-FM. The intensity plots generated from the yellow line reveal that the mutant localizes to mitochondria similarly to the wild-type. Bar is 20 µm. Blue – nuclei, green – MitoTracker Green-FM stained mitochondria, red – Halo tagged Myo19 or Myo19W140V. (d) H2O2 stimulation of U2OS cells over-expressing Halo tagged Myo19 or Myo19W140V results in the localization of Myo19 to filopodia tips, but not of Myo19W140V. Bar is 20 µm. Zoom - magnification of the area indicated by the yellow rectangle. The absence of mitochondria is due to them being in a higher focal plane, whereas these filopodia form at the base of the cell. The weak diffuse signal is most likely resulting from Myo19 over-expression or saturation of mitochondria. Blue – nuclei, green – emLifeAct, red – Halo tagged Myo19 or Myo19W140V. (e) Rescue of Myo19W140V mutant phenotype by WT Myo19. U2OS cells were co-transfected with Halo tagged Myo19W140V and either WT emMyo19 or an eGFP control and induced with H2O2. As previously shown, Myo19W140V was unable to reach filopodia tips. To our surprise, Myo19 was able to rescue the localization defect and promoted the localization of the mutant to the filopodia tips. Blue – nuclei, green – GFP or emMyo19, red – Halo tagged Myo19W140V, Magenta – phalloidin stained actin. Bar is 10 µm.
Figure 5
Figure 5
Actin activated steady state ATPase activity reveals alterations in Myo19-3IQW140V enzymology. The actin filament concentration dependence of the Myo19-3IQ (WT) and Myo19-3IQ W140V (W140V) steady-state ATPase activity. The solid line through the data points is the best fit to a rectangular hyperbola (v=v0+(kcat[actin])/(KATPase+[actin])). Error bars represent standard deviation from at least three independent experiments from different protein purifications. Data for Myo19-3IQ (WT) is reproduced from (Usaj & Henn, parallel submission).
Figure 6
Figure 6
Kinetic reaction scheme comparing the key biochemical transitions between Myo19-3IQ (WT) and Myo19-3IQW140V (W140V) mutant. In this scheme, four nucleotides related kinetic transitions are shown: ADP isomerization step, ADP release step, ATP binding and nucleotide binding pocket isomerization. The rate constants are also listed in Table 1. WT and W140V are abbreviation for the Myo19-3IQ and Myo19-3IQW140V mutant, respectively.
Figure 7
Figure 7
ATP binding to Acto·Myo19W140V-3IQ (W140V) shows different kinetic behavior than the Myo19-3IQ (WT) (a). Time courses of light scattering decrease after mixing 0.25 µM actomyosin with 0 µM (a), 1.95 (b), 3.9 (c), 7.8 (d), 62.5 (e), 125(f), µM ATP for Acto·Myo19W140V-3IQ. Data are averaged transients (n = 3–5). The black lines are the best fits to double exponential function (see SI for analysis of the residuals of the fits). (b) Time course of light scattering decrease after mixing 0.25 µM actomyosin with 0 µM (a) or 7.8 µM ATP for Acto·Myo19-3IQW140V (b) or Acto·Myo19-3IQ (c). Data are averaged transients (n = 3–5). The smooth lines through the data represent best fit to double exponential function (c). [ATP]-dependence of the fast-observed rate constant of ATP binding to Acto·Myo19-3IQW140V in comparison to Acto·Myo19-3IQ as measured by light scattering. (d) [ATP]-dependence of the slow observed rate constant of ATP binding to Acto·Myo19-3IQW140V in comparison to Acto·Myo19-3IQ as measured by light scattering. The lines through the data points in c and d are the best fit to rectangular hyperbola. Error bars of the fitting are within data points. (e) The ratio of the fast (Afast) to slow (Aslow) amplitudes of the observed fast and slow rate constants as a function of [ATP] for Acto·Myo19-3IQW140V in comparison to Acto·Myo19-3IQ. Data for Myo19-3IQ (WT) is reproduced from (Usaj & Henn, parallel submission).
Figure 8
Figure 8
ADP dissociation from Acto·Myo19-3IQ W140V (W140V) measured by kinetic competition with ATP in comparison to Acto·Myo19-3IQ (WT). (a) Normalized time courses of light scattering decrease after mixing 0.2 µM Acto·Myo19-3IQW140V with 0 µM ATP (upper trace) or 125 µM ATP in presence of different [ADP] ranging from 0 to 25 µM. Data are averaged transients (n = 3–5). Smooth lines (black) through the data represent best fits to double or single exponential functions. (b) [ADP]-dependence of the observed slow rate constant for Acto·Myo19-3IQ and single observed rate constant for Acto·Myo19-3IQW140V as measured by kinetic competition with 125 µM ATP. (c) [ADP]-dependence of normalized amplitudes of the slow phase obtained by fitting transients described in (a). (d) [ATP]-dependence of the observed rate constant for Acto·Myo19-3IQ and Acto·Myo19-3IQW140V dissociation as measured by light scattering at saturated [ADP] of 25 µM. The lines through the data points in (b,c and d) are the best fits to rectangular hyperbola. Error bars of the fittings are within data points. Data for Myo19-3IQ (WT) is reproduced from (Usaj & Henn, parallel submission).
Figure 9
Figure 9
Simulation of the ATPase activity and duty ratio of Myo19-3IQ (WT) and Myo19W140V-3IQ (W140V). (a) Simulated steady state [actin]-dependence of the ATPase activity of the Myo19-3IQ and the mutant Myo19W140V-3IQ. The solid lines through the data points are the best fit to a rectangular hyperbola (v=v0+(kcat[actin])/(KATPase+[actin])). (b) Duty ratio as a function of [actin]. The duty ratio was calculated from the summation of all the biochemical intermediates distribution at each [actin] at the steady-state time regime according to equation: duty ratio = (strongly bound states)/(strongly bound states + weakly bound states). The solid lines through the data points are the best fit to a rectangular hyperbola (dutyratio=1[actin])/(KDR+[actin])). Data for Myo19-3IQ (WT) is reproduced from (Usaj & Henn, parallel submission).

Similar articles

Cited by

References

    1. Nunnari J, Suomalainen A. Mitochondria: in sickness and in health. Cell. 2012;148:1145–1159. doi: 10.1016/j.cell.2012.02.035. - DOI - PMC - PubMed
    1. Desai SP, Bhatia SN, Toner M, Irimia D. Mitochondrial localization and the persistent migration of epithelial cancer cells. Biophysical journal. 2013;104:2077–2088. doi: 10.1016/j.bpj.2013.03.025. - DOI - PMC - PubMed
    1. Picard M, Shirihai OS, Gentil BJ, Burelle Y. Mitochondrial morphology transitions and functions: implications for retrograde signaling. American journal of physiology. Regulatory, integrative and comparative physiology. 2013;304:R393–406. doi: 10.1152/ajpregu.00584.2012. - DOI - PMC - PubMed
    1. Lin MT, Beal MF. Mitochondrial dysfunction and oxidative stress in neurodegenerative diseases. Nature. 2006;443:787–795. doi: 10.1038/nature05292. - DOI - PubMed
    1. Chen H, Chan DC. Mitochondrial dynamics–fusion, fission, movement, and mitophagy–in neurodegenerative diseases. Human molecular genetics. 2009;18:R169–176. doi: 10.1093/hmg/ddp326. - DOI - PMC - PubMed

Publication types

MeSH terms