. 2017 Sep 14;7(1):11572.
doi: 10.1038/s41598-017-10615-4.

Transcriptome analysis of developing lens reveals abundance of novel transcripts and extensive splicing alterations

Affiliations

Transcriptome analysis of developing lens reveals abundance of novel transcripts and extensive splicing alterations

Rajneesh Srivastava et al. Sci Rep. .

Abstract

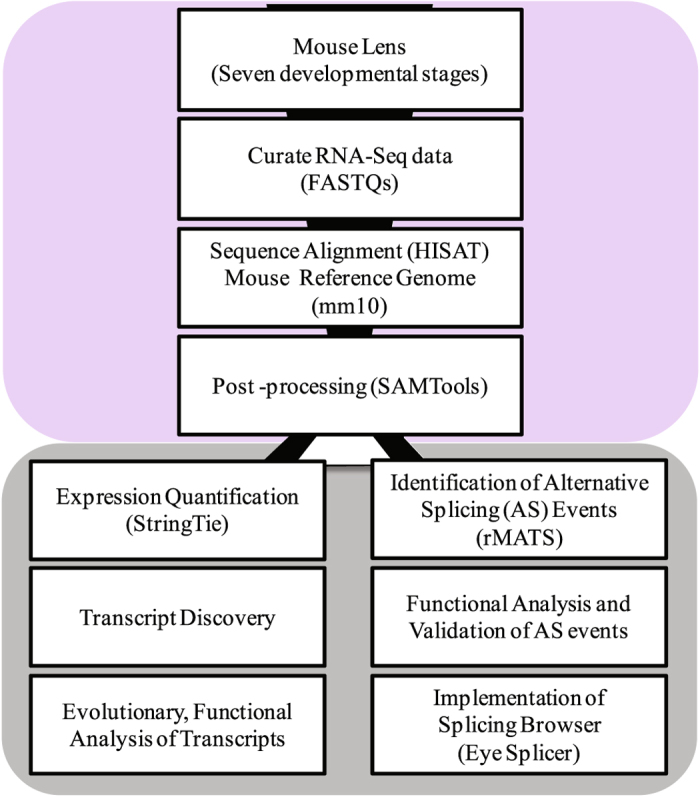
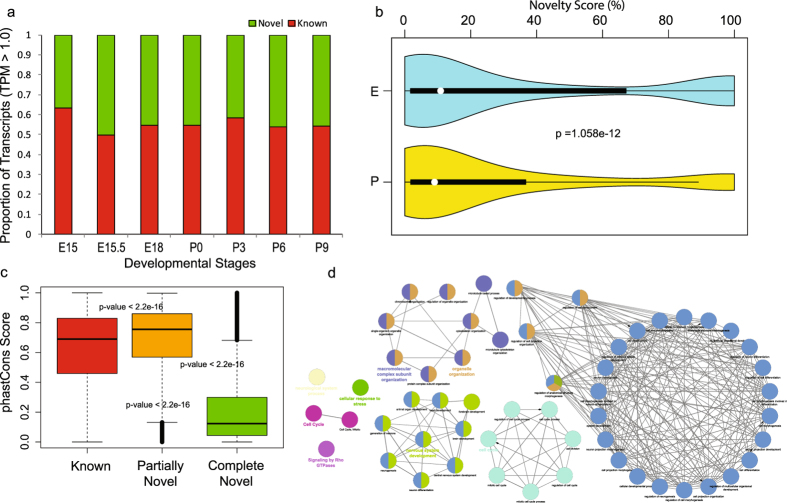
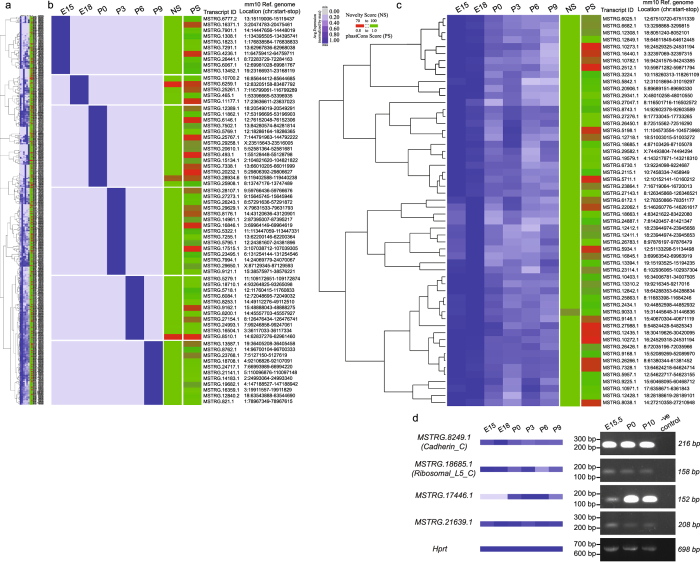
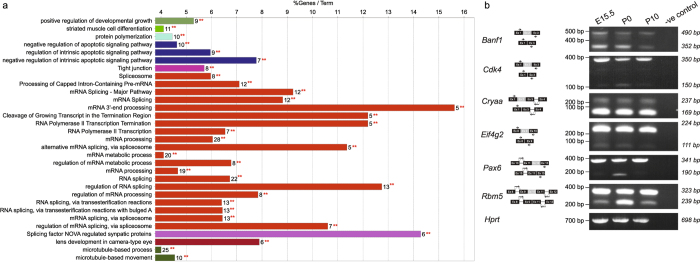
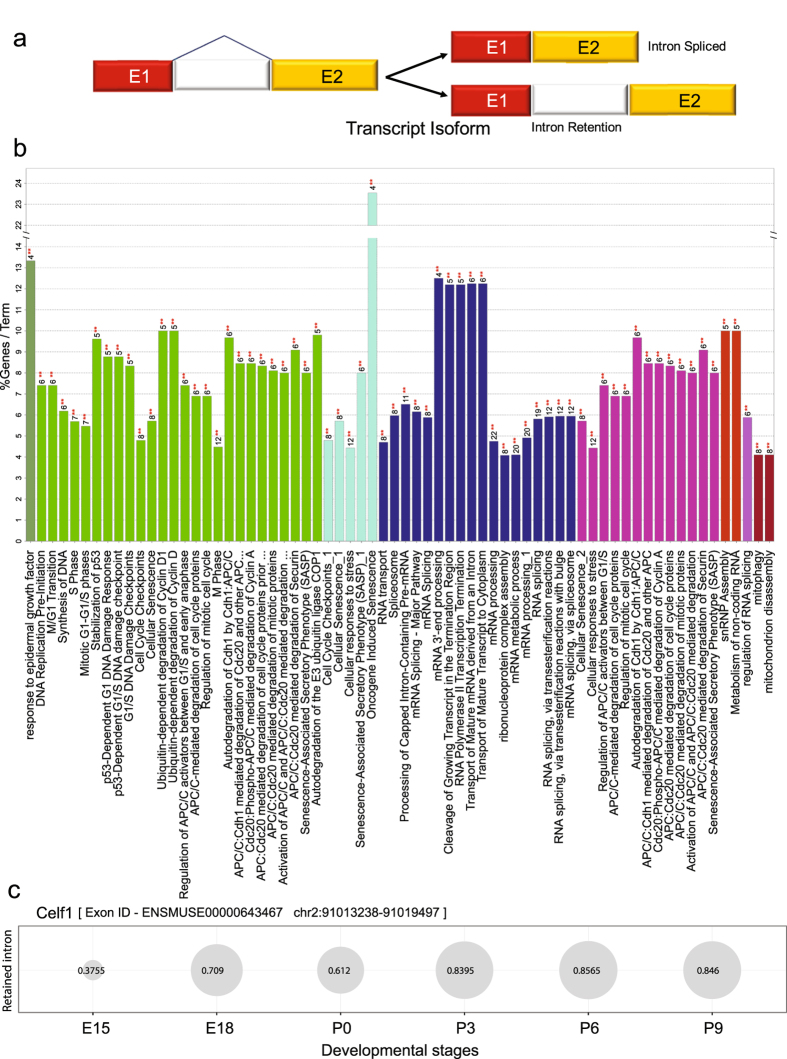
Lens development involves a complex and highly orchestrated regulatory program. Here, we investigate the transcriptomic alterations and splicing events during mouse lens formation using RNA-seq data from multiple developmental stages, and construct a molecular portrait of known and novel transcripts. We show that the extent of novelty of expressed transcripts decreases significantly in post-natal lens compared to embryonic stages. Characterization of novel transcripts into partially novel transcripts (PNTs) and completely novel transcripts (CNTs) (novelty score ≥ 70%) revealed that the PNTs are both highly conserved across vertebrates and highly expressed across multiple stages. Functional analysis of PNTs revealed their widespread role in lens developmental processes while hundreds of CNTs were found to be widely expressed and predicted to encode for proteins. We verified the expression of four CNTs across stages. Examination of splice isoforms revealed skipped exon and retained intron to be the most abundant alternative splicing events during lens development. We validated by RT-PCR and Sanger sequencing, the predicted splice isoforms of several genes Banf1, Cdk4, Cryaa, Eif4g2, Pax6, and Rbm5. Finally, we present a splicing browser Eye Splicer ( http://www.iupui.edu/~sysbio/eye-splicer/ ), to facilitate exploration of developmentally altered splicing events and to improve understanding of post-transcriptional regulatory networks during mouse lens development.


Conflict of interest statement

The authors declare that they have no competing interests.

Figures

Figure 1
Figure 1
(a) Overview of the transcriptome analysis across developmental stages in mouse lens. Transcriptomes of mouse lens spanning seven developmental stages (three embryonic; E15, E15.5, E18 and four postnatal; P0, P3, P6, P9 stages with biological replicates) were collected from published sources for our study. Curated RNA sequence data was quality filtered using FASTX toolkit. High quality raw sequence reads were processed and aligned to mouse reference genome mm10 using HISAT and output collected as SAM files. Post processing (i.e. conversion of SAM to sorted BAM) of aligned reads was accomplished using SAMTools. Aligned and post processed RNA-Seq bam files associated with each developmental stage were utilized for two purposes. Firstly, for identifying and quantifying the expression levels of known and novel transcripts across seven developmental stages using StringTie, followed by an evolutionary and functional analysis to uncover high confident completely novel transcripts in developing lens. Secondly, the processed bam files were also employed for the identification of alternative splicing events using rMATS (replicate Multivariate Analysis of Transcript Splicing) followed by functional analysis of genes belonging to the enriched splice events. Finally, the results of the most prominent splicing events namely skipped exon and retained intron events are also made available through Eye splicer, a web based splicing browser showing developmentally altered splicing events in mouse lens.
Figure 2
Figure 2
(a) Histogram showing the proportion of known and novel transcripts identified across various lens developmental stages in mouse. Only transcripts exhibiting an expression higher than 1 TPM (Transcripts Per Million reads sequenced) are considered in this plot. However, the proportions of known versus novel remained stable irrespective of the threshold on the expression level of a transcript (Figure S1). (b) Violin plot showing the distributions of novelty scores of identified transcripts, expressed in embryonic and postnatal stages. Violin plot represents the boxplot combined with kernel density showing the distribution pattern of a data vector. Novelty score of the transcripts expressed (with TPM > 5.0) at least in one stage were employed to generate two violin plots corresponding to the embryonic (E15, E15.5, E18) and postnatal (P0, P3, P6, P9) stages respectively. Differences in the distribution of novelty scores between embryonic and post-natal stages were compared using Kolmogorov–Smirnov test. Median novelty score for E and P were 10.89 and 9.043 respectively. (c) This panel shows the distribution of PhastCons scores, reflecting the extent of conservation for known, partially novel (novelty score < 70%) and completely novel (novelty score ≥ 70%) transcripts identified across developmental stages in lens. The phastCons score (PS) provides nucleotide level conservation of mouse genomic loci across 46 vertebrate genomes. We found each pair of these transcript classes to be significantly different in their extent of conservation (p < 2.2e-16, Wilcoxon rank sum test) with median conservation scores 0.67, 0.76, and 0.13 for known, partially novel and completely novel transcript groups respectively. (d) Gene ontology enrichment based functional grouping using annotations for genes corresponding to the high confidence partially novel transcripts (PS > 0.76). Functional grouping of the GO-terms based on GO hierarchy was represented as clustered GO-network using the Cytoscape-ClueGO plugin. Significant clustering (p < 1e-10) of genes (color coded by functional annotation group they belong to) based on enriched GO-biological processes generated by ClueGO analysis, with size of the nodes indicating the level of significant association of genes per GO-term, were shown. Only selected biological processes and associated networks are shown in this figure panel, while Fig. S2 shows the complete set of functional groups identified from this analysis.
Figure 3
Figure 3
Completely novel transcripts (CNTs) with high conservation score (phastCons Score > 0.8), and expressed in atleast one developmental stage are shown across the panels. Expression profiles are normalized by the maximum expression level of a given transcript across stages and hierarchically clustered using Cluster 3.0 and visualized as a heatmap using Java Treeview. Samples from E15.5 that came from a different study than the rest of the samples were excluded from this expression analysis in order to avoid the batch effect. Heat maps showing the expression profiles of (a) 647 completely novel (novelty score ≥ 70%) transcripts hierarchically clustered with representative transcript groups expressed (b) in only one specific developmental stage and (c) in all the developmental stages. Novelty score (NS) and phastCons score (PS) indices for transcripts are also shown in as an additional scale bar in each heat map. (d) RT-PCR analysis validates expression of two CNTs with a predicted ORF (MSTRG.8249.1 and MSTRG.18685.1) and two CNTs with no known ORF (MSTRG.17446.1 and MSTRG.21639.1) in E15.5, P0 and P10 lenses. Note that MSTRG.17446.1 is undetected in this analysis at stage E15.5. Hprt represents a loading control. Negative control is included for all CNTs tested where the RT-PCR reaction was performed using the same primers as for the CNTs but without any cDNA. Full-length gels are included in Supplementary Information file.
Figure 4
Figure 4
Functional analysis and validation of the high confident exon skipping events discovered across lens developmental states. (a) Functional enrichment analysis of genes associated with high confidence (FDR 1%) skipped exon events identified using rMATS pipeline in atleast one pairwise comparison of developmental stages. For each biological process per group (color coded), the % genes per GO term with number of query genes (** in red) in the analysis is shown in histogram. This shows the functional grouping of the GO-terms based on GO hierarchy using the Cytoscape-ClueGO plugin. Significant clusters (p < 1e-2), color coded by group based on enriched GO-biological processes generated from ClueGO analysis with size of the nodes indicating level of significant association of genes per GO-term. (b) Experimental validation by RT-PCR analysis of a selected set of high confident skipped exonic events reveals that selected mRNA isoforms with skipped events are more abundant during embryonic and perinatal stages. The schematic of the expected products are shown next to the gene. For validation, primers (arrows) were designed on the exons (black box) flanking the alternatively spliced exon (grey box). For all the genes, band with higher molecular weight is the isoform including the alternatively spliced exon and band with lower molecular weight is the isoform with the skipped exon. Hprt represents a loading control. Negative control is included for all isoforms tested where the RT-PCR reaction was performed using the same primers as for the isoforms but without any cDNA. Full-length gels are included in Fig. S6.
Figure 5
Figure 5
Functional analysis of the genes associated with high confident retained intron events across lens developmental stages. (a) Overview of intron retention mechanism (b) Functional enrichment analysis of genes associated with significant (FDR 1%) intron retention events identified using rMATS in atleast one pair of developmental stages compared. For each biological process per group (color coded), the % genes per GO term with number of query genes (** in red) in the analysis was shown in histogram. This shows the functional grouping of the GO-terms based on GO hierarchy was represented as Clustered GO-network using the Cytoscape-ClueGO plugin. Significant clusters (p < 1e-2), color coded by group based on enriched GO-biological processes generated from ClueGO analysis with size of the nodes indicating level of significant association of genes per GO-term. (c) Bubble plot showing the alterations in the inclusion levels of a retained intron for Celf1 across various developmental stages. Each bubble shows the Percent Spliced Index (PSI) of the retained intron indicating an increase in the inclusion level from embryonic to post-natal stages.

References

    1. Tian L, et al. Transcriptome of the human retina, retinal pigmented epithelium and choroid. Genomics. 2015;105:253–264. doi: 10.1016/j.ygeno.2015.01.008. - DOI - PMC - PubMed
    1. Anand D, Lachke SA. Systems biology of lens development: A paradigm for disease gene discovery in the eye. Experimental eye research. 2016 - PMC - PubMed
    1. Zagozewski JL, Zhang Q, Eisenstat DD. Genetic regulation of vertebrate eye development. Clinical genetics. 2014;86:453–460. doi: 10.1111/cge.12493. - DOI - PubMed
    1. Lachke SA, Maas RL. Building the developmental oculome: systems biology in vertebrate eye development and disease. Wiley interdisciplinary reviews. Systems biology and medicine. 2010;2:305–323. - PMC - PubMed
    1. Sharma KK, Santhoshkumar P. Lens aging: effects of crystallins. Biochimica et biophysica acta. 2009;1790:1095–1108. doi: 10.1016/j.bbagen.2009.05.008. - DOI - PMC - PubMed

Publication types

LinkOut - more resources