. 2017 Sep 14;7(1):11629.
doi: 10.1038/s41598-017-11960-0.

Matrisome Profiling During Intervertebral Disc Development And Ageing

Affiliations

Matrisome Profiling During Intervertebral Disc Development And Ageing

Joana Caldeira et al. Sci Rep. .

Abstract

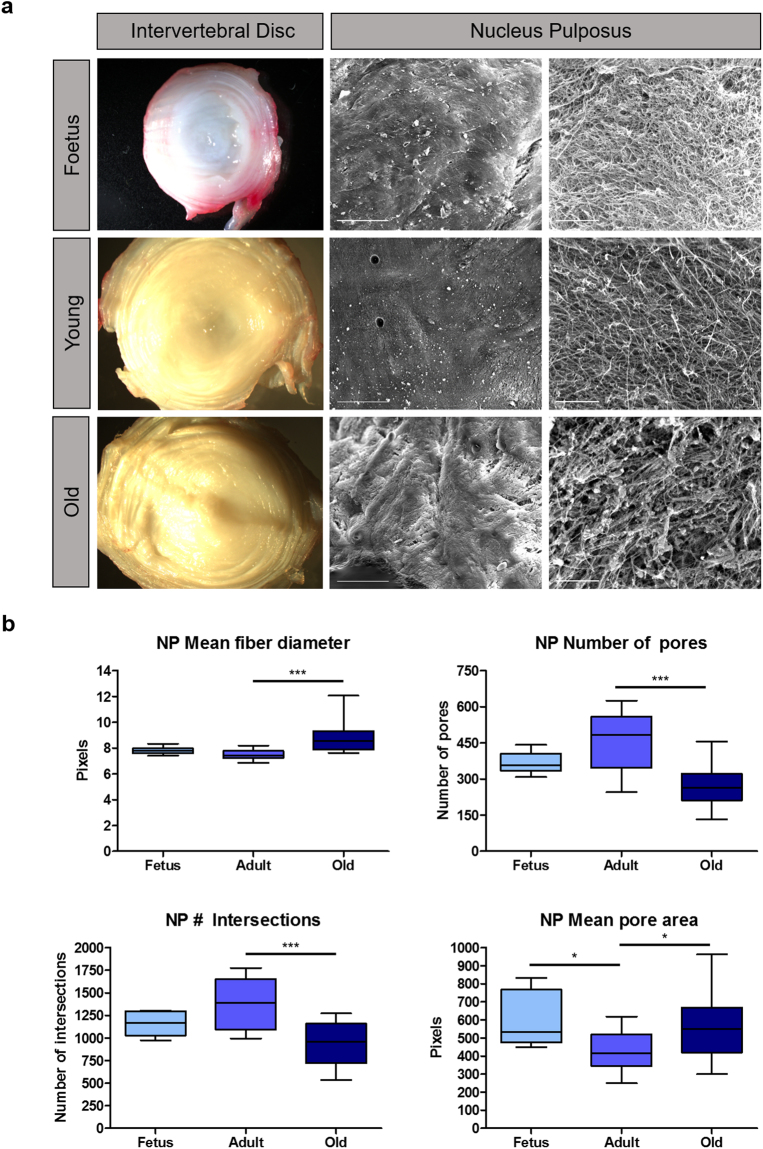
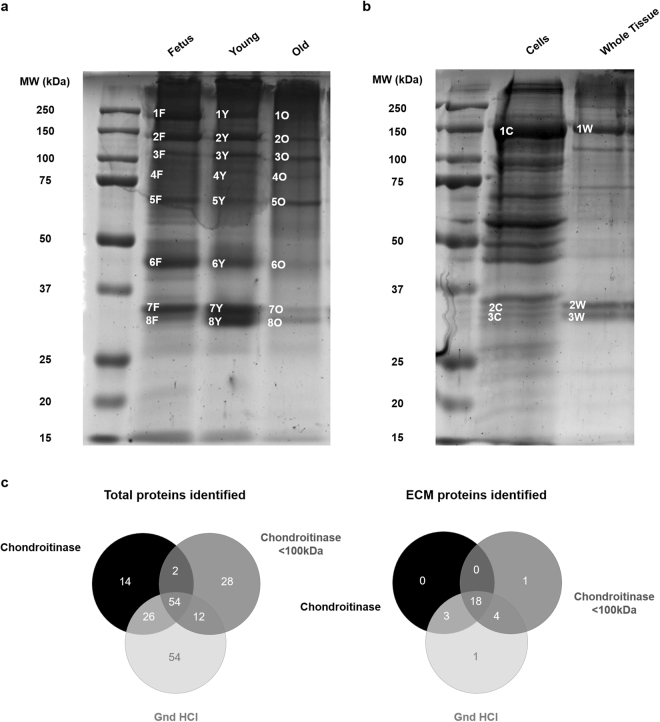
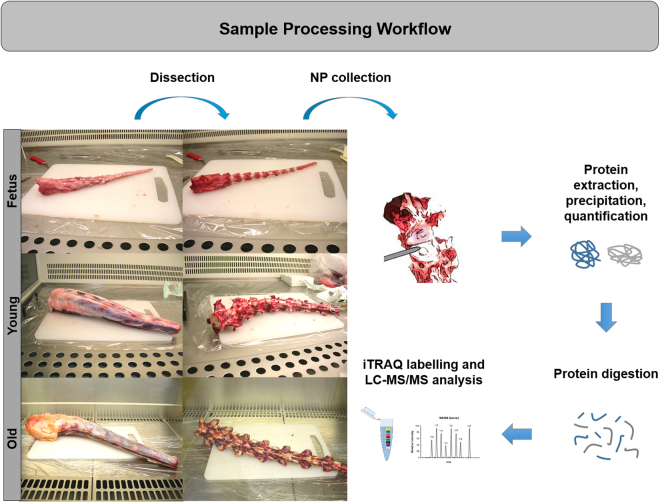
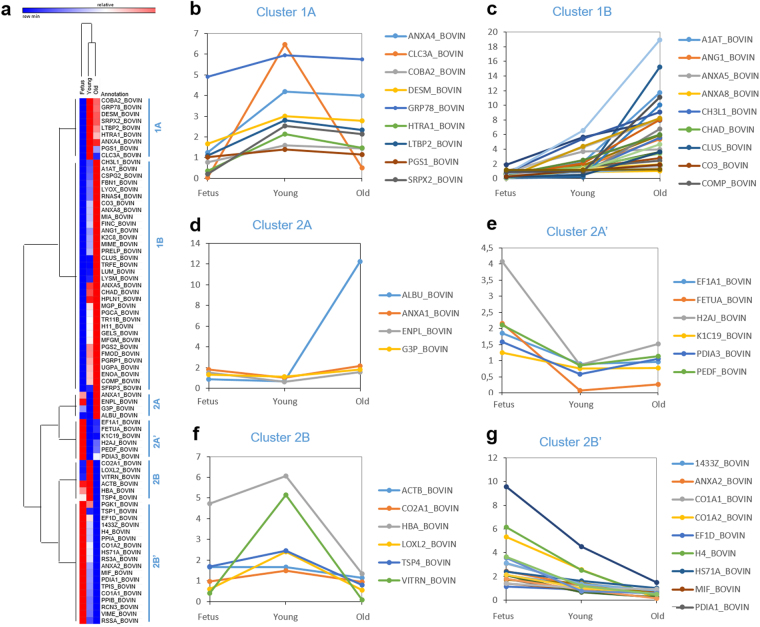
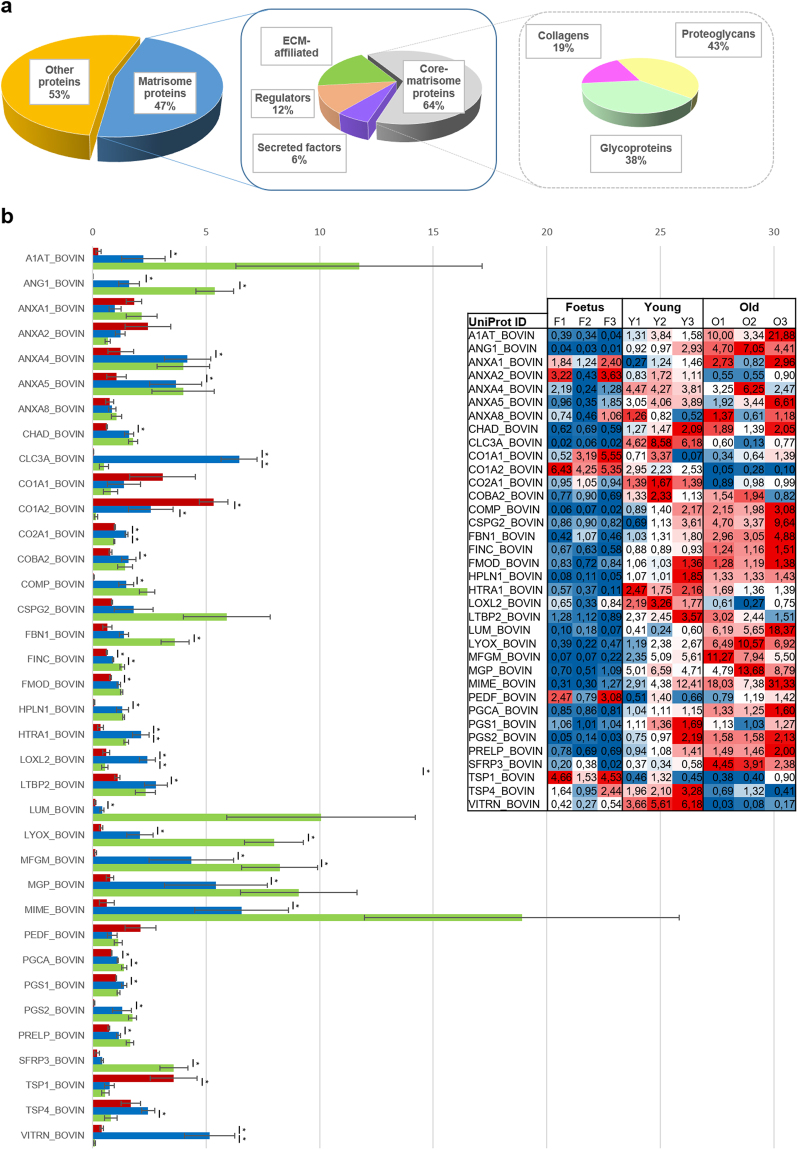
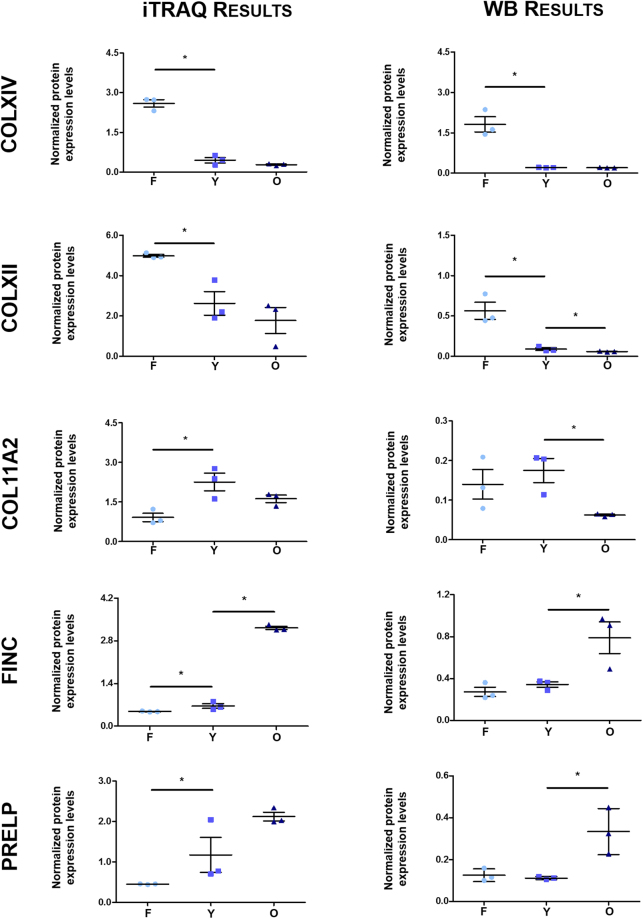
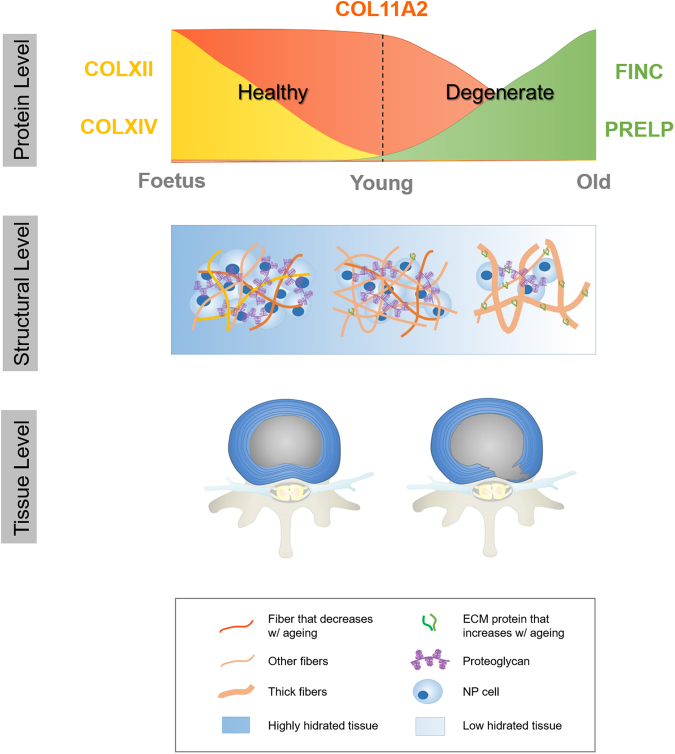
Intervertebral disc (IVD) degeneration is often the cause of low back pain. Degeneration occurs with age and is accompanied by extracellular matrix (ECM) depletion, culminating in nucleus pulpous (NP) extrusion and IVD destruction. The changes that occur in the disc with age have been under investigation. However, a thorough study of ECM profiling is needed, to better understand IVD development and age-associated degeneration. As so, iTRAQ LC-MS/MS analysis of foetus, young and old bovine NPs, was performed to define the NP matrisome. The enrichment of Collagen XII and XIV in foetus, Fibronectin and Prolargin in elder NPs and Collagen XI in young ones was independently validated. This study provides the first matrisome database of healthy discs during development and ageing, which is key to determine the pathways and processes that maintain disc homeostasis. The factors identified may help to explain age-associated IVD degeneration or constitute putative effectors for disc regeneration.


Conflict of interest statement

The authors declare that they have no competing interests.

Figures

Figure 1
Figure 1
Gross view and topographical characterization of different aged IVDs. (a) - Macroscopic pictures from IVD transversal sections (left panels) and microscopy images from scanning electron microscopy (SEM) (central and right panels, with scale bars representing 200 µm and 10 µm, respectively) of foetal, young and old IVDs are presented. On the right panels are magnifications of the NP, representing the organization of ECM fibres. NP parameters such as mean fibril diameter, mean pore area, number of pores and number of intersections were also plotted regarding each age group (b). Box-plot lines represent median and interquartile ranges of the different parameters evaluated. (*) stands for p ≤ 0.05 (**) for p ≤ 0.01 and (***) for p ≤ 0.001, using the non-parametric Mann-Whitney test.
Figure 2
Figure 2
Sample complexity, age-associated SDS-PAGE band profile and extraction buffer evaluation. (a) - By comparing the band profiles observed in one dimension (1D) SDS-PAGE gels, for the three distinct age groups, there were already clear differences in the intensity of some of the bands identified by MS + MS/MS. Information on band identification from 1 F to 8 O can be found in Supplementary Table 3. (b) - With the same extraction buffer, we observed more bands within the cellular rather than the tissue extract. However, identification by MS + MS/MS (Supplementary Table 4) showed that the bands corresponding to ECM proteins were mainly present in the tissue extract (1 C–COL6A1/COL6A2; 1 W–COL6A1/COL2A1; 2 C–ANXA1/ANXA2/GAPDH; 2 W–COL2A1/CHAD/OGN; 3 C–ANXA8/LDHA; 3 W–CHAD). (c) - We compared the number of proteins identified by LC-MS/MS when using distinct buffers recommended from the literature: guanidine hydrochloride buffer (Gnd HCl), the same buffer with a prior chondroitinase 6 h treatment (chondroitinase) and this last condition followed by a centrifugal filtration, using a molecular weight cut-off of 100 kDa (chondroitinase <100 kDa). The extraction buffer with which more proteins in total were identified, and more ECM proteins, in particular, was Gnd HCl.
Figure 3
Figure 3
Proteomic sample processing workflow. Bovine caudal IVDs from foetus, young and old animals were dissected within a few hours after slaughter. The NPs were collected and protein was further extracted, precipitated and quantified. After digestion, peptides were marked with isobaric tags for relative and absolute quantitation (iTRAQ) prior to liquid chromatography – tandem mass spectrometry (LC-MS/MS).
Figure 4
Figure 4
iTRAQ data analysis. (a) - Heatmap with the respective dendrogram representing sample-based hierarchical clusters. Average expression levels were represented by colour scale from blue (low) to red (high). In terms of protein expression, there were six main clusters. (b–g) - Graphical representation of iTRAQ relative protein expression profiles for the molecules within each of the 6 main clusters: cluster 1 A (b), cluster 1B (c), cluster 2A (d), cluster 2A’ (e), cluster 2B (f) and cluster 2B’ (g).
Figure 5
Figure 5
Characterization of the NP matrisome. (a) - The pie charts exhibit percentages of identified proteins distributed by matrisome categories. (b) - Comparison of the different aged NP matrisome signatures. iTRAQ relative protein expression levels (x axis) are displayed for each of the molecules identified (y axis). Foetal samples are in red, young in blue and old in green. iTRAQ protein quantification scores for individual samples can be found on the embedded table (colour scale from blue – low expression – to red – high expression). In the case of Young animals, the values represent an average of the technical replicates. The non-parametric Mann-Whitney test was used to compare two groups of non-related samples. Standard error of the mean (SEM) is represented as the error bar. (*) stands for p ≤ 0.05, using the non-parametric Mann-Whitney test.
Figure 6
Figure 6
Validation of the candidates’ protein expression levels. On the left are the graphics representing normalized protein expression levels from the iTRAQ LC-MS/MS analysis and on the right, of Western Blots (WBs), from Foetus, Young and Old animals. Collagen Type XII (COLXII) and XIV (COLXIV) expression levels are higher in NPs from foetus, Collagen Type 11 (COL11A2) is mostly expressed in Young animals, whereas Fibronectin (FINC) and Prolargin (PRELP) are typical from elder NPs. The non-parametric Mann-Whitney test was used to compare two groups of non-related samples (Foetus vs Young and Young vs Old). Graphs correspond to the average of protein expression levels obtained by band quantification and subsequent normalization to the total protein loading (Supplementary Figure 3). Standard error of the mean (SEM) is represented as the error bar. (*) stands for p ≤ 0.05, using the non-parametric Mann-Whitney test.
Figure 7
Figure 7
Working model for the changes that occur in the IVD microenvironment with development and ageing. From the foetal stages to adulthood, collagen type XII and XIV expression is lost and only collagen type XI is maintained. With increasing age, there is an enrichment in fibronectin and prolargin. Proteomic alterations are accompanied by matrix remodeling (fibrillogenesis and fibril organization are both affected), concomitant with water loss and a cell population decline. This ultimately causes age-associated degeneration, hernia formation and low back pain.

References

    1. Adams MA, Roughley PJ. What is intervertebral disc degeneration, and what causes it? Spine (Phila Pa 1976) 2006;31:2151–2161. doi: 10.1097/01.brs.0000231761.73859.2c. - DOI - PubMed
    1. Anderson DG, Tannoury C. Molecular pathogenic factors in symptomatic disc degeneration. Spine J. 2005;5:260S–266S. doi: 10.1016/j.spinee.2005.02.010. - DOI - PubMed
    1. Roughley PJ. Biology of intervertebral disc aging and degeneration: involvement of the extracellular matrix. Spine (Phila Pa 1976) 2004;29:2691–2699. doi: 10.1097/01.brs.0000146101.53784.b1. - DOI - PubMed
    1. Molinos M, et al. Inflammation in intervertebral disc degeneration and regeneration. J R Soc Interface. 2015;12:20141191. doi: 10.1098/rsif.2014.1191. - DOI - PMC - PubMed
    1. Le Maitre CL, Freemont AJ, Hoyland JA. Localization of degradative enzymes and their inhibitors in the degenerate human intervertebral disc. J Pathol. 2004;204:47–54. doi: 10.1002/path.1608. - DOI - PubMed

Publication types

MeSH terms