. 2017 Aug 30:8:1673.
doi: 10.3389/fmicb.2017.01673. eCollection 2017.

An Anthropocentric View of the Virosphere-Host Relationship

Affiliations

An Anthropocentric View of the Virosphere-Host Relationship

Rodrigo A L Rodrigues et al. Front Microbiol. .

Abstract

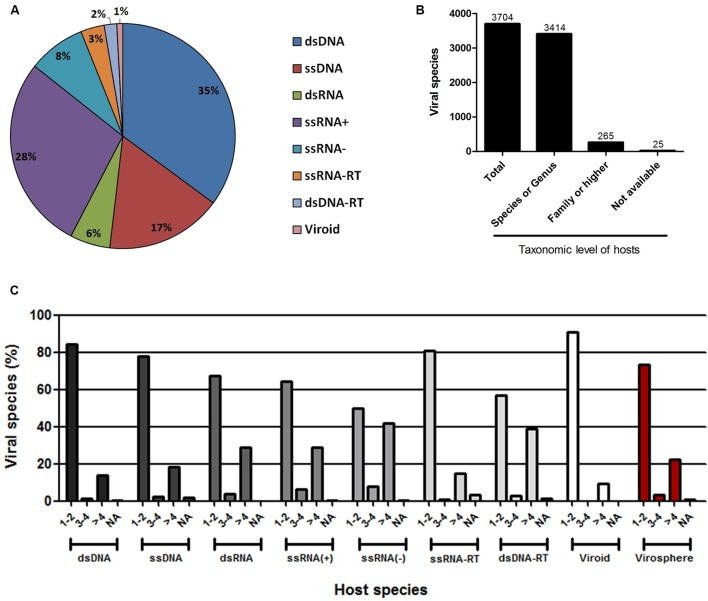
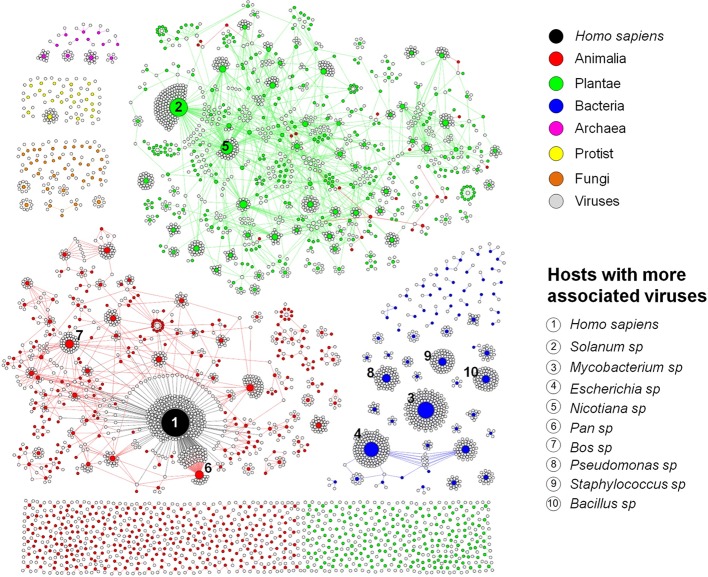
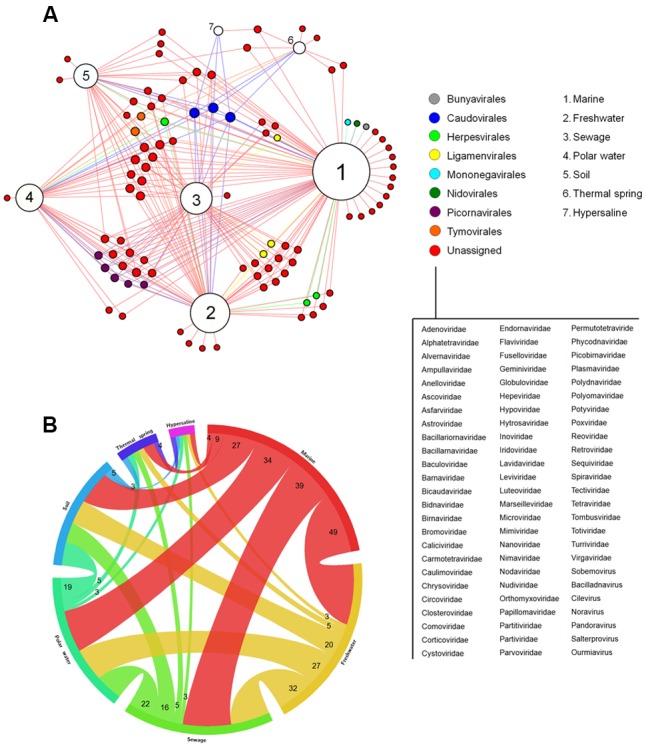
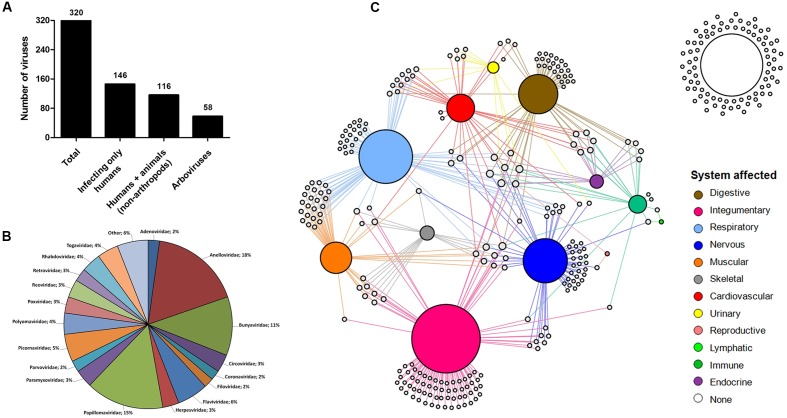
For over a century, viruses have been known as the most abundant and diverse group of organisms on Earth, forming a virosphere. Based on extensive meta-analyses, we present, for the first time, a wide and complete overview of virus-host network, covering all known viral species. Our data indicate that most of known viral species, regardless of their genomic category, have an intriguingly narrow host range, infecting only 1 or 2 host species. Our data also show that the known virosphere has expanded based on viruses of human interest, related to economical, medical or biotechnological activities. In addition, we provide an overview of the distribution of viruses on different environments on Earth, based on meta-analyses of available metaviromic data, showing the contrasting ubiquity of head-tailed phages against the specificity of some viral groups in certain environments. Finally, we uncovered all human viral species, exploring their diversity and the most affected organic systems. The virus-host network presented here shows an anthropocentric view of the virology. It is therefore clear that a huge effort and change in perspective is necessary to see more than the tip of the iceberg when it comes to virology.

Keywords: anthropocentric; metavirome; network; virosphere; virus–host relationship.


Figures

FIGURE 1
FIGURE 1
Host range of the known virosphere. (A) Pie chart showing the distribution of the viruses recognized by the International Committee on Taxonomy of Viruses (ICTV) according to Baltimore’s classification. (B) Taxonomic level of the hosts associated to the known viruses. More than 90% of the viruses were associated to hosts at species or genus taxonomic level, which were used in following analysis. (C) Amount of host species for viruses according to Baltimore’s classification, showing a very narrow host range of the viruses. NA, not available.
FIGURE 2
FIGURE 2
Virus–host interaction network. Bipartite network graph showing a spatially connected network among viruses and hosts, a reflection of our limited knowledge about the viruses and their hosts. Each node represents a virus (gray), or a host genus, classified according to the taxonomic group (colored nodes). The nodes’ diameter is proportional to the edge degree. The layout was generated using a force based algorithm followed by manual rearrangement to a better visualization of the connections. A total of 3414 viruses and 1083 hosts (genus level) are represented. The 10 hosts with more associated viruses are depicted.
FIGURE 3
FIGURE 3
Viral diversity on Earth. (A) Network graph showing the viral groups detected in different environments by metaviromic analysis. Each node represents an environment (white) or viral groups (families or known viral genus – colored nodes) classified according to the orders formally recognized by the ICTV. The viruses not currently assigned in any order are listed. The node diameter is proportional to the edge degree. The layout was generated using a force based algorithm followed by manual rearrangement for a better visualization of the connections. A total of 96 viral groups are represented. (B) Relationship between the different environments based on the amount of shared viral groups.
FIGURE 4
FIGURE 4
Human viruses and affected systems. (A) Human-affecting viruses divided among infecting only humans, infecting humans and other mammals, and arboviruses. (B) Pie chart showing the classification of the viruses. A total of 27 groups are represented in the chart. Others: Deltavirus, Hepadnaviridae, Hepeviridae, Caliciviridae, Picobirnaviridae, Pneumoviridae, Arenaviridae, Orthomyxoviridae, Astroviridae. (C) Network graph showing the viral tropism. Each node represents a virus (white) and an organic system of the human body (colored nodes). The node diameter is proportional to the edge degree. The layout was generated using a force based algorithm followed by manual rearrangement to a better visualization of the connections.

References

    1. Alavandi S. V., Poornima M. (2012). Viral metagenomics: a tool for virus discovery and diversity in aquaculture. Indian J. Virol. 23 88–98. 10.1007/s13337-012-0075-2 - DOI - PMC - PubMed
    1. Baltimore D. (1971). Expression of animal virus genomes. Bacteriol. Rev. 35 235–241. - PMC - PubMed
    1. Bastian M., Heymann S., Jacomy M. (2009). “Gephi: an open source software for exploring and manipulating networks,” in Third International AAAI Conference on Weblogs Social Media, Paris, 361–362. 10.1136/qshc.2004.010033 - DOI
    1. Boyer M., Yutin N., Pagnier I., Barrassi L., Fournous G., Espinosa L., et al. (2009). Giant Marseillevirus highlights the role of amoebae as a melting pot in emergence of chimeric microorganisms. Proc. Natl. Acad. Sci. U.S.A. 106 21848–21853. 10.1073/pnas.0911354106 - DOI - PMC - PubMed
    1. Cava F., Hidalgo A., Berenguer J. (2009). Thermus thermophilus as biological model. Extremophiles 13 213–231. 10.1007/s00792-009-0226-6 - DOI - PubMed

LinkOut - more resources