. 2017 Aug 30:8:1031.
doi: 10.3389/fimmu.2017.01031. eCollection 2017.

Shared and Distinct Phenotypes and Functions of Human CD161++ Vα7.2+ T Cell Subsets

Affiliations

Shared and Distinct Phenotypes and Functions of Human CD161++ Vα7.2+ T Cell Subsets

Ayako Kurioka et al. Front Immunol. .

Abstract

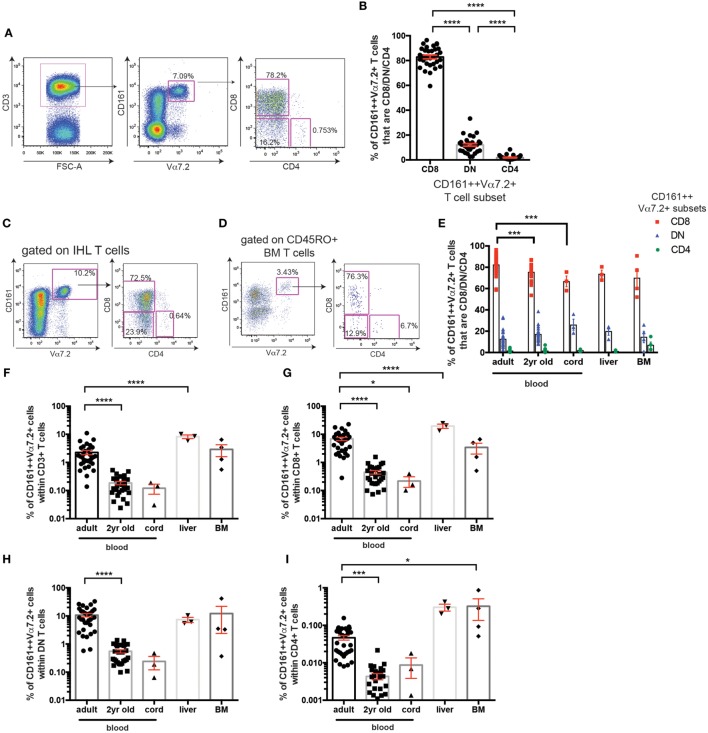
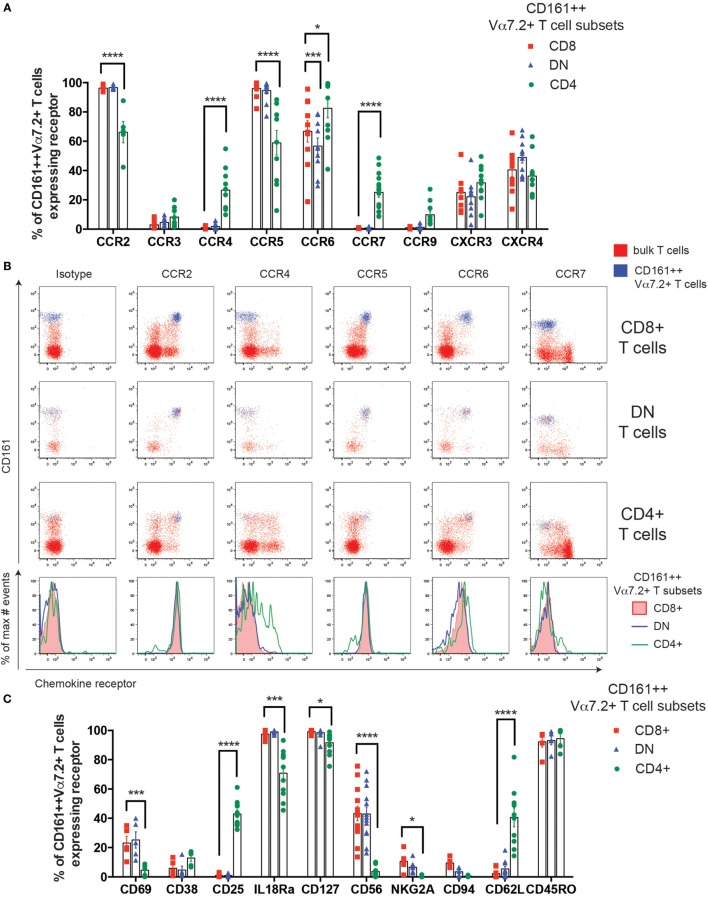
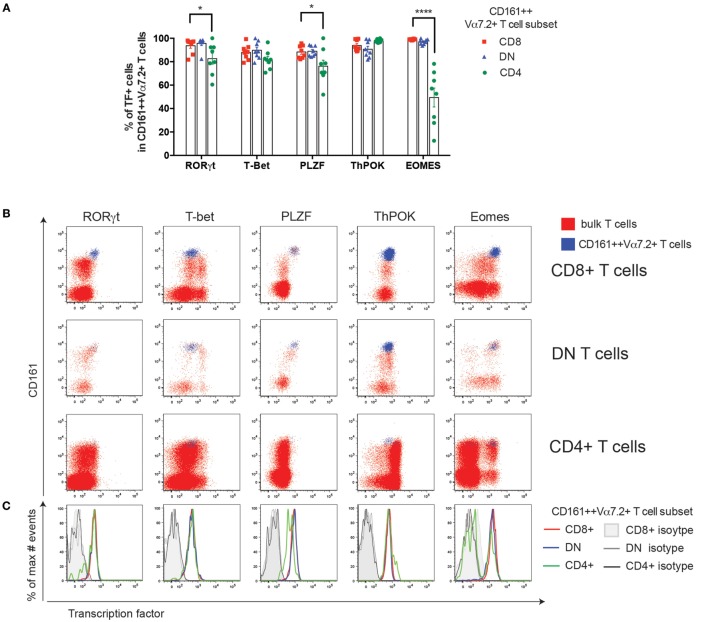
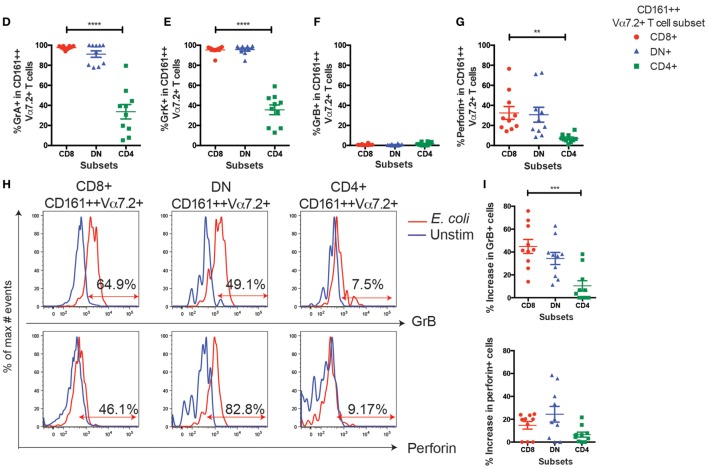
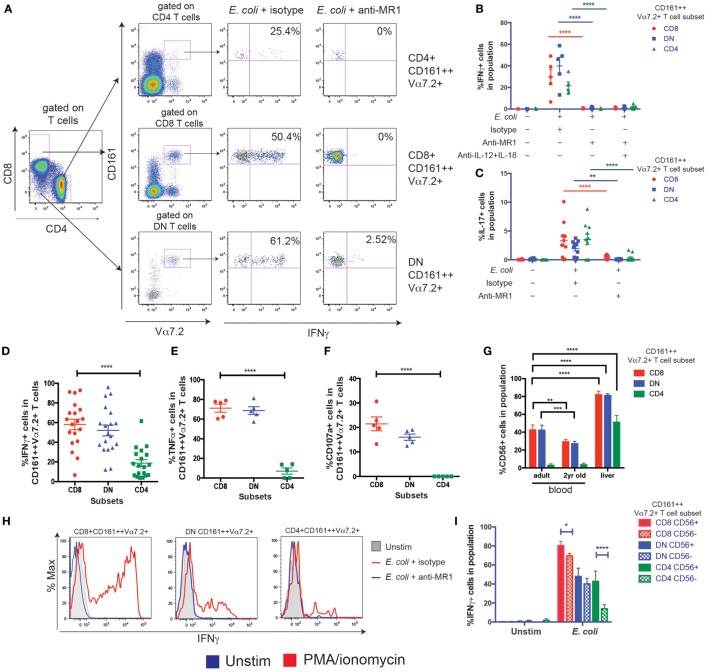
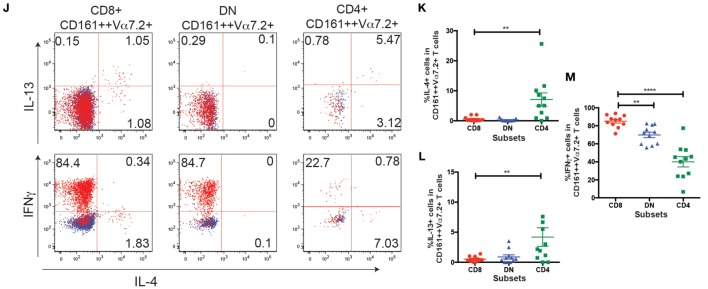
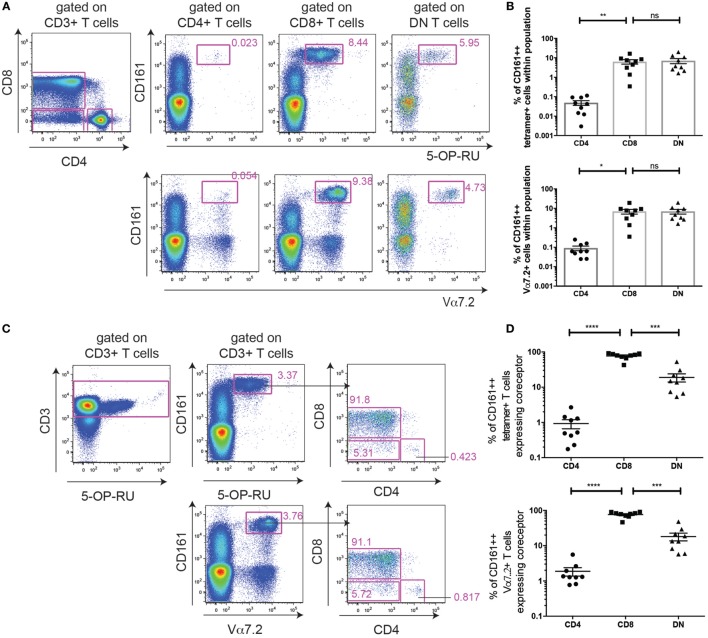
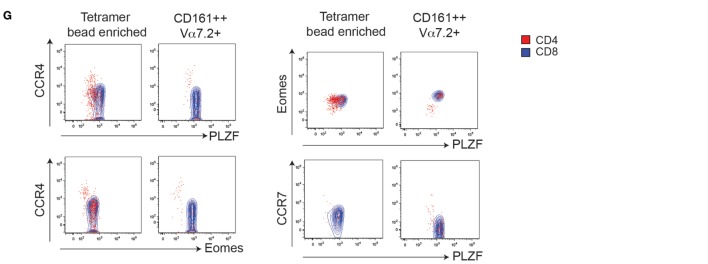
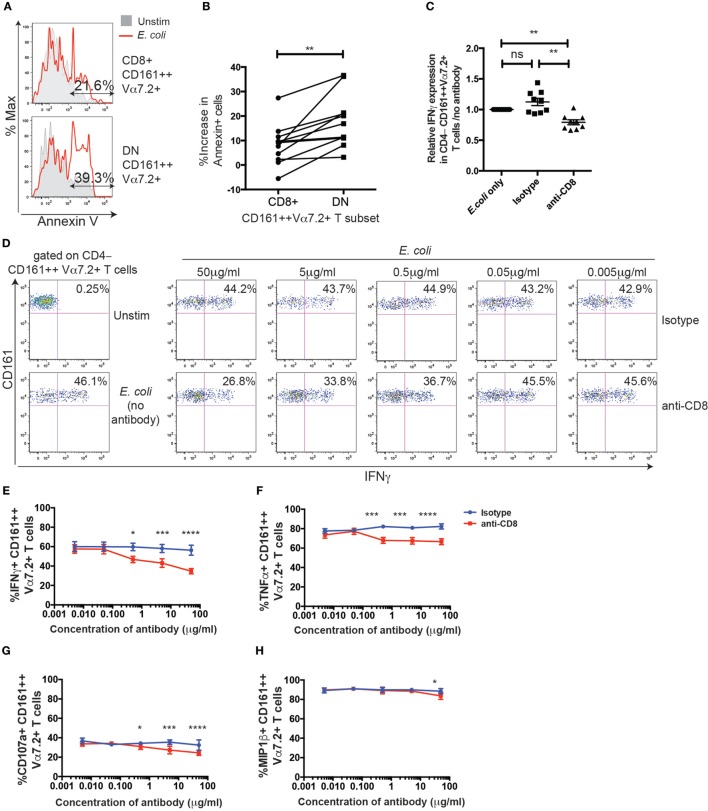
Human mucosal-associated invariant T (MAIT) cells are an important T cell subset that are enriched in tissues and possess potent effector functions. Typically such cells are marked by their expression of Vα7.2-Jα33/Jα20/Jα12 T cell receptors, and functionally they are major histocompatibility complex class I-related protein 1 (MR1)-restricted, responding to bacterially derived riboflavin synthesis intermediates. MAIT cells are contained within the CD161++ Vα7.2+ T cell population, the majority of which express the CD8 receptor (CD8+), while a smaller fraction expresses neither CD8 or CD4 coreceptor (double negative; DN) and a further minority are CD4+. Whether these cells have distinct homing patterns, phenotype and functions have not been examined in detail. We used a combination of phenotypic staining and functional assays to address the similarities and differences between these CD161++ Vα7.2+ T cell subsets. We find that most features are shared between CD8+ and DN CD161++ Vα7.2+ T cells, with a small but detectable role evident for CD8 binding in tuning functional responsiveness. By contrast, the CD4+ CD161++ Vα7.2+ T cell population, although showing MR1-dependent responsiveness to bacterial stimuli, display reduced T helper 1 effector functions, including cytolytic machinery, while retaining the capacity to secrete interleukin-4 (IL-4) and IL-13. This was consistent with underlying changes in transcription factor (TF) expression. Although we found that only a proportion of CD4+ CD161++ Vα7.2+ T cells stained for the MR1-tetramer, explaining some of the heterogeneity of CD4+ CD161++ Vα7.2+ T cells, these differences in TF expression were shared with CD4+ CD161++ MR1-tetramer+ cells. These data reveal the functional diversity of human CD161++ Vα7.2+ T cells and indicate potentially distinct roles for the different subsets in vivo.

Keywords: CD8 coreceptor; MHC class I-related protein 1; MHC class I-related protein 1-tetramer; innate-like T cells; mucosal-associated invariant T cells; subsets; transcription factors.


Figures

Figure 1
Figure 1
Frequency of CD161++ Vα7.2+ T cell subsets in human blood and tissue. (A) Gating strategy used to identify CD161++ Vα7.2+ T cells and their subsets in this study. (B) Frequencies of adult peripheral blood CD161++ Vα7.2+ T cells that are CD4+, CD8+ or CD4− CD8− (double negative; DN) (mean ± SEM) (n = 32; pooled from four independent experiments). ****P < 0.0001 by one-way ANOVA with Tukey’s multiple comparisons test. (C,D) Representative staining showing the expression of coreceptors on CD161++ Vα7.2+ T cells from (C) an intrahepatic lymphocyte sample (IHL) and (D) bone marrow (BM) sample. (E) Frequencies of CD8+ (red), DN (blue) or CD4+ (green) cells within total CD161++ Vα7.2+ T cells in the indicated tissues. N = 32 (adult blood), 28 (2-year-old blood), 3 (cord blood), 3 (liver), and 4 (BM). ***P < 0.001 by two-way ANOVA with Dunnett’s multiple comparisons test compared to adult peripheral blood. All other comparisons were non-significant. (F–I) The frequency of CD161++ Vα7.2+ T cells within (F) total T cells, (G) CD8+ T cells, (H) DN T cells, or (I) CD4+ T cells in the indicated tissues. N = 32 (adult blood), 28 (2-year-old blood), 3 (cord blood), 3 (liver), 4 (BM). Bars indicate mean ± SEM. Yr, year. ****P < 0.0001, ***P < 0.001, *P < 0.05 by two-way ANOVA with Dunnett’s multiple comparisons test compared to adult peripheral blood. All other comparisons were non-significant.
Figure 2
Figure 2
Cell surface phenotype heterogeneity of human CD161++ Vα7.2+ T cells. (A) Percentage of CD8+, double negative (DN), and CD4+ CD161++ Vα7.2+ T cells expressing the indicated chemokine receptors. Bars indicate mean ± SEM. ****P < 0.0001, ***P < 0.001, *P < 0.05 by two-way repeated measures ANOVA with Dunnett’s multiple comparisons test, compared to CD8+ CD161++ Vα7.2+ T cells. All other comparisons were not significant (n = 5–15; data pooled from independent experiments with biological replicates of 5). (B) Representative flow cytometry plots gated on total CD8+ (top row), DN (second row), CD4+ (third row) T cells showing expression of indicated chemokine receptors. Blue = CD161++ Vα7.2+ T cells; red = bulk T cells. Bottom row shows histograms for cells gated on CD8+, DN, or CD4+ CD161++ Vα7.2+ T cells. (C) Percentage of CD8+, DN, or CD4+ CD161++ Vα7.2+ T cells expressing the indicated surface receptors. Bars indicate mean ± SEM. ****P < 0.0001, ***P < 0.001, *P < 0.01 by two-way repeated measures ANOVA with Dunnett’s multiple comparisons test, compared to CD8+ CD161++ Vα7.2+ T cells. All other comparisons were not significant (n = 5–13).
Figure 3
Figure 3
CD4+ CD161++ Vα7.2+ T cells have reduced Eomes expression and low cytotoxic potential. (A) The frequency of CD8+, double-negative (DN), and CD4+ CD161++ Vα7.2+ T cells expressing the indicated transcription factors (TFs). Bars indicate mean ± SEM, ****P < 0.0001, ***P < 0.001 by two-way repeated measures ANOVA with Dunnett’s multiple comparisons test, compared to CD8+ CD161++ Vα7.2+ cells. All other comparisons were not significant (n = 8; data pooled from two independent experiments). (B) Representative flow cytometry plots gated on total CD8+ (top row), DN (second row), CD4+ (third row) T cells showing expression of indicated TFs. Blue = CD161++ Vα7.2+ T cells; red = bulk T cells. (C) Overlaid histograms of cells gated on CD8+, CD4+, or DN CD161++ Vα7.2+ T cells showing the expression of the indicated TF, overlaid with their respective isotype control stains in gray as per legend. In all graphs, CD8+ cells are shown in red, DN cells in blue, and CD4+ cells in green. (D–G) Frequency of CD8+, DN, CD4+ CD161++ Vα7.2+ T cells expressing: (D) granzyme (Gr) A, (E) GrK, (F) granzyme B (GrB), or (G) perforin, showing mean ± SEM. ****P < 0.0001, **P < 0.01 by repeated measures one-way ANOVA with Bonferroni’s multiple comparisons test, compared to CD8+ CD161++ Vα7.2+ T cells (n = 10; data pooled from two independent experiments). (H,I) Upregulation of GrB and perforin in CD161++ Vα7.2+ T cell subsets following stimulation with Escherichia coli-treated THP1 cells for 24 h. (H) Representative staining showing GrB and perforin upregulation in CD161++ Vα7.2+ T cells. Percentages indicate frequency of cells expressing indicated effector molecule, based on isotype control. (I) The fraction of cells expressing GrB or perforin at resting conditions was subtracted to show increases in GrB or perforin expression after E. coli stimulation. ***P < 0.001 by repeated measures one-way ANOVA with Bonferroni’s multiple comparisons test, compared to CD8+ CD161++ Vα7.2+ T cells (n = 10; data pooled from two independent experiments). All other comparisons were non-significant.
Figure 3
Figure 3
CD4+ CD161++ Vα7.2+ T cells have reduced Eomes expression and low cytotoxic potential. (A) The frequency of CD8+, double-negative (DN), and CD4+ CD161++ Vα7.2+ T cells expressing the indicated transcription factors (TFs). Bars indicate mean ± SEM, ****P < 0.0001, ***P < 0.001 by two-way repeated measures ANOVA with Dunnett’s multiple comparisons test, compared to CD8+ CD161++ Vα7.2+ cells. All other comparisons were not significant (n = 8; data pooled from two independent experiments). (B) Representative flow cytometry plots gated on total CD8+ (top row), DN (second row), CD4+ (third row) T cells showing expression of indicated TFs. Blue = CD161++ Vα7.2+ T cells; red = bulk T cells. (C) Overlaid histograms of cells gated on CD8+, CD4+, or DN CD161++ Vα7.2+ T cells showing the expression of the indicated TF, overlaid with their respective isotype control stains in gray as per legend. In all graphs, CD8+ cells are shown in red, DN cells in blue, and CD4+ cells in green. (D–G) Frequency of CD8+, DN, CD4+ CD161++ Vα7.2+ T cells expressing: (D) granzyme (Gr) A, (E) GrK, (F) granzyme B (GrB), or (G) perforin, showing mean ± SEM. ****P < 0.0001, **P < 0.01 by repeated measures one-way ANOVA with Bonferroni’s multiple comparisons test, compared to CD8+ CD161++ Vα7.2+ T cells (n = 10; data pooled from two independent experiments). (H,I) Upregulation of GrB and perforin in CD161++ Vα7.2+ T cell subsets following stimulation with Escherichia coli-treated THP1 cells for 24 h. (H) Representative staining showing GrB and perforin upregulation in CD161++ Vα7.2+ T cells. Percentages indicate frequency of cells expressing indicated effector molecule, based on isotype control. (I) The fraction of cells expressing GrB or perforin at resting conditions was subtracted to show increases in GrB or perforin expression after E. coli stimulation. ***P < 0.001 by repeated measures one-way ANOVA with Bonferroni’s multiple comparisons test, compared to CD8+ CD161++ Vα7.2+ T cells (n = 10; data pooled from two independent experiments). All other comparisons were non-significant.
Figure 4
Figure 4
CD8+ and double-negative (DN) CD161++ Vα7.2+ T cells have a higher capacity to secrete T helper 1 cytokines. (A–F) THP1 cells were cultured with Escherichia coli overnight before co-culturing with peripheral blood mononuclear cells (PBMCs) for 5 h. (A) PBMCs were cultured for 5 h with E. coli-treated THP1 cells in the presence or absence of anti-MHC class I-related protein 1 (MR1) blocking antibody. Representative staining is shown. (B) Frequency of CD161++ Vα7.2+ T cells expressing IFNγ (B) or interleukin-17 (IL-17) (C) in response to E. coli-treated THP1s in the presence or absence of indicated blocking antibodies against MR1, IL-12, IL-18, or isotype controls for 5 h. Bars indicate mean ± SEM (n = 5 for IFNγ, n = 10 for IL-17). ****P < 0.0001, **P < 0.01 by two-way ANOVA with Dunnett’s multiple comparisons test, compared to E. coli + isotype for each subset. Comparison with no E. coli not shown. (D–F) Frequency of CD8+, DN, or CD4+ CD161++ Vα7.2+ T cells expressing (D) IFNγ (E) TNFα (F) CD107a in response to E. coli-treated THP1s. ****P < 0.0001 by repeated measures one-way ANOVA with Dunnett’s multiple comparisons test, compared to CD8+ CD161++ Vα7.2+ T cells. All other comparisons were non-significant (n = 19 for IFNγ, from three independent experiments; n = 5 for all others). (G) Frequencies of CD56-expressing CD161++ Vα7.2+ T cells within blood and liver, according to coreceptor expression. ****P < 0.0001, ***P < 0.001, **P < 0.01 by two-way ANOVA with Dunnett’s multiple comparisons test, compared to adult blood within each subset. Other comparisons were non-significant. (H,I) Intrahepatic lymphocyte cells were cultured with E. coli-treated THP1 cells for 5 h. Representative staining (H) of IFNγ-expressing intrahepatic CD161++ Vα7.2+ T cells, in the presence or absence of an anti-MR1 blocking antibody added at 10 μg/ml: (blue line) or isotype control (red line). (I) Expression of IFNγ from indicated intrahepatic CD161++ Vα7.2+ T cell subsets according to CD56 expression. ****P < 0.0001, *P < 0.05 by two-way repeated measures ANOVA with Tukey’s multiple comparisons test, comparing CD56+ and CD56− cells within each CD161++ Vα7.2+ T cell subset (n = 3). (J–M) PBMCs were cultured in Th2-skewing conditions [interleukin-4 (IL-4) + IL-2, see Materials and Methods] and restimulated with phorbol 12-myristate 13-acetate (PMA)/ionomycin for 5 h. (J) Representative plots showing IL-4, IL-13, and IFNγ production in response to PMA/ionomycin from CD161++ Vα7.2+ T cells. (K–M) Percentage of CD161++ Vα7.2+ T cells expressing (K) IL-4 (L) IL-13 (M) IFNγ. ****P < 0.0001, **P < 0.01 by repeated measures one-way ANOVA with Dunnett’s multiple comparisons test, compared to CD8+ CD161++ Vα7.2+ T cells (n = 11; data pooled from two independent experiments). All other comparisons were not significant.
Figure 4
Figure 4
CD8+ and double-negative (DN) CD161++ Vα7.2+ T cells have a higher capacity to secrete T helper 1 cytokines. (A–F) THP1 cells were cultured with Escherichia coli overnight before co-culturing with peripheral blood mononuclear cells (PBMCs) for 5 h. (A) PBMCs were cultured for 5 h with E. coli-treated THP1 cells in the presence or absence of anti-MHC class I-related protein 1 (MR1) blocking antibody. Representative staining is shown. (B) Frequency of CD161++ Vα7.2+ T cells expressing IFNγ (B) or interleukin-17 (IL-17) (C) in response to E. coli-treated THP1s in the presence or absence of indicated blocking antibodies against MR1, IL-12, IL-18, or isotype controls for 5 h. Bars indicate mean ± SEM (n = 5 for IFNγ, n = 10 for IL-17). ****P < 0.0001, **P < 0.01 by two-way ANOVA with Dunnett’s multiple comparisons test, compared to E. coli + isotype for each subset. Comparison with no E. coli not shown. (D–F) Frequency of CD8+, DN, or CD4+ CD161++ Vα7.2+ T cells expressing (D) IFNγ (E) TNFα (F) CD107a in response to E. coli-treated THP1s. ****P < 0.0001 by repeated measures one-way ANOVA with Dunnett’s multiple comparisons test, compared to CD8+ CD161++ Vα7.2+ T cells. All other comparisons were non-significant (n = 19 for IFNγ, from three independent experiments; n = 5 for all others). (G) Frequencies of CD56-expressing CD161++ Vα7.2+ T cells within blood and liver, according to coreceptor expression. ****P < 0.0001, ***P < 0.001, **P < 0.01 by two-way ANOVA with Dunnett’s multiple comparisons test, compared to adult blood within each subset. Other comparisons were non-significant. (H,I) Intrahepatic lymphocyte cells were cultured with E. coli-treated THP1 cells for 5 h. Representative staining (H) of IFNγ-expressing intrahepatic CD161++ Vα7.2+ T cells, in the presence or absence of an anti-MR1 blocking antibody added at 10 μg/ml: (blue line) or isotype control (red line). (I) Expression of IFNγ from indicated intrahepatic CD161++ Vα7.2+ T cell subsets according to CD56 expression. ****P < 0.0001, *P < 0.05 by two-way repeated measures ANOVA with Tukey’s multiple comparisons test, comparing CD56+ and CD56− cells within each CD161++ Vα7.2+ T cell subset (n = 3). (J–M) PBMCs were cultured in Th2-skewing conditions [interleukin-4 (IL-4) + IL-2, see Materials and Methods] and restimulated with phorbol 12-myristate 13-acetate (PMA)/ionomycin for 5 h. (J) Representative plots showing IL-4, IL-13, and IFNγ production in response to PMA/ionomycin from CD161++ Vα7.2+ T cells. (K–M) Percentage of CD161++ Vα7.2+ T cells expressing (K) IL-4 (L) IL-13 (M) IFNγ. ****P < 0.0001, **P < 0.01 by repeated measures one-way ANOVA with Dunnett’s multiple comparisons test, compared to CD8+ CD161++ Vα7.2+ T cells (n = 11; data pooled from two independent experiments). All other comparisons were not significant.
Figure 5
Figure 5
MHC class I-related protein 1 (MR1)-tetramer staining identifies mucosal-associated invariant T cells within the CD161++ Vα7.2+ T cell population. (A) Representative plots showing cells staining for 5-OP-RU MR1-tetramer (top) or Vα7.2 antibody (bottom) within CD4+, CD8+, and double-negative (DN) T cells. Cells are from the same donor, stained in parallel. Frequency of cells within CD4+, CD8+, or DN T cells shown in (B). **P < 0.01 or *P < 0.05, or non-significant = ns by repeated measures one-way ANOVA with Dunnett’s multiple comparisons test, compared to CD8+ T cells (n = 9). (C) Same cells as (A), showing coreceptor expression on CD161++ T cells stained with 5-OP-RU MR1-tetramer (top) or Vα7.2 antibody (bottom). (D) Coreceptor expression on CD161++ MR1-tetramer+ cells (top) and CD161++ Vα7.2+ T cells (bottom). ****P < 0.0001, ***P < 0.001 by repeated measures one-way ANOVA with Dunnett’s multiple comparisons test, compared to CD8+ T cells (n = 9).
Figure 6
Figure 6
MHC class I-related protein 1 (MR1)-tetramer bead enrichment shows that CD161++ CD4+ mucosal-associated invariant T (MAIT) cells have lower Eomes and promyelocytic leukemia zinc finger (PLZF) expression. (A) Representative plots showing the enrichment of MAIT cells by magnetic bead enrichment using the MR1-tetramer. (B) Expression of PLZF, Eomes, and CCR4 on CD161++ MR1-tetramer+ cells according to coreceptor expression, before or after tetramer enrichment (n = 9). **P < 0.01, *P < 0.05 by repeated measures one-way ANOVA with Dunnett’s multiple comparisons test. Fluorescence-activated cell sorted plots show the expression of the indicated marker on cells gated on either CD161++ MR1-tetramer+ cells before or after tetramer enrichment from the same donor and gated on CD4+ (red) or CD8+ (blue) cells. Plots gated on CD161++ Vα7.2+ T cells shown for comparison. (C–F) Comparison of the frequency of cells expressing Eomes (C), PLZF (D), CCR4 (E), and CCR7 (F) within CD161++ Vα7.2+ T cells (black) and CD161++ MR1-tetramer+ cells within MR1-tetramer enriched cells (gray). ****P < 0.0001, **P < 0.01, *P < 0.05, and ns = non-significant by two-way ANOVA with Dunnett’s multiple comparisons test comparing each subset to CD8 cells, or by two-way ANOVA with Sidak’s multiple comparisons test comparing Vα7.2+ cells with MR1-tetramer+ cells. (G) Coexpression of PLZF, Eomes, and CCR4 on cells gated on either CD161++ MR1-tetramer+ cells or CD161++ Vα7.2+ T cells, and then gated on CD4+ (red) or CD8+ (blue) cells.
Figure 6
Figure 6
MHC class I-related protein 1 (MR1)-tetramer bead enrichment shows that CD161++ CD4+ mucosal-associated invariant T (MAIT) cells have lower Eomes and promyelocytic leukemia zinc finger (PLZF) expression. (A) Representative plots showing the enrichment of MAIT cells by magnetic bead enrichment using the MR1-tetramer. (B) Expression of PLZF, Eomes, and CCR4 on CD161++ MR1-tetramer+ cells according to coreceptor expression, before or after tetramer enrichment (n = 9). **P < 0.01, *P < 0.05 by repeated measures one-way ANOVA with Dunnett’s multiple comparisons test. Fluorescence-activated cell sorted plots show the expression of the indicated marker on cells gated on either CD161++ MR1-tetramer+ cells before or after tetramer enrichment from the same donor and gated on CD4+ (red) or CD8+ (blue) cells. Plots gated on CD161++ Vα7.2+ T cells shown for comparison. (C–F) Comparison of the frequency of cells expressing Eomes (C), PLZF (D), CCR4 (E), and CCR7 (F) within CD161++ Vα7.2+ T cells (black) and CD161++ MR1-tetramer+ cells within MR1-tetramer enriched cells (gray). ****P < 0.0001, **P < 0.01, *P < 0.05, and ns = non-significant by two-way ANOVA with Dunnett’s multiple comparisons test comparing each subset to CD8 cells, or by two-way ANOVA with Sidak’s multiple comparisons test comparing Vα7.2+ cells with MR1-tetramer+ cells. (G) Coexpression of PLZF, Eomes, and CCR4 on cells gated on either CD161++ MR1-tetramer+ cells or CD161++ Vα7.2+ T cells, and then gated on CD4+ (red) or CD8+ (blue) cells.
Figure 7
Figure 7
CD8 coreceptor blockade reduces CD8+ CD161++ Vα7.2+ T cell activation by Escherichia coli-treated THP1 cells. (A) Representative flow cytometry plot of Annexin V staining of CD8+ (top) or double-negative (DN) (bottom) CD161++ Vα7.2+ T cells following incubation with E. coli-treated THP1 cells for 5 h. Total % of Annexin V+ cells after E. coli stimulation in indicated populations are shown. (B) Percentage increase in the frequency of Annexin V+ CD161++ Vα7.2+ T cells compared to unstimulated cells. **P < 0.01 by paired t-test (n = 11; data from two independent experiments). (C) Data from two independent experiments showing the frequency of CD4−CD161++ Vα7.2+ T cells expressing IFNγ in response to E. coli-treated THP1s in the presence or absence of blocking antibodies against CD8 (5 µg/ml), or isotype control for 5 h (n = 9). Data are presented as relative IFNγ expression compared with that of co-cultures in the absence of any antibodies. **P < 0.01 by one-way ANOVA with Dunnett’s multiple comparisons test, compared to CD161++ Vα7.2+ T cells cultured in the absence of any antibodies. (D) Representative plots of IFNγ expression in CD4− CD161++ Vα7.2+ T cells cultured in the presence of increasing concentrations of blocking antibody against CD8, or isotype control, or in the absence of antibodies (far left column). (E–H) Frequency of CD4− CD161++ Vα7.2+ T cells expressing (E) IFNγ, (F) TNFα, (G) CD107a, or (H) macrophage inflammatory protein-1β (MIP-1β) in the presence (red) or absence (blue) of a blocking antibody against CD8. Each symbol and bar represents the mean ± SEM (n = 5). ****P < 0.0001, ***P < 0.001, *P < 0.05 by two-way repeated measures ANOVA with Dunnett’s multiple comparisons test, compared to CD161++ Vα7.2+ T cells cultured at the corresponding concentration of isotype control antibody. All other comparisons were non-significant.

References

    1. Gherardin NA, Keller AN, Woolley RE, Le Nours J, Ritchie DS, Neeson PJ, et al. Diversity of T cells restricted by the MHC class I-related molecule MR1 facilitates differential antigen recognition. Immunity (2016) 44:32–45.10.1016/j.immuni.2015.12.005 - DOI - PubMed
    1. Lepore M, Kalinichenko A, Kalinicenko A, Colone A, Paleja B, Singhal A, et al. Parallel T-cell cloning and deep sequencing of human MAIT cells reveal stable oligoclonal TCRβ repertoire. Nat Commun (2014) 5:3866.10.1038/ncomms4866 - DOI - PubMed
    1. Porcelli S, Yockey CE, Brenner MB, Balk SP. Analysis of T cell antigen receptor (TCR) expression by human peripheral blood CD4-8-alpha/beta T cells demonstrates preferential use of several V beta genes and an invariant TCR alpha chain. J Exp Med (1993) 178:1–16.10.1084/jem.178.1.1 - DOI - PMC - PubMed
    1. Reantragoon R, Corbett AJ, Sakala IG, Gherardin NA, Furness JB, Chen Z, et al. Antigen-loaded MR1 tetramers define T cell receptor heterogeneity in mucosal-associated invariant T cells. J Exp Med (2013) 210:2305–20.10.1084/jem.20130958 - DOI - PMC - PubMed
    1. Corbett AJ, Eckle SBG, Birkinshaw RW, Liu L, Patel O, Mahony J, et al. T-cell activation by transitory neo-antigens derived from distinct microbial pathways. Nature (2014) 509:361–5.10.1038/nature13160 - DOI - PubMed