. 2017:2017:6532837.
doi: 10.1155/2017/6532837. Epub 2017 Aug 17.

Haplotypes for Type, Degree, and Rate of Marbling in Cattle Are Syntenic with Human Muscular Dystrophy

Affiliations

Haplotypes for Type, Degree, and Rate of Marbling in Cattle Are Syntenic with Human Muscular Dystrophy

Sally S Lloyd et al. Int J Genomics. 2017.

Abstract

Traditional analyses of a QTL on Bota 19 implicate a surfeit of candidates, but each is of marginal significance in explaining the deposition of healthy, low melting temperature fat within marbled muscle of Wagyu cattle. As an alternative approach, we have used genomic, multigenerational segregation to identify 14 conserved, ancestral 20 Mb haplotypes. These determine the degree and rate of marbling in Wagyu and other breeds of cattle. The melting temperature of intramuscular fat is highly heritable and traceable by haplotyping. Fortunately, for the production of healthy beef, some of these haplotypes are sufficiently penetrant to be expressed in heterozygous crossbreds, thereby allowing selection of sires which will improve the healthiness of beef produced under even harsh climatic conditions. The region of Bota 19 is syntenic to a region of Hosa 17 known to be important in muscle metabolism and in determining susceptibility to a form of human muscular dystrophy.


Figures

Figure 1
Figure 1
Marbling and muscular dystrophy are syntenic on Bota 19 and chromosome 17. Coloured boxes represent segments with the same gene content. Crossed joining lines indicate inverted translocations. Numbers represent Mb. Synteny was determined by the positions of homologous genes in the human assembly Hg 38 and bovine assembly BosTau8 located using the UCSC Genome Browser. Inverted sections and the exact location of boundaries between blocks were determined by dotplots [63] comparing the two sequences. The annotated dotplots used are shown in Supplementary Figure 1 available online at https://doi.org/10.1155/2017/6532837. The positions of genes associated with muscular dystrophy are shown in the first row of letters above Hosa 17. The association to muscular dystrophy is shown in the table below [–70]. The positions of genes involved in the regulation of muscle development by SREBF1, either directly or through BHLHE40 and BHLHE41 (previously known as BHLHB2 and BHLHB3, resp.), are shown in the second row of letters above Hosa 17. Adapted from [3] with permission. We thank Dr. Joe Williamson for the assistance with this figure.
Figure 2
Figure 2
Haplotypes of the marbling region. Polymorphic markers define conserved extended C19 ancestral haplotypes: This region on BTAchr19 is bounded by markers SREBF1 and FASN (see [56] for details). The FASN marker is more correctly known as SCT-FSN since the present marker is adjacent to the coding region for FASN, within the segmental duplication containing SECTM1. The map positions of PCR markers and the number and type of alleles at each locus are indicated including the main high frequency and largely breed-specific haplotypes extending from SREBF1 to TCAP. We have extended the haplotyping through the region and plan to develop more markers based on the potential polymorphism revealed by the structural duplications extending from 43 Mb to 52 Mb (figure and below). Note the regions where PCR product polymorphism was not detected [56]. In structural duplications in C19 35-55 Mb region, we used the current cow genome assembly (Bos_tauros_UMD_3.1.1/bostau8 Assembly) on the UCSC Web Browser and searched the chr19 region from 35 Mb to 55 Mb in 500 kb sectors for large structural segmental duplications using standard dot-plotting methods aligning each 500 kb sector against itself (Gepard 1.30) [63]. We found clusters of rolling, sometimes clustered and inverted, segmental duplications in the reference genome on chr19 at 43.51 Mb (~60 kb in length), 43.86 Mb (~90 kb), 48.86 (~57 kb), and 50.846 Mb (~300 kb). We also found a long single imperfect duplication of 103–112 kb at 52.73 Mb and 52.88 Mb. Some of these dot plots are shown as cutaways in the figure. This region has a relatively low density of protein coding genes.
Figure 3
Figure 3
Segregation of 20 Mb haplotype through three generations of Wagyu pedigree. Haplotype (a) is an inherited intact from the maternal grandsire. The calf, dam, and maternal grandsire are all heterozygous at the SREBF1 or NT5M and GH or FASN markers, which allows the segregation of haplotype (a) to be seen clearly.
Figure 4
Figure 4
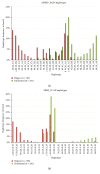
W plot comparing haplotype frequencies in Wagyu and Simmental. Adapted from [58]. (a) The haplotypes are from MPRIP to FASN (see Figure 2). Note SCT-FSN L in Wagyu and S in Simmental, also GH C in Wagyu and GH A in Simmental with GH B largely in the haplotypes common to both breeds. Haplotype designation is MPRIP.TCAP_GH SCT-FSN. (b) Haplotypes are from SREBF1 to TCAP. Haplotype designation is MPRIP.TCAP.SREB.NT5M. The four most common haplotypes of Simmental are also found at high frequency in Wagyu (and many other breeds not shown here), while two of the three most common haplotypes of Wagyu are not found in Simmental (and are not common in any other breed tested).
Figure 5
Figure 5
Crossbreds perform as Wagyu if they possess a Wagyu haplotype. Tm measurements from 9 full blood and 16 crossbred entries to AWA branded beef competition from 2014 and 2015. There are crossbred Wagyu with Tm as low as full bloods. Mean Tm with error bars ± 1 SEM. SREB-TCAP haplotypes. White squares indicate animals with at least one 60.10.S.10 haplotype, pale grey squares indicate animals with at least one 30.20.S.20 haplotype, and dark grey squares indicate animals with neither common Wagyu haplotype.
Figure 6
Figure 6
Dot plots of Tm values in Wagyu 300 ± 20 DOF in animals homozygous for the 5.24 Mb region MPRIP-TCAP. Wagyu cattle bred on different Australian farms (Goorambat, Irongate Wagyu, Mayura, Rosevale, and Peppermint Grove) were fed for 300 days at Mayura Station, South Australia, and beef/fat samples were assayed for C19 haplotypes and fat melting point Tm as indicated in Materials and Methods. Each dot point represents a different homozygote. Homozygous haplotypes for MPRIP-TCAP region only. Student's t-test for 30.20 versus 40.20 yields P = 0.012.
Figure 7
Figure 7
TCAP 20 homozygotes achieve low Tm with less days on feed (Melaleuka crossbreds). TCAP 20 homozygotes (filled circles) achieve low Tm with less days on feed. Hollow circles show TCAP 10 homozygotes. The smoothed lines were calculated in R with a span of 100. Tm measured on various European and Japanese breeds and crossbreeds including Simmental, Gelbvieh, black Wagyu, and red Wagyu. Subcutaneous fat samples were taken from the rump and front ends of striploins, with the Tm reported as the average of the two samples. Striploins were DNA tested to confirm a match to the animal sent to abattoir. 42 samples from TCAP 10 homozygotes and 87 samples from TCAP 20 homozygotes are shown. Tm measurements of 105 samples from TCAP 10,20 heterozygotes have been excluded from the graph for simplicity.
Figure 8
Figure 8
TCAP 20 animals have significantly lower Tm for 50–150 days on feed. The presence of homozygous 20 TCAP alleles makes the decrease in Tm occur at less days on feed. The initial Tm is similar between the two groups. The Tm in both groups appears to reach a minimum level with long feeding that is not affected by the TCAP allele.
Figure 9
Figure 9
Match to desaturation model of fat melting point. The Tm decrease shown in Figure 7 can be described by the following mathematical model of fat production and desaturation. De novo fat production is controlled by FASN, in response to energy balance. This fat starts saturated. It is then desaturated by the SCD enzyme. The total fat present (F) can be described by dF/dt = a, where a is the rate of de novo fat production. The amount of unsaturated fat (U) increases in proportion to the amount of desaturation enzyme E as dU/dt = E. In this model, the amount of enzyme available is increased in response to the amount of saturated fat present, and also decays. The amount of enzyme is described by dE/dt = bScE, where b and c are constant control parameters and S = FU is the amount of fat that remains unsaturated. The melting point decreases with increasing proportion of unsaturated fat. Tm decreases in proportion to the amount of unsaturated fat, Tm = TΔ and S/F + TU. The melting point curves resulting from this model have an initial high Tm decreasing slowly at first and then more rapidly as the desaturation enzyme builds up. This figure shows how the model reacts to parameter changes. The fast enzyme response with parameters b = .001 and c = .1 looks similar to the Tm curve shown in Figure 8, TCAP 20 homozygotes. A slower enzyme response has parameters of b = .0001 and c = .01 is more similar to the Tm curve for TCAP 10 homozygotes. TCAP is already known to be involved in pathways regulating the production of the SCD enzyme, so it influencing the Tm in this way is not surprising.

References

    1. Lloyd S. S., Steele E. J., Dawkins R. L. Analysis of haplotype sequences. In: Kulski J. K., editor. Next Generation Sequencing-Advances, Applications and Challenges. InTech; 2016. pp. 345–368. - DOI
    1. Dawkins R., Leelayuwat C., Gaudieri S., et al. Genomics of the major histocompatibility complex: haplotypes, duplication, retroviruses and disease. Immunological Reviews. 1999;167:275–304. doi: 10.1111/j.1600-065X.1999.tb01399.x. - DOI - PubMed
    1. Dawkins R. L. Adapting Genetics. Dallas, TX, USA: Near Urban Publishing; 2015. - DOI
    1. Awdeh Z. L., Raum D., Yunis E. J., Alper C. A. Extended HLA/complement allele haplotypes: evidence for T/t-like complex in man. Proceedings of the National Academy of Sciences of the United States of America. 1983;80(1):259–263. doi: 10.1073/pnas.80.1.259. - DOI - PMC - PubMed
    1. Yunis E. J., Larsen C. E., Fernandez-Vina M., et al. Inheritable variable sizes of DNA stretches in the human MHC: conserved extended haplotypes and their fragments or blocks. Tissue Antigens. 2003;62:1–20. doi: 10.1034/j.1399-0039.2003.00098.x. - DOI - PubMed

LinkOut - more resources