. 2017 Dec;60(12):2463-2474.
doi: 10.1007/s00125-017-4432-y. Epub 2017 Sep 14.

Liver-specific reconstitution of CEACAM1 reverses the metabolic abnormalities caused by its global deletion in male mice

Affiliations

Liver-specific reconstitution of CEACAM1 reverses the metabolic abnormalities caused by its global deletion in male mice

Lucia Russo et al. Diabetologia. 2017 Dec.

Abstract

Aims/hypothesis: The carcinoembryonic antigen-related cell adhesion molecule 1 (CEACAM1) promotes insulin clearance. Mice with global null mutation (Cc1 -/-) or with liver-specific inactivation (L-SACC1) of Cc1 (also known as Ceacam1) gene display hyperinsulinaemia resulting from impaired insulin clearance, insulin resistance, steatohepatitis and obesity. Because increased lipolysis contributes to the metabolic phenotype caused by transgenic inactivation of CEACAM1 in the liver, we aimed to further investigate the primary role of hepatic CEACAM1-dependent insulin clearance in insulin and lipid homeostasis. To this end, we examined whether transgenic reconstitution of CEACAM1 in the liver of global Cc1 -/- mutant mice reverses their abnormal metabolic phenotype.

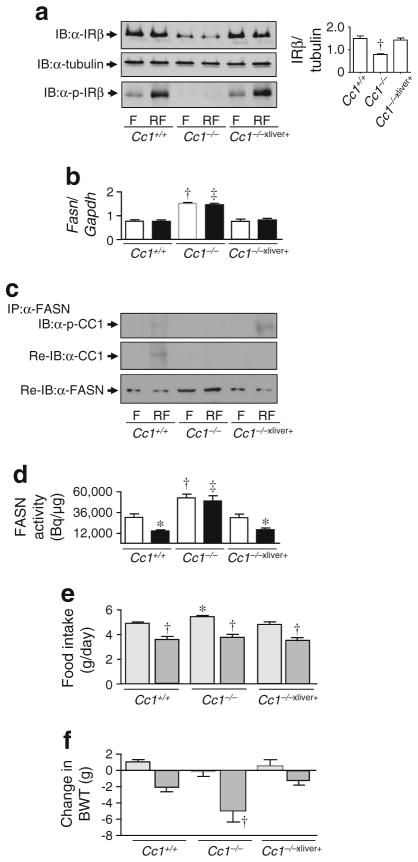
Methods: Insulin response was assessed by hyperinsulinaemic-euglycaemic clamp analysis and energy balance was analysed by indirect calorimetry. Mice were overnight-fasted and refed for 7 h to assess fatty acid synthase activity in the liver and the hypothalamus in response to insulin release during refeeding.

Results: Liver-based rescuing of CEACAM1 restored insulin clearance, plasma insulin level, insulin sensitivity and steatohepatitis caused by global deletion of Cc1. It also reversed the gain in body weight and total fat mass observed with Cc1 deletion, in parallel to normalising energy balance. Mechanistically, reversal of hyperphagia appeared to result from reducing fatty acid synthase activity and restoring insulin signalling in the hypothalamus.

Conclusions/interpretation: Despite the potential confounding effects of deleting Cc1 from extrahepatic tissues, liver-based rescuing of CEACAM1 resulted in full normalisation of the metabolic phenotype, underscoring the key role that CEACAM1-dependent hepatic insulin clearance pathways play in regulating systemic insulin sensitivity, lipid homeostasis and energy balance.

Keywords: CEACAM1; Energy balance; Fatty acid synthase; Hyperinsulinaemia; Insulin clearance; Insulin resistance; Lipolysis; Normoinsulinaemia; Steatohepatitis.


Conflict of interest statement

Duality of interest The authors declare that there is no duality of interest associated with this manuscript.

Figures

Fig. 1
Fig. 1
Tissue-specific expression of the transgene. (ab) Mouse (mCC1) and rat (rCC1) CEACAM1 protein content in intestine (Int), kidney (Kid), heart and liver were analysed by immunoblotting with polyclonal antibodies (α). Immunoblotting with α-mActin was used to normalise for loading. (ce) Cc1+/+ (white bars), Cc1−/− (black bars) and Cc1−/−xliver+ (grey bars) mice (n = 5/genotype; 2 months old) were fasted overnight and retro-orbital blood was drawn to assess plasma insulin (c) and C-peptide (d) levels to calculate steady-state C-peptide/insulin molar ratio (e) as a measure of insulin clearance. Assays were performed in triplicate. Values are expressed as mean ± SEM; *p ≤ 0.05 vs Cc1+/+, p ≤ 0.05 vs Cc1/. (f) Primary hepatocytes of Cc1+/+, Cc1−/− and Cc1−/−xliver+ mice were treated with buffer (–) or insulin (Ins) before cell-surface proteins were labelled with biotin. Proteins were immunoprecipitated with α-streptavidin beads prior to analysis by 7% SDS-PAGE and immunoblotting with antibodies against IRα and whole mouse CEACAM1 with cross-reactivity with the rat protein (CC1). Total lysates were also analysed by immunoblotting with α-mActin. For (a), (b) and (f), gels represent more than two experiments (different mice per genotype per experiment). IB, immunoblotting; IP, immunoprecipitation
Fig. 2
Fig. 2
Hyperinsulinaemic–euglycaemic clamp analysis performed on 6-month-old awake overnight-fasted mice. Measurements under clamp conditions with primed and continuous infusion of insulin are shown for Cc1+/+ (white bars), Cc1−/− (black bars) and Cc1−/−xliver+ (dark grey bars) mice (n = 8–9/genotype). In (a), (b) and (e), measurements for the basal condition (light grey bars in all genotypes) are also shown. Values are expressed as mean ± SEM; *p ≤ 0.05 vs Cc1+/+, p ≤ 0.05 vs Cc1−/−, p ≤ 0.05 vs basal. Gastroc., gastrocnemius; Ra, rate of appearance; Rd., rate of disposal; WB, whole body
Fig. 3
Fig. 3
Lipid metabolism in the liver. (ad) H&E staining in the liver of 8-month-old Cc1+/+ (a), Cc1−/− (b), L-CC1 (c) and Cc1−/−xliver+ (d) mice (n = 5/genotype). Yellow arrow points to foci of inflammatory cell infiltrates. (e) Hepatic FAO (palmitate) in fasted Cc1+/+ (white bars), Cc1−/− (black bars), L-CC1 (light grey bars) and Cc1−/−xliver+ (dark grey bars) mice (n = 5/genotype). Assays were performed in triplicate. (f) mRNA analysis of Fgf21 (performed in triplicate) in the livers of Cc1+/+ (white bars), Cc1−/− (black bars), L-CC1 (light grey bars) and Cc1−/−xliver+ (dark grey bars) mice (n = 5; 6 months of age). Values are expressed as mean ± SEM; *p ≤ 0.05 vs Cc1+/+ and p ≤ 0.05 vs Cc1−/−; (gj) Mice (2 months of age) were fasted overnight (white bars or ‘F’) and refed for 7 h (black bars or ‘RF’). (g, h) Analysis of plasma insulin levels (n = 6 per genotype per feeding state) (g) and Fasn mRNA expression relative to Gapdh (n = 5 per genotype per feeding state; performed in triplicate) (h). Values are expressed as mean ± SEM. (i) Western blot analysis of liver lysates was performed to assess insulin receptor protein level (α-IRβ) and phosphorylation (α-p-IRβ). Immunoblotting with α-tubulin was carried out for normalisation. Quantification of IRβ to tubulin was measured by densitometry in fasting samples. (j) Some aliquots were subjected to immunoprecipitation with α-FASN followed by immunoblotting with αp-CEACAM1 antibody (α-p-CC1). Gels represent two separate experiments performed on different mice per genotype per feeding state. (k) FASN activity was measured in triplicate by [14C]malonyl-CoA incorporation (n = 5 per genotype per feeding state). Values are expressed as mean ± SEM. For (gi) and (k), *p < 0.05 refed vs fasted per genotype, p ≤ 0.05 Cc1−/− vs other genotypes at fasting, p ≤ 0.05 vs other genotypes at refeeding. IB, immunoblotting; IP, immunoprecipitation
Fig. 4
Fig. 4
Energy balance. Six-month-old Cc1+/+ (white), Cc1−/− (black) and Cc1−/−xliver+ (grey) mice were individually caged (n = 4/genotype) and analysed by indirect calorimetry (CLAMS system) for 5 days to measure (a) daily food intake, (b) total locomotor activity (counts/day) and (c) heat production (kJ h−1 kg−1) every 20 min at a flow rate of 0.5 l/min for 24 h. Values are expressed as mean ± SEM of each time interval in the last 3 days in the light (07:00 hours to 19:00 hours) and dark (shaded; 19:00 hours to 07:00 hours) cycle. *p ≤ 0.05 Cc1−/− vs Cc1+/+, p ≤ 0.05 Cc1−/−xliver+ vs Cc1−/−
Fig. 5
Fig. 5
Regulation of hypothalamic FASN activity. Hypothalami were extracted from the same 2-month-old mice used in Fig. 3g–k after being fasted (‘F’ or white bars) or refed for 7 h (‘RF’ or black bars). (a) Lysates were analysed by immunoblotting with α-IRβ or α-p-IRβ, using α-tubulin for normalisation. (b) mRNA analysis of Fasn relative to Gapdh (n = 5 per genotype per feeding state) was performed in triplicate. Values are expressed as mean ± SEM; p ≤ 0.05 Cc1−/− vs other genotypes at fasting, p ≤ 0.05 vs other genotypes at refeeding. (c) As in Fig. 3j, some aliquots were subjected to immunoprecipitation with α-FASN followed by immunoblotting with the α-p-CEACAM1 antibody (α-p-CC1) that also recognises CEACAM2 (a related protein with a cytoplasmic tail that shares a very high homology with that of CEACAM1). Proteins were reimmunoblotted with α-CEACAM1 antibody (α-CC1) for normalisation and with α-FASN antibody to account for the amount of immunoprecipitated FASN. Gels represent two separate experiments performed on different mice per genotype per feeding state. (d) FASN activity was measured in triplicate by [14C]malonyl-CoA incorporation (n = 5 per genotype per feeding state). Values are expressed as mean ± SEM; *p < 0.05 refed vs fasted per genotype, p ≤ 0.05 Cc1−/− vs other genotypes at fasting, p ≤ 0.05 vs other genotypes at refeeding; (e) Daily food intake (n = 6 per genotype per treatment; 6-month-old mice) and (f) body weight (BWT) (n = 6 per genotype per treatment; 6-month-old) were assessed over a period of 4 days in mice receiving an i.p. injection of vehicle (Veh, light grey bars) or C75 (dark grey bars). Data are presented as the difference between day 4 and day 0 of treatment. Values are expressed as mean ± SEM. For (e) and (f), *p < 0.05 vs vehicle-treated Cc1+/+, p < 0.05 vs vehicle-treated within genotype. IB, immunoblotting; IP, immunoprecipitation
Fig. 6
Fig. 6
Metabolic effect of nicotinic acid on insulin clearance and tolerance. (a) Six-month-old mice were treated with vehicle (Veh) or two injections of nicotinic acid (n = 6 per genotype per treatment) before being fasted until 11:00 hours and plasma NEFA was assayed. (bd) Insulin and C-peptide were assayed and the molar ratio measured as a marker of insulin clearance. (e, f) Insulin tolerance was also assessed in mice treated with Veh (e) or nicotinic acid (f). Cc1+/+, white; Cc1−/−, black; L-CC1, light grey; Cc1−/−xliver+, dark grey. Values are expressed as mean ± SEM. For (ad), *p ≤ 0.05 vs Cc1+/+, p ≤ 0.05 Cc1−/−xliver+ vs Cc1−/−; for (ef), *p ≤ 0.05, Cc1+/+ vs other mice

Similar articles

Cited by

References

    1. Petersen KF, Dufour S, Savage DB, et al. The role of skeletal muscle insulin resistance in the pathogenesis of the metabolic syndrome. Proc Natl Acad Sci U S A. 2007;104:12587–12594. - PMC - PubMed
    1. Cook JR, Langlet F, Kido Y, Accili D. Pathogenesis of selective insulin resistance in isolated hepatocytes. J Biol Chem. 2015;290:13972–13980. - PMC - PubMed
    1. Shanik MH, Xu Y, Skrha J, Dankner R, Zick Y, Roth J. Insulin resistance and hyperinsulinemia: is hyperinsulinemia the cart or the horse? Diabetes Care. 2008;31(Suppl 2):S262–S268. - PubMed
    1. Matveyenko AV, Liuwantara D, Gurlo T, et al. Pulsatile portal vein insulin delivery enhances hepatic insulin action and signaling. Diabetes. 2012;61:2269–2279. - PMC - PubMed
    1. Han E, Phan D, Lo P, et al. Differences in tissue-specific and embryonic expression of mouse Ceacam1 and Ceacam2 genes. Biochem J. 2001;355:417–423. - PMC - PubMed

Publication types

LinkOut - more resources