Review
. 2018 Feb;31(1):131-141.
doi: 10.1007/s10334-017-0649-5. Epub 2017 Sep 15.

State-of-the-art review: stress T1 mapping-technical considerations, pitfalls and emerging clinical applications

Affiliations
Review

State-of-the-art review: stress T1 mapping-technical considerations, pitfalls and emerging clinical applications

Stefan K Piechnik et al. MAGMA. 2018 Feb.

Abstract

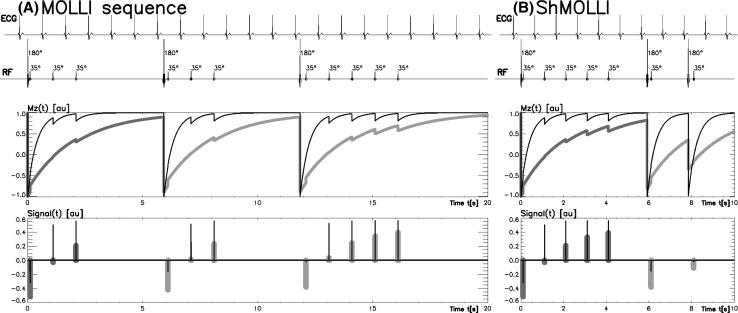
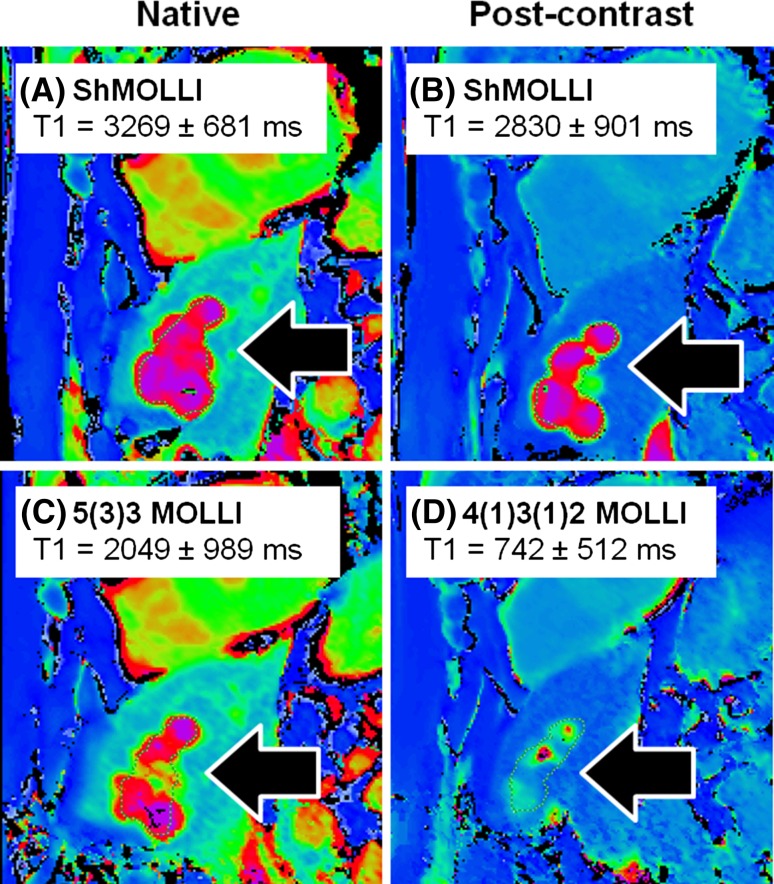
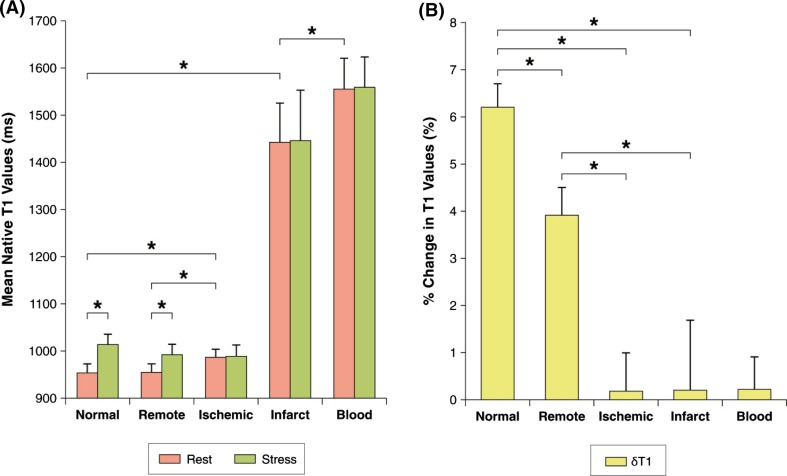
In vivo mapping of the myocardial T1 relaxation time has recently attained wide clinical validation of its potential utility. In this review, we address the basic principles of the T1 mapping techniques, with particular attention to the emerging application of vasodilatory stress agents to interrogate the myocardial microvascular compartment, and differences between commonly used T1 mapping methods when applied in clinical practice.

Keywords: Cardiovascular magnetic resonance; Stress; T1 mapping; Tissue characterization; Vascular reactivity.


Conflict of interest statement

Professor Stefan K. Piechnik has patent authorship rights for US patent 9285446 B2. Systems and methods for shortened Look-Locker inversion recovery (Sh-MOLLI) cardiac gated mapping of T1. Granted March 15, 2016. The patent is managed by Oxford University. All rights transferred exclusively to Siemens Medical. To date, SKP received £4396.92 for this IP, before tax and National Insurance deductions.

Figures

Fig. 1
Fig. 1
ECG-gated pulse sequence schemes for simulation of a MOLLI and b ShMOLLI at a heart rate of 60 bpm. SSFP readouts are simplified to a single 35° pulse each, presented at a constant delay time TD from each preceding R wave. The 180° inversion pulses are shifted depending on the inversion recovery (IR) number to achieve the desired first TI of 100, 180 and 260 ms in the consecutive IR experiments. The plots below represent the evolution of longitudinal magnetisation (Mz) for short T1 (400 ms, thin lines) and long T1 (2000 ms, thick lines). Note that long epochs free of signal acquisitions minimise the impact of incomplete Mz recoveries in MOLLI so that all acquired samples can be pooled together for T1 reconstruction. In ShMOLLI, the validity of additional signal samples from the second and third IR epochs is determined by progressive nonlinear estimation. As originally published by BioMed Central in Piechnik [3]
Fig. 2
Fig. 2
Characterizing tissues with very long T1 values using different T1 mapping techniques. Shown are T1 maps from a patient with a past history of breast cancer. Liver cysts (black arrows) observed with ShMOLLI retains the characteristic very long T1 both pre- (a) and post-gadolinium-based contrast due to its consistent performance over a wide range of heart rates and T1 values. In c, the 5(3)3 MOLLI variant pre-contrast T1 map shows ~30% lower T1 in the liver cysts, consistent with the back-loaded 11-heartbeart MOLLI 3(3)5 variant [4]. d Post-contrast T1 map using the 4(1)3(1)2 MOLLI variant dedicated for post-contrast applications suffers substantial underestimation of cystic T1 by >70%. Comparing c and d, cystic lesions may appear to take up gadolinium-based contrast agents (GCBAs), which may suggest a tumour with communication to the vasculature, rather than what would be expected for a cyst. T1 is quoted for manual regions of interests drawn within the cysts. Colour tables are identical for all panels shown, as in Siemens ShMOLLI distributions for ease of comparisons
Fig. 3
Fig. 3
T1 maps using incremental thresholds demonstrate the predominantly non-ischaemic pattern of injury across a spectrum of acute myocarditis. Red indicates areas of myocardium with a T1 value above the stated threshold of at least 40 mm2 in contiguous area. A T1 threshold of 990 ms was previously validated for the detection of acute myocardial oedema; other thresholds were selected for illustrative purposes. As originally published by Biomed Central in Ferreira et al. [13]
Fig. 4
Fig. 4
Myocardial T1 at rest and during adenosine stress at 1.5 T. a T1 values at rest in normal and remote tissue were similar and significantly lower than in ischemic regions. Infarct T1 was the highest of all myocardial tissue, but lower than the reference left ventricular blood pool of patients. During adenosine stress, normal and remote myocardial T1 increased significantly from baseline, while T1 in ischemic and infarcted regions remained relatively unchanged. b Relative T1 reactivity (δT1) in the patient’s remote myocardium was significantly blunted compared to normal, and completely abolished in ischemic and infarcted regions. All data indicate mean ± 1 SD. *p < 0.05. As originally published by Elsevier in Liu [28]
Fig. 5
Fig. 5
Proposed myocardial water compartments in aortic stenosis. Proposed changes in myocardial water compartments at rest and stress in patients with aortic stenosis pre and post AVR, and controls (left). The T1 response to adenosine was mainly contributed to by vascular responses instead of interstitial space expansion which may be negligible. Note that T1 and volumes from vascular cross-sections are for qualitative comparison only and not to scale. As originally published by BioMed Central in Mahmod et al. [27]
Fig. 6
Fig. 6
Representative stress and rest splenic first-pass gadolinium perfusion and native T1 maps. Signal intensity (SI) curves represent splenic perfusion SI (y-axis, arbitrary units) over time (x-axis, 50–60 s). The maximum and minimum SIspleen are as indicated. Splenic regions of interests on perfusion images and T1 maps are outlined in red and black, respectively. Mean native T1spleen and stress changes (ΔT1 spleen) are as labelled. 3 T images were used for illustration (observed ΔT1 spleen and ΔSI spleen are field strength-independent). As originally published by BioMed Central in Liu et al. [29] (color figure online)
Fig. 7
Fig. 7
Mechanism for the impact of heart rate sensitivity on the measured stress T1 responses using MOLLI variants. MOLLIs generally underestimate T1, hence all coloured lines are under the unity line (grey dotted). ShMOLLI has no heart rate (HR) dependence, and behaves like the HR 40 (dark blue) line across the HR range of 40–100 beats per minute. As a result, when myocardial T1 increases during vasodilatory stress (solid blue arrow, x-axis), this corresponds to just moving along a single linear relationship (dark blue HR 40), and preserves the relative size of the T1 response (6%). The MOLLI 3(3)5 variant [4] illustrated here is HR dependent. Thus, when myocardial T1 increases during vasodilatory stress, the transition involves simultaneous switching between HR-dependent relationships (red arrow “HR”). This results in a lower ~4% stress T1 response using the MOLLI 3(3)5 variant. Adapted from Fig. 2 originally published by BioMed Central in Lee et al. [4] (color figure online)

References

    1. Moon J, Messroghli D, Kellman P, Piechnik S, Robson M, Ugander M, Gatehouse P, Arai A, Friedrich M, Neubauer S, Schulz-Menger J, Schelbert E. Myocardial T1 mapping and extracellular volume quantification: a Society for Cardiovascular Magnetic Resonance (SCMR) and CMR Working Group of the European Society of Cardiology consensus statement. J Cardiovasc Magn Reson. 2013;15(1):92. doi: 10.1186/1532-429X-15-92. - DOI - PMC - PubMed
    1. Messroghli DR, Radjenovic A, Kozerke S, Higgins DM, Sivananthan MU, Ridgway JP. Modified look-locker inversion recovery (MOLLI) for high-resolution T1 mapping of the heart. Magn Reson Med. 2004;52(1):141–146. doi: 10.1002/mrm.20110. - DOI - PubMed
    1. Piechnik SK, Ferreira VM, Dall’Armellina E, Cochlin LE, Greiser A, Neubauer S, Robson MD. Shortened Modified Look-Locker Inversion recovery (ShMOLLI) for clinical myocardial T1-mapping at 1.5 and 3 T within a 9 heartbeat breathhold. J Cardiovasc Magn Reson. 2010;12:69. doi: 10.1186/1532-429X-12-69. - DOI - PMC - PubMed
    1. Lee J, Liu S, Nacif M, Ugander M, Han J, Kawel N, Sibley C, Kellman P, Arai A, Bluemke D. Myocardial T1 and extracellular volume fraction mapping at 3 tesla. J Cardiovasc Magn Reson. 2011;13(1):75. doi: 10.1186/1532-429X-13-75. - DOI - PMC - PubMed
    1. Weingärtner S, Roujol S, Akçakaya M, Basha TA, Nezafat R. Free-breathing multislice native myocardial T1 mapping using the slice-interleaved T1 (STONE) sequence. Magn Reson Med. 2015;74(1):115–124. doi: 10.1002/mrm.25387. - DOI - PubMed

MeSH terms

LinkOut - more resources