. 2018;15(4-5):604-613.
doi: 10.1080/15476286.2017.1379636. Epub 2017 Nov 13.

IF2 and unique features of initiator tRNAfMet help establish the translational reading frame

Affiliations

IF2 and unique features of initiator tRNAfMet help establish the translational reading frame

Bappaditya Roy et al. RNA Biol. 2018.

Abstract

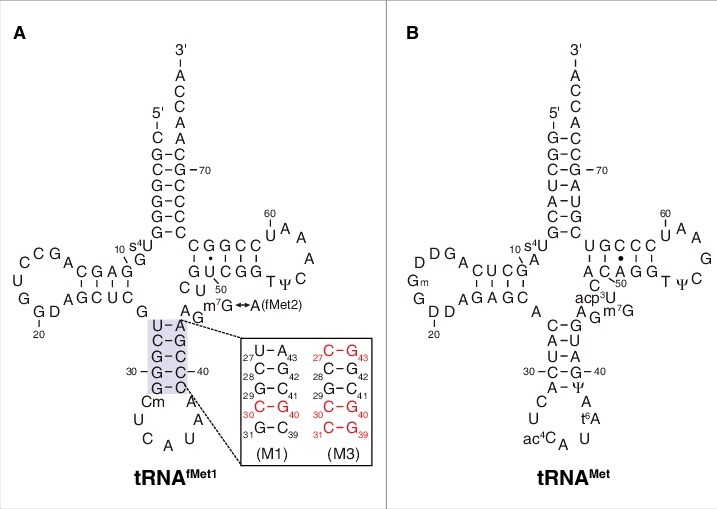
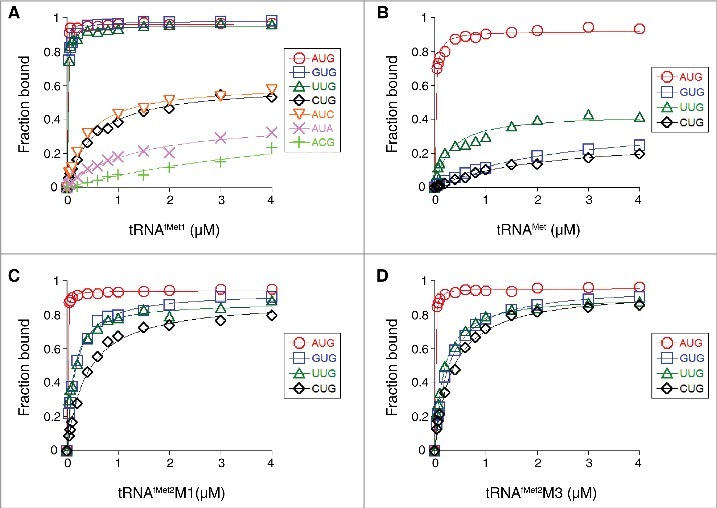
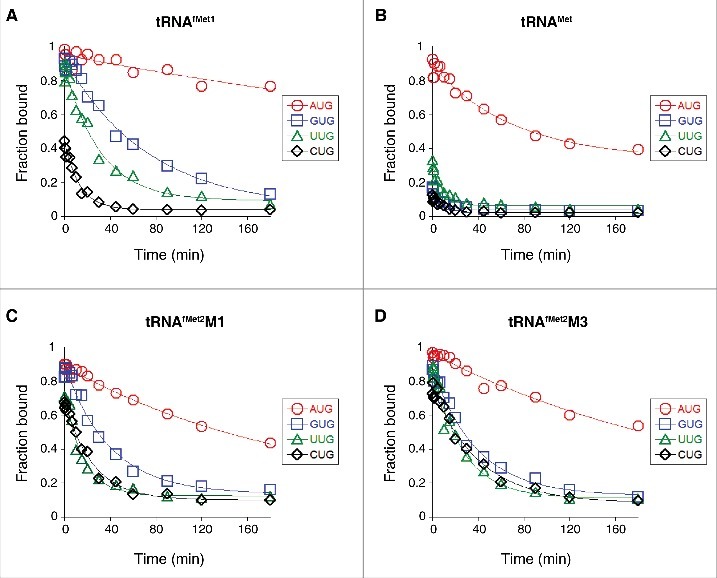
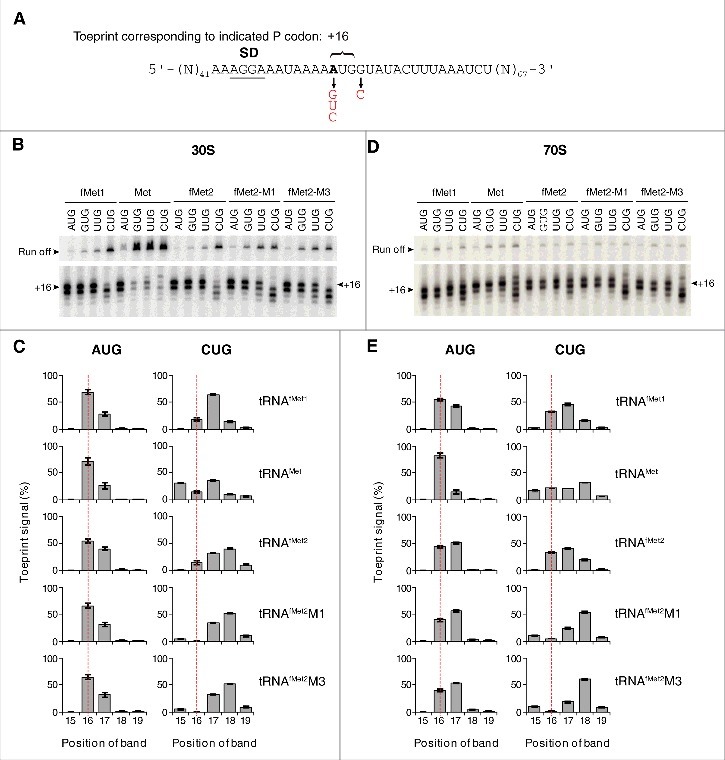
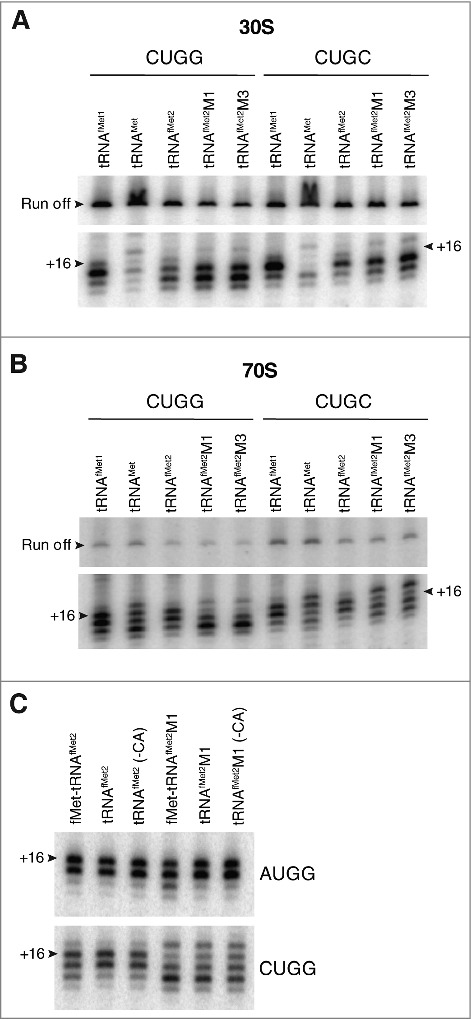
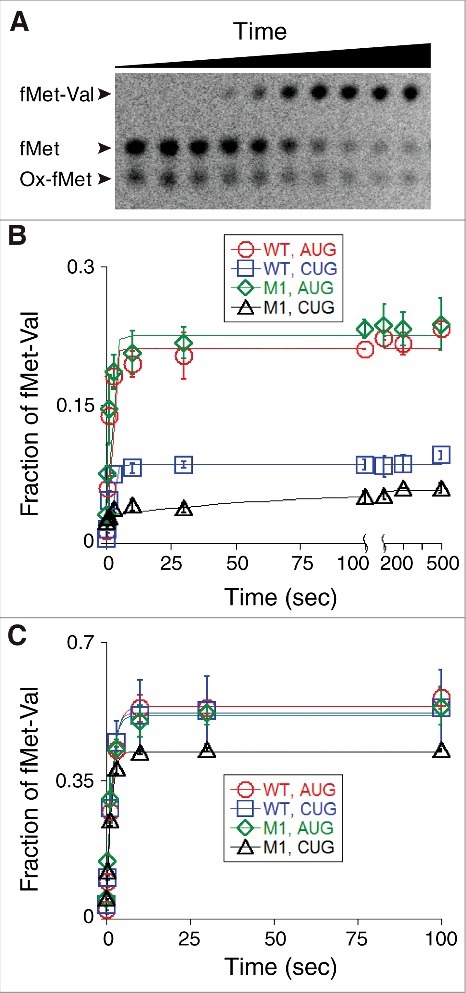
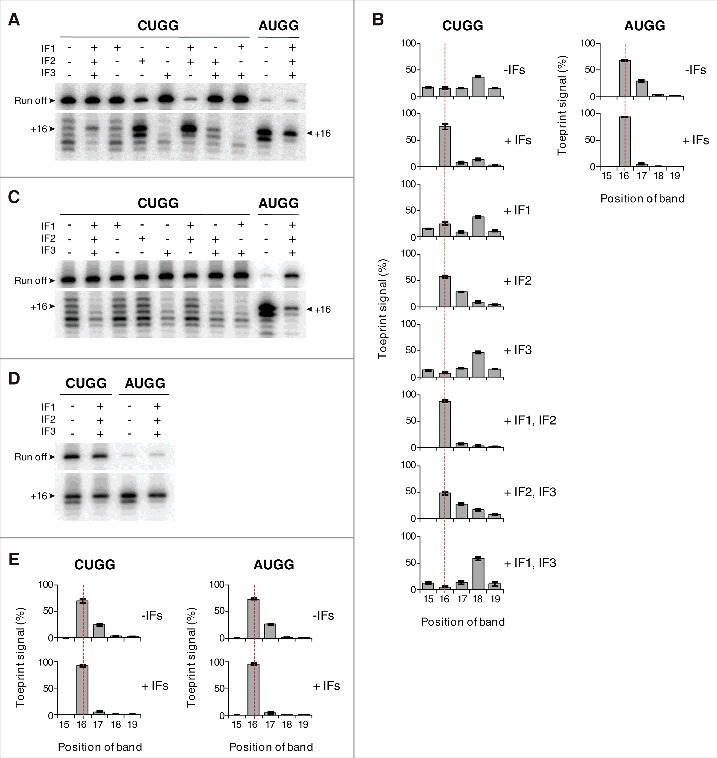
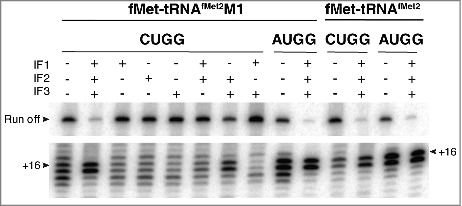
Translation begins at AUG, GUG, or UUG codons in bacteria. Start codon recognition occurs in the P site, which may help explain this first-position degeneracy. However, the molecular basis of start codon specificity remains unclear. In this study, we measured the codon dependence of 30S•mRNA•tRNAfMet and 30S•mRNA•tRNAMet complex formation. We found that complex stability varies over a large range with initiator tRNAfMet, following the same trend as reported previously for initiation rate in vivo (AUG > GUG, UUG > CUG, AUC, AUA > ACG). With elongator tRNAMet, the codon dependence of binding differs qualitatively, with virtually no discrimination between GUG and CUG. A unique feature of initiator tRNAfMet is a series of three G-C basepairs in the anticodon stem, which are known to be important for efficient initiation in vivo. A mutation targeting the central of these G-C basepairs causes the mRNA binding specificity pattern to change in a way reminiscent of elongator tRNAMet. Unexpectedly, for certain complexes containing fMet-tRNAfMet, we observed mispositioning of mRNA, such that codon 2 is no longer programmed in the A site. This mRNA mispositioning is exacerbated by the anticodon stem mutation and suppressed by IF2. These findings suggest that both IF2 and the unique anticodon stem of fMet-tRNAfMet help constrain mRNA positioning to set the correct reading frame during initiation.

Keywords: IF1; IF3; P site; initiation; ribosome; start codon selection.


Figures

Figure 1.
Figure 1.
Transfer RNA molecules used in this study. Secondary structures of E. coli tRNAfMet1 (A) and tRNAMet (B) are shown, with mutations M1 and M3 of the anticodon stem of tRNAfMet indicated. Isoacceptor tRNAfMet2 is identical to tRNAfMet1 except that nucleotide 46 is A rather than m7G. D, dihydrouridine; Ψ, pseudouridine; s4U, 4-thiouridine; Cm, 2′-O-methylcytidine; Gm, 2′-O-methylguanosine; m7G, 7-methylguanosine; ac4C, N4-acetylcytidine; acp3U, 3-(3-amino-3-carboxypropyl)uridine; t6A, N6-threonylcarbamoyladenosine.
Figure 2.
Figure 2.
Effects of the start codon and tRNA sequence on the thermodynamic stability of the 30S•mRNA•tRNA complex. 30S subunits (1 µM) were incubated with mRNA (0.01 µM; with indicated start codon and preannealed radiolabeled primer) and various concentrations of tRNAfMet1 (A), tRNAMet (B), tRNAfMet2M1 (C), or tRNAfMet2M3 (D) for 2 h at 37°C, and then complexes were analyzed by toeprinting. Fraction of bound mRNA (F) was quantified as [toeprint signal / (toeprint + run-off signal)] and plotted versus input tRNA concentration. Data were fit to the equation F = Fmax[bc/(bc+1/K TC)], where b is the input tRNA concentration, c is the input 30S concentration, K TC is the equilibrium association constant, and Fmax is the maximal level of detected complex. For the ACG case of panel A, the Fmax parameter was set arbitrarily at 1.0 prior to fitting the curve shown. All K TC and Fmax values are listed in Table 1.
Figure 3.
Figure 3.
Effects of the start codon and tRNA sequence on the kinetic stability of the 30S•mRNA•tRNA complex. Complexes were pre-formed by incubating 30S subunits (1 µM), mRNA (0.05 µM; with indicated start codon and preannealed radiolabeled primer), and 1.5 µM tRNAfMet1 (A), tRNAMet (B), tRNAfMet2M1 (C), or tRNAfMet2M3 (D) for 2 h at 37°C. At time t = 0, an excess of chase mRNA (containing start codon AUG and lacking the primer binding site) was added, and aliquots were removed at various time points and subjected to primer extension analysis. Fraction of toeprint signal (F) was quantified and plotted as a function of time. Data were fit to a single exponential function to obtain the mRNA dissociation rate, k off, for each complex (listed in Table 1).
Figure 4.
Figure 4.
Positioning of mRNA in various ribosomal complexes. (A) Model mRNAs used in this study. The Shine-Dalgarno element (SD) is underscored and position +1 of the start codon is highlighted in bold text. Various base substitutions made at positions +1 and +4 are shown. 30S (B-C) or 70S (D-E) complexes containing P-site tRNA (as indicated) paired to start codon (as indicated) were analyzed by toeprinting. Complexes were formed in the absence of factors by incubating ribosomes or subunits (1 µM), mRNA (0.01 µM, with preannealed radiolabeled primer), and tRNA (1.5 µM) for 2 h at 37°C, prior to primer extension analysis. Top gel panels show the relative intensities of the full-length cDNA products (Run off). Bottom gel panels show the toeprint bands, with +16 indicated. Histograms show the distribution of toeprint signal versus toeprint position for each 30S (C) and 70S (E) complex. Data were quantified for each complex as (specific toeprint / all toeprints) ×100% and correspond to the mean ± SEM from ≥ 3 independent experiments. The dotted red line benchmarks position +16.
Figure 5.
Figure 5.
Contribution of nucleotide +4 of mRNA to anomalous toeprint patterns. Toeprints of 30S (A) or 70S (B) complexes containing P-site tRNA (as indicated) paired to mRNA with CUGG or CUGC (as indicated). (C) Comparison of toeprints of 70S complexes carrying acylated, deacylated, or 3′ truncated tRNAfMet2 (as indicated) bound to the P site and paired with AUGG or CUGG (as indicated). Experimental conditions as in Fig. 4, except that incubation time for complex formation was 30 min for the experiments of panel C.
Figure 6.
Figure 6.
Functional assessment of various 70S ICs with respect to decoding of codon 2. (A) Example of an experiment measuring dipeptide formation. A 70S IC containing f[35S]Met-tRNAfMet2 paired to AUG in the P site and codon GUA in the A site was rapidly mixed with EF-Tu•GTP•Val-tRNA at time t = 0, and samples quenched at various time points were analyzed by electrophoretic TLC. Ox-fMet, oxidized fMet. (B) 70S complexes containing P-site fMet-tRNAfMet2 (WT) or fMet-tRNAfMet2M1 (M1) paired to AUG or CUG mRNA (as indicated) were formed non-enzymatically. Each was rapidly mixed with EF-Tu•GTP•Val-tRNA, and the rate of fMet-Val formation was quantified as a function of time. Data points represent mean ± range values (n = 2), which were used to fit to a signal exponential equation, generating the curves shown. (C) Experimental setup as in panel B except that the 70S ICs were formed enzymatically, in the presence of initiation factors and GTP.
Figure 7.
Figure 7.
Initiation factors rectify mRNA positioning in various 30S complexes. 30S subunits (2 µM, CUGG; 1 µM, AUGG) were incubated with fMet-tRNAfMet2M1 (A-B, 2 µM), tRNAfMet2M1 (C, 2 µM), or fMet-tRNAfMet2 (D-E, 2 µM) in the presence of mRNA (CUGG, 1 µM; AUGG, 0.1 µM), GTP (100 µM), and in the absence or presence of initiation factors (3 µM each, as indicated) at 37°C for 5 min, and complexes were analyzed by toeprinting. Histograms show the distribution of toeprint signal versus toeprint position for complexes containing mutant (B) or control (E) tRNA. Data represent the mean ± SEM from ≥ 3 independent experiments. The dotted red line benchmarks position +16.
Figure 8.
Figure 8.
Initiation factors rectify mRNA positioning in 70S complexes. Ribosomes (2 µM, CUGG; 1 µM, AUGG) were incubated with fMet-tRNAfMet2M1 or fMet-tRNAfMet2 (2 µM, as indicated) in the presence of mRNA (CUGG, 1 µM; AUGG, 0.1 µM), GTP (100 µM), and in the absence or presence of initiation factors (3 µM each, as indicated) at 37°C for 5 min, and complexes were analyzed by toeprinting.

Similar articles

Cited by

References

    1. Milon P, Rodnina MV. Kinetic control of translation initiation in bacteria. Critical Reviews in Biochemistry and Molecular Biology. 2012;47:334–48. doi:10.3109/10409238.2012.678284. - DOI - PubMed
    1. Caban K, Gonzalez RL Jr.. The emerging role of rectified thermal fluctuations in initiator aa-tRNA- and start codon selection during translation initiation. Biochimie. 2015;114:30–8. doi:10.1016/j.biochi.2015.04.001. - DOI - PMC - PubMed
    1. Milon P, Maracci C, Filonava L, Gualerzi CO, Rodnina MV. Real-time assembly landscape of bacterial 30S translation initiation complex. Nature Structural & Molecular Biology. 2012;19:609–15. doi:10.1038/nsmb.2285. - DOI - PubMed
    1. Antoun A, Pavlov MY, Lovmar M, Ehrenberg M. How initiation factors maximize the accuracy of tRNA selection in initiation of bacterial protein synthesis. Molecular Cell. 2006;23:183–93. doi:10.1016/j.molcel.2006.05.030. - DOI - PubMed
    1. Milon P, Konevega AL, Gualerzi CO, Rodnina MV. Kinetic checkpoint at a late step in translation initiation. Molecular Cell. 2008;30:712–20. doi:10.1016/j.molcel.2008.04.014. - DOI - PubMed

Publication types

MeSH terms

LinkOut - more resources