. 2018 Feb;25(2):229-240.
doi: 10.1038/cdd.2017.144. Epub 2017 Sep 15.

SIRT3/SOD2 maintains osteoblast differentiation and bone formation by regulating mitochondrial stress

Affiliations

SIRT3/SOD2 maintains osteoblast differentiation and bone formation by regulating mitochondrial stress

Jing Gao et al. Cell Death Differ. 2018 Feb.

Abstract

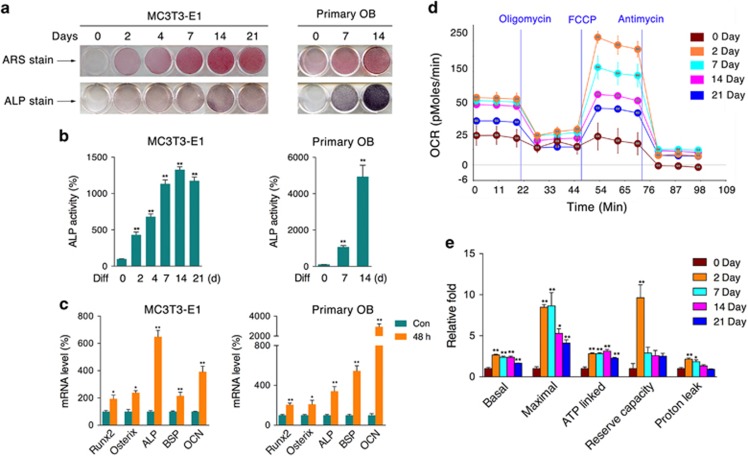
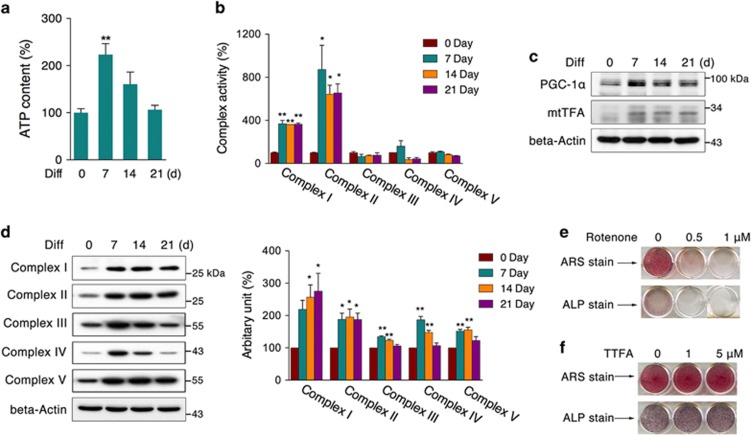
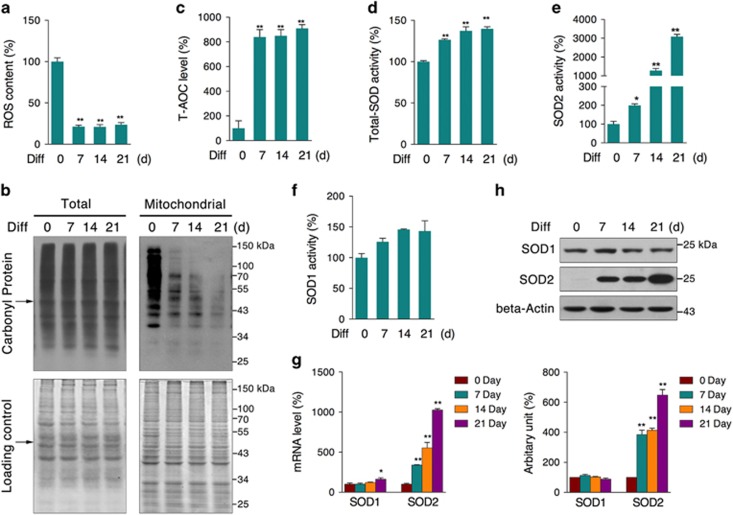
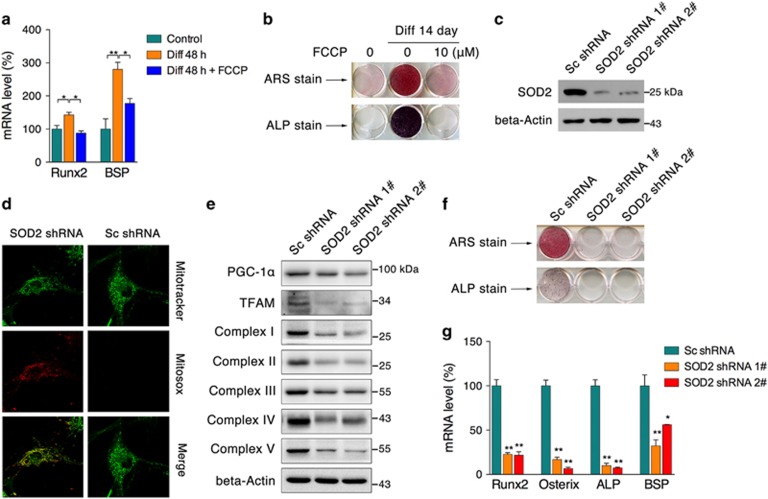
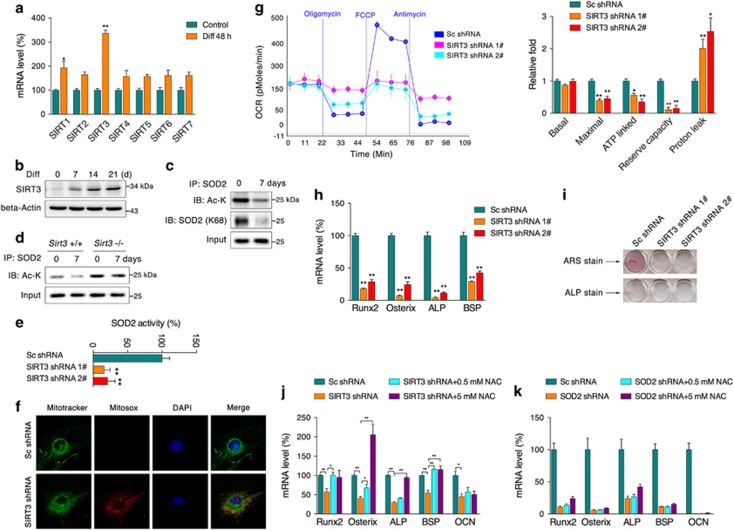
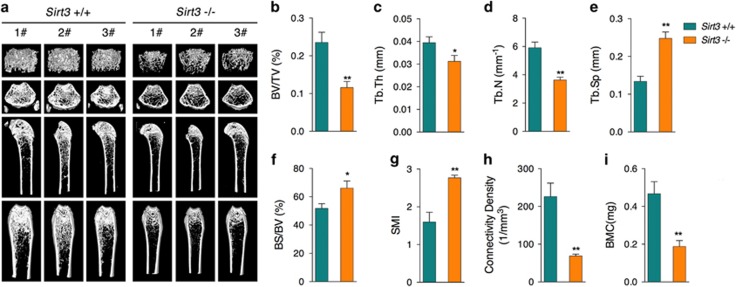
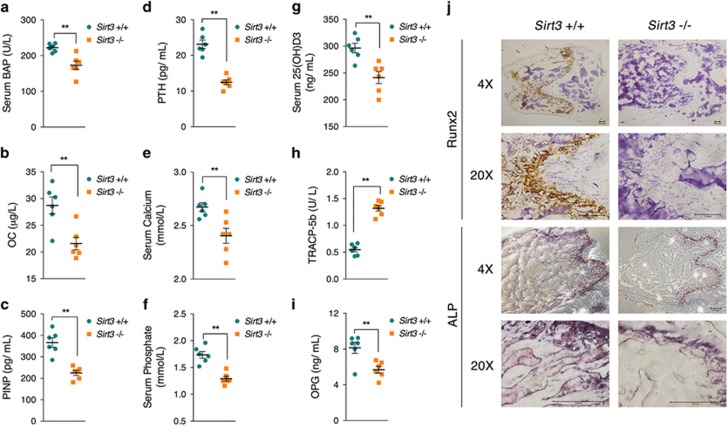
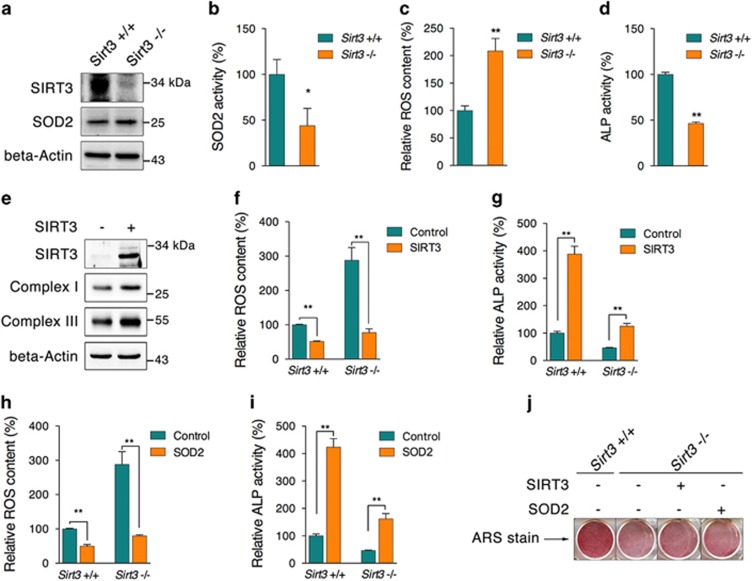
Recent studies have revealed robust metabolic changes during cell differentiation. Mitochondria, the organelles where many vital metabolic reactions occur, may play an important role. Here, we report the involvement of SIRT3-regulated mitochondrial stress in osteoblast differentiation and bone formation. In both the osteoblast cell line MC3T3-E1 and primary calvarial osteoblasts, robust mitochondrial biogenesis and supercomplex formation were observed during differentiation, accompanied by increased ATP production and decreased mitochondrial stress. Inhibition of mitochondrial activity or an increase in mitochondrial superoxide production significantly suppressed osteoblast differentiation. During differentiation, SOD2 was specifically induced to eliminate excess mitochondrial superoxide and protein oxidation, whereas SIRT3 expression was increased to enhance SOD2 activity through deacetylation of K68. Both SOD2 and SIRT3 knockdown resulted in suppression of differentiation. Meanwhile, mice deficient in SIRT3 exhibited obvious osteopenia accompanied by osteoblast dysfunction, whereas overexpression of SOD2 or SIRT3 improved the differentiation capability of primary osteoblasts derived from SIRT3-deficient mice. These results suggest that SIRT3/SOD2 is required for regulating mitochondrial stress and plays a vital role in osteoblast differentiation and bone formation.


Conflict of interest statement

The authors declare no conflict of interest.

Figures

Figure 1
Figure 1
Increased mitochondrial oxygen consumption in osteoblast differentiation. MC3T3-E1 cells and calvaria-derived primary osteoblasts were induced to differentiate for the indicated periods of time. (a) ARS and ALP staining of differentiated cells. (b) ALP activity of cell homogenates. (c) After differentiation for 48 h, the relative mRNA levels of Runx2, Osterix, ALP, BSP, and OCN were determined by qRT-PCR. The oxygen consumption rate (OCR) of MC3T3-E1 cells at various time points was measured with an XF24 Extracellular Flux Analyzer (d) experiment program and (e) statistical analysis). Data are presented as the mean±S.E.M. from at least three independent experiments. *P<0.05, **P<0.01 versus relative control
Figure 2
Figure 2
Mitochondrial biogenesis during osteogenic differentiation. MC3T3-E1 cells were induced to differentiate for 7, 14, and 21 days. (a) ATP content, (b) mitochondrial complex activities, (c) protein levels of PGC-1α and mtTFA, and (d) mitochondrial complex subunits were tested. (e) Cells were induced to differentiate for 7 days with rotenone, and ARS and ALP staining were performed to evaluate differentiation capacity. (f) Cells were induced to differentiate for 7 days with TTFA, and ARS and ALP staining were performed. Data are presented as the mean±S.E.M. from at least three independent experiments. *P<0.05, **P<0.01 versus relative control
Figure 3
Figure 3
Elevated antioxidative capacity during osteogenic differentiation. MC3T3-E1 cells were induced to differentiate for 7, 14, and 21 days, and cellular antioxidative capacity was evaluated by testing (a) cellular ROS content, (b) total and mitochondrial carbonyl protein levels, (c) T-AOC, (d) total-SOD activity, (e) SOD2 activity, (f) SOD1 activity, (g) mRNA levels of SOD1 and SOD2, and (h) protein levels of SOD1 and SOD2. Data are presented as the mean±S.E.M. from at least three independent experiments. *P<0.05, **P<0.01 versus relative control
Figure 4
Figure 4
SOD2 is required for osteogenic differentiation. (a) MC3T3-E1 cells were induced to differentiate for 48 h with or without 10 μM FCCP, and mRNA levels of Runx2 and BSP were tested. (b) Cells were induced to differentiate for 14 days with or without 10 μM FCCP, and ARS and ALP staining was performed. (c) SOD2 protein content from cells that stably expressed SOD2 shRNA was tested by western blot. (d) Mitochondrial superoxide levels were visualized by fluorescence staining. (e) Mitochondrial biogenesis regulators and mitochondrial complex subunits were analyzed by western blot. (f) ARS and ALP staining of SOD2-knockdown cells differentiated for 7 days. (g) mRNA levels of Runx2, Osterix, ALP, and BSP from SOD2-knockdown cells differentiated for 2 days. Data are presented as the mean±S.E.M. from at least three independent experiments. *P<0.05, **P<0.01 versus relative control
Figure 5
Figure 5
SIRT3 deacetylates SOD2 to maintain mitochondrial function and osteogenic differentiation. (a) mRNA levels of sirtuin family members in MC3T3-E1 cells under differentiation conditions for 48 h. (b) SIRT3 protein expression in cells under differentiation conditions for the indicated period. (c) SOD2 acetylation and specific K68 acetylation after 7 days of differentiation was analyzed by immunoprecipitation. (d) SOD2 acetylation of primary osteoblasts from wild-type and Sirt3−/− mice after 7 days of differentiation was analyzed by immunoprecipitation. (e) SOD2 activity of SIRT3-knockdown cells. (f) Mitochondrial superoxide levels were visualized by fluorescence staining. (g) OCR analysis of SIRT3-knockdown cells. (h) mRNA levels of Runx2, Osterix, ALP, and BSP from SIRT3-knockdown cells that were differentiated for 2 days. (i) ARS and ALP staining of SIRT3-knockdown cells that were differentiated for 7 days. (j) mRNA levels of osteogenic markers in SIRT3-knockdown cells after differentiation for 2 days with or without NAC. (k) mRNA levels of osteogenic markers in SOD2-knockdown cells after differentiation for 2 days with or without NAC. Data are presented as the mean±S.E.M. from at least three independent experiments. *P<0.05, **P<0.01 versus relative control
Figure 6
Figure 6
Decreased bone mass in Sirt3−/− mice. (a) Micro-CT images of the femurs of wild-type (Sirt3+/+) and SIRT3-knockout (Sirt3−/−) mice. In the analysis of the trabecular bone and architecture, the following parameters were calculated: (b) bone volume per tissue volume (BV/TV); (c) trabecular thickness (Tb.Th); (d) trabecular number (Tb.N); (e) trabecular spacing (Tb.Sp); (f) bone surface to bone volume (BS/BV); (g) structure model index (SMI); (h) connectivity density; and (i) bone mineral content (BMC). Data are presented as the means±S.E.M.; n=6 per group. *P<0.05, **P<0.01 versus relative control
Figure 7
Figure 7
Serum and histochemical analyses of osteoblast function in Sirt3−/− mice. Serum was collected from wild-type and Sirt3−/− mice, and the levels of the following factors were analyzed: (a) bone alkaline phosphatase (BAP); (b) osteocalcin (OC); (c) procollagen type I N-terminal propeptide (P1NP); (d) parathyroid hormone (PTH); (e) calcium; (f) phosphate; (g) 25(OH)D3; (h) tartrate-resistant acid phosphatase 5b (TRACP-5b); and (i) osteoprotegerin (OPG). (j) Femur sections were prepared from wild-type and Sirt3−/− mice at 8 weeks and immunostained with an anti-Runx2 antibody and an ALP staining kit. Data are presented as the means±S.E.M.; n=6 per group. **P<0.01 versus relative control
Figure 8
Figure 8
Reestablishing the SIRT3/SOD2 axis improves primary Sirt3−/− osteoblast function. Calvaria-derived primary osteoblasts were isolated from neonatal wild-type and Sirt3−/− mice, and the (a) protein contents of SIRT3 and SOD2, (b) SOD2 activity, and (c) ROS content were analyzed. (d) ALP activity of primary osteoblasts after differentiation for 2 days. (e) SIRT3 adenovirus was applied to Sirt3−/− primary osteoblasts, and the protein contents of complexes I and III were analyzed by western blot. (f) ROS content of primary osteoblasts infected with SIRT3 adenovirus. (g) ALP activity of primary osteoblasts infected with SIRT3 adenovirus and after differentiation for 2 days. (h) ROS content of primary osteoblasts infected with SOD2 adenovirus. (i) ALP activity of primary osteoblasts infected with SOD2 adenovirus and after differentiation for 2 days. (j) ARS staining of primary osteoblasts infected with SIRT3 and SOD2 adenovirus after 7 days of differentiation. Data are presented as the mean±S.E.M. from at least three independent experiments. *P<0.05, **P<0.01 versus relative control

References

    1. Long F. Building strong bones: molecular regulation of the osteoblast lineage. Nat Rev Mol Cell Biol 2011; 13: 27–38. - PubMed
    1. Croucher PI, McDonald MM, Martin TJ. Bone metastasis: the importance of the neighbourhood. Nat Rev Cancer 2016; 16: 373–386. - PubMed
    1. Kassem M, Bianco P. Skeletal stem cells in space and time. Cell 2015; 160: 17–19. - PubMed
    1. Kain KH, Popov VL, Herzog NK. Alterations in mitochondria and mtTFA in response to LPS-induced differentiation of B-cells. Bioch Biophys Acta 2000; 1494: 91–103. - PubMed
    1. San Martin N, Cervera AM, Cordova C, Covarello D, McCreath KJ, Galvez BG. Mitochondria determine the differentiation potential of cardiac mesoangioblasts. Stem Cells 2011; 29: 1064–1074. - PubMed