

Cherubism Mice Also Deficient in c-Fos Exhibit Inflammatory Bone Destruction Executed by Macrophages That Express MMP14 Despite the Absence of TRAP+ Osteoclasts
- PMID: 28914985
- PMCID: PMC5771992
- DOI: 10.1002/jbmr.3295
Cherubism Mice Also Deficient in c-Fos Exhibit Inflammatory Bone Destruction Executed by Macrophages That Express MMP14 Despite the Absence of TRAP+ Osteoclasts
Abstract
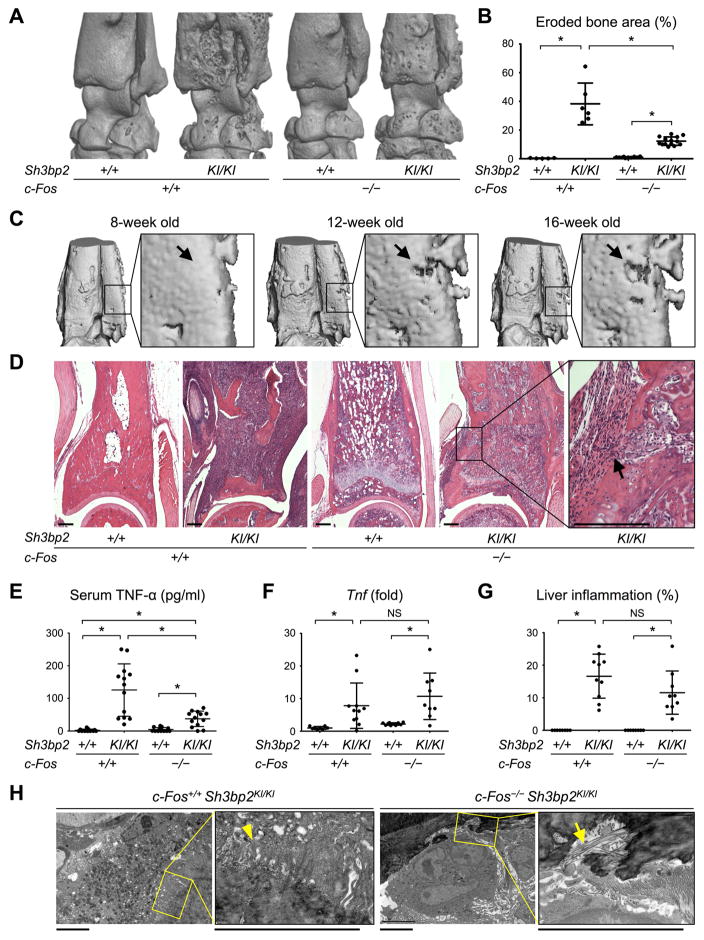
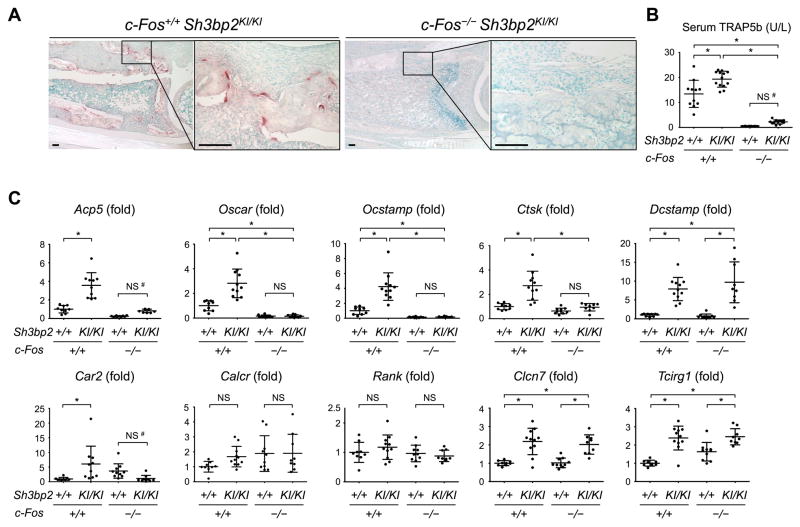
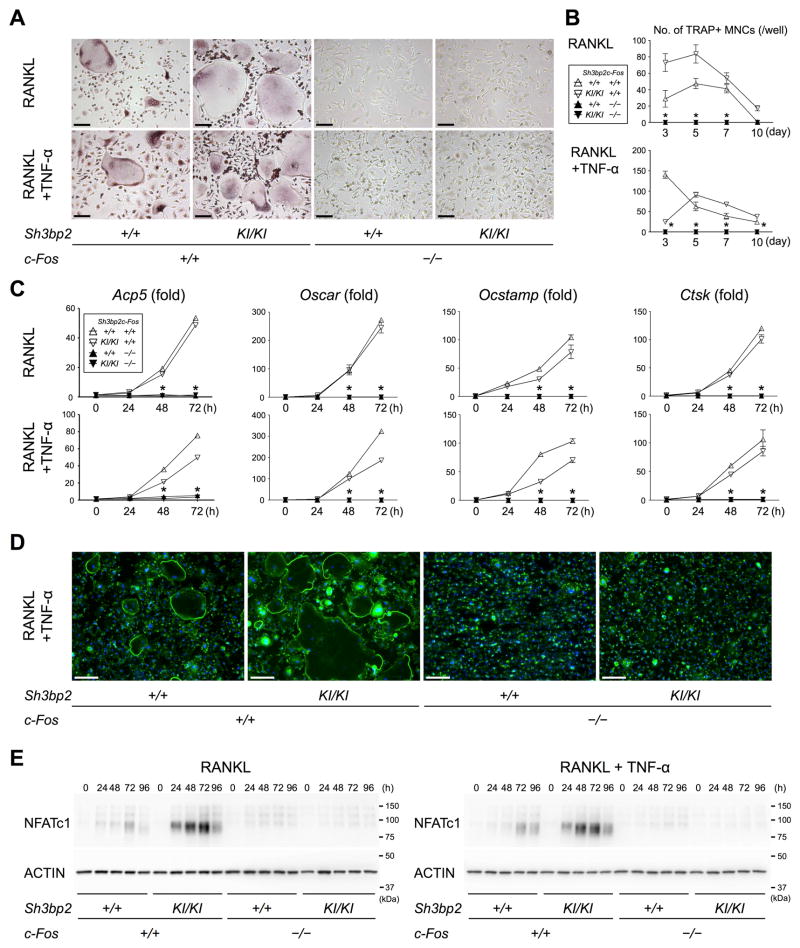
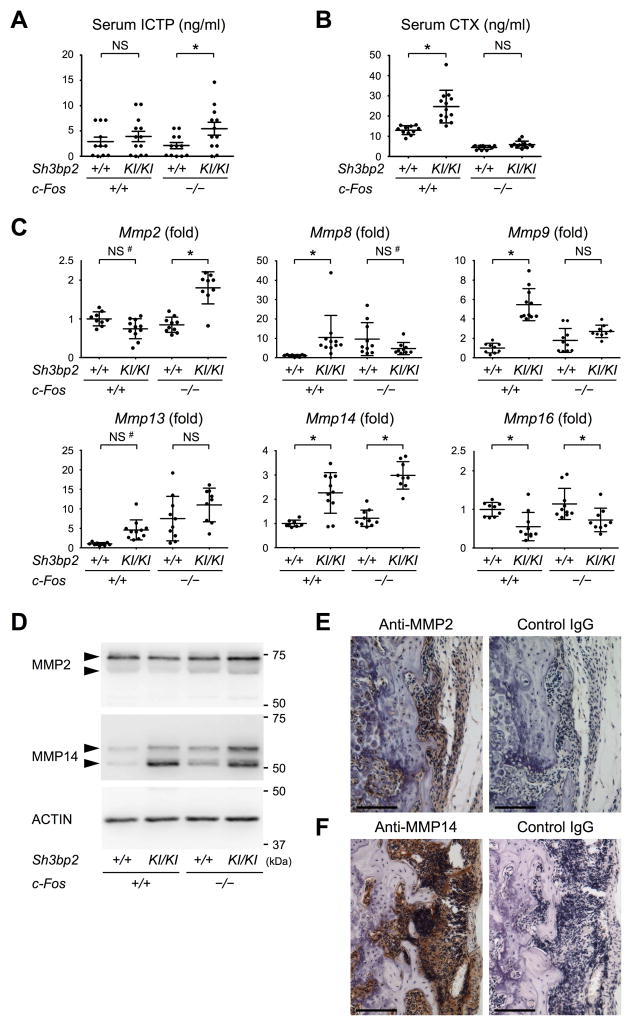
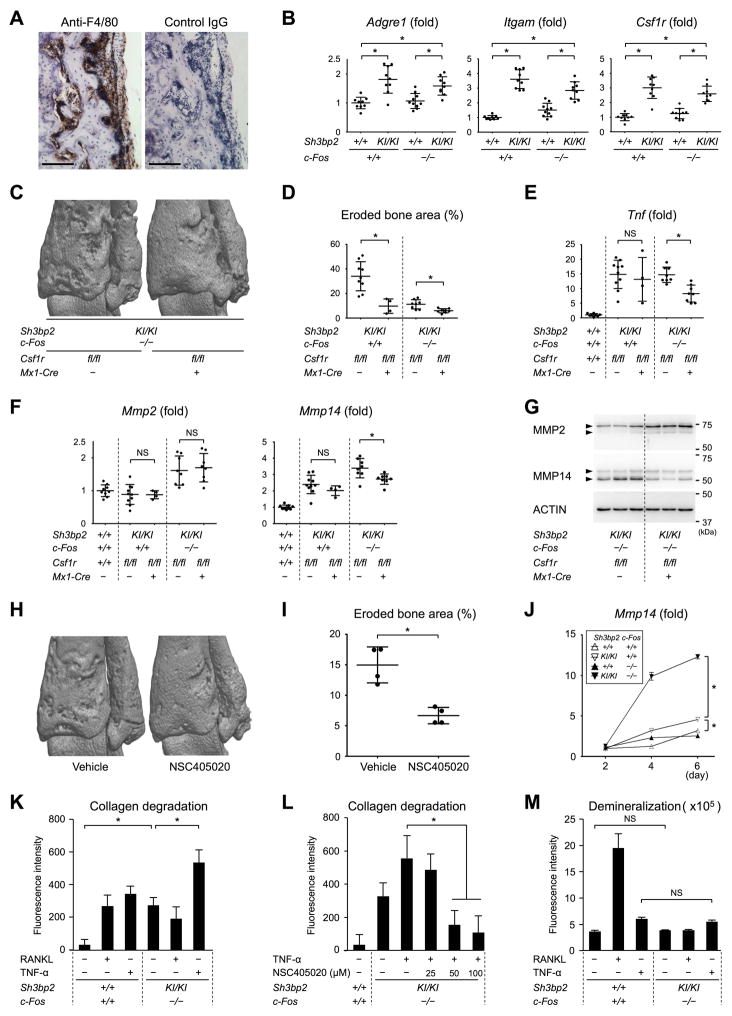
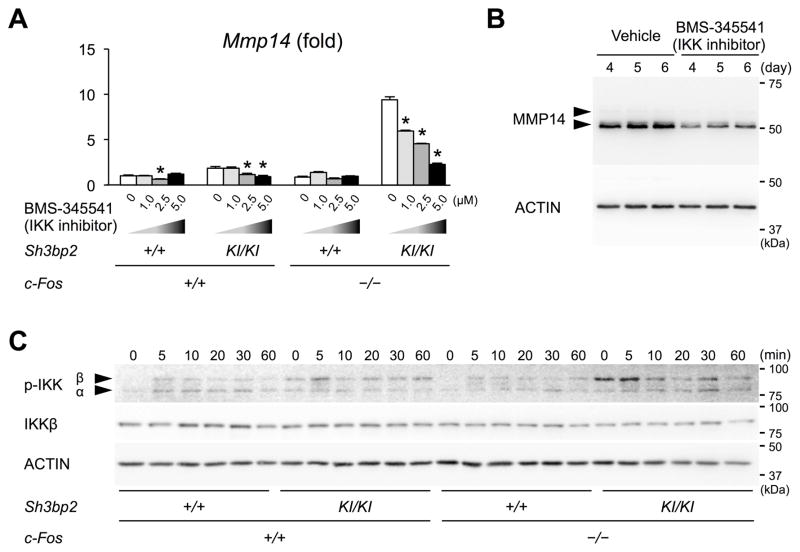
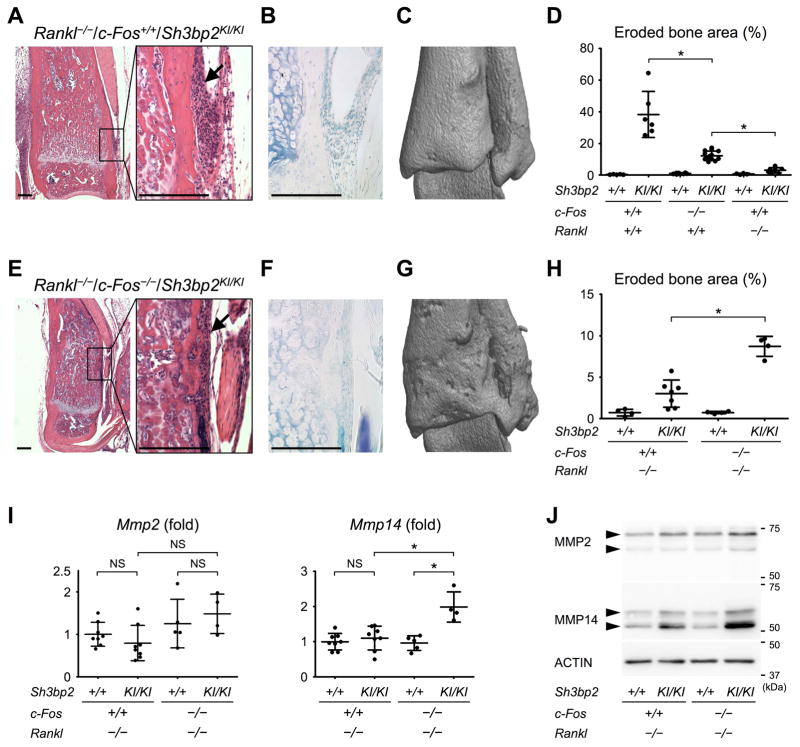
Currently, it is believed that osteoclasts positive for tartrate-resistant acid phosphatase (TRAP+) are the exclusive bone-resorbing cells responsible for focal bone destruction in inflammatory arthritis. Recently, a mouse model of cherubism (Sh3bp2KI/KI ) with a homozygous gain-of-function mutation in the SH3-domain binding protein 2 (SH3BP2) was shown to develop auto-inflammatory joint destruction. Here, we demonstrate that Sh3bp2KI/KI mice also deficient in the FBJ osteosarcoma oncogene (c-Fos) still exhibit noticeable bone erosion at the distal tibia even in the absence of osteoclasts at 12 weeks old. Levels of serum collagen I C-terminal telopeptide (ICTP), a marker of bone resorption generated by matrix metalloproteinases (MMPs), were elevated, whereas levels of serum cross-linked C-telopeptide (CTX), another resorption marker produced by cathepsin K, were not increased. Collagenolytic MMP levels were increased in the inflamed joints of the Sh3bp2KI/KI mice deficient in c-Fos. Resorption pits contained a large number of F4/80+ macrophages and genetic depletion of macrophages rescued these erosive changes. Importantly, administration of NSC405020, an MMP14 inhibitor targeted to the hemopexin (PEX) domain, suppressed bone erosion in c-Fos-deficient Sh3bp2KI/KI mice. After activation of the NF-κB pathway, macrophage colony-stimulating factor (M-CSF)-dependent macrophages from c-Fos-deficient Sh3bp2KI/KI mice expressed increased amounts of MMP14 compared with wild-type macrophages. Interestingly, receptor activator of NF-κB ligand (RANKL)-deficient Sh3bp2KI/KI mice failed to show notable bone erosion, whereas c-Fos deletion did restore bone erosion to the RANKL-deficient Sh3bp2KI/KI mice, suggesting that osteolytic transformation of macrophages requires both loss-of-function of c-Fos and gain-of-function of SH3BP2 in this model. These data provide the first genetic evidence that cells other than osteoclasts can cause focal bone destruction in inflammatory bone disease and suggest that MMP14 is a key mediator conferring pathological bone-resorbing capacity on c-Fos-deficient Sh3bp2KI/KI macrophages. In summary, the paradigm that osteoclasts are the exclusive cells executing inflammatory bone destruction may need to be reevaluated based on our findings with c-Fos-deficient cherubism mice lacking osteoclasts. © 2017 American Society for Bone and Mineral Research.
Keywords: C-FOS; CHERUBISM; MMP14; NON-CANONICAL OSTEOCLASTS/OSTEOLYTIC MACROPHAGES; OSTEOCLAST-INDEPENDENT INFLAMMATORY BONE DESTRUCTION; SH3BP2.
© 2017 American Society for Bone and Mineral Research.
Conflict of interest statement
The authors have declared that no conflict of interest exists.
Figures
Similar articles
-
SH3BP2 cherubism mutation potentiates TNF-α-induced osteoclastogenesis via NFATc1 and TNF-α-mediated inflammatory bone loss.J Bone Miner Res. 2014 Dec;29(12):2618-35. doi: 10.1002/jbmr.2295. J Bone Miner Res. 2014. PMID: 24916406 Free PMC article.
-
Increased myeloid cell responses to M-CSF and RANKL cause bone loss and inflammation in SH3BP2 "cherubism" mice.Cell. 2007 Jan 12;128(1):71-83. doi: 10.1016/j.cell.2006.10.047. Cell. 2007. PMID: 17218256
-
Second-Generation SYK Inhibitor Entospletinib Ameliorates Fully Established Inflammation and Bone Destruction in the Cherubism Mouse Model.J Bone Miner Res. 2018 Aug;33(8):1513-1519. doi: 10.1002/jbmr.3449. Epub 2018 May 22. J Bone Miner Res. 2018. PMID: 29669173 Free PMC article.
-
The Role of Rosavin in the Pathophysiology of Bone Metabolism.Int J Mol Sci. 2024 Feb 9;25(4):2117. doi: 10.3390/ijms25042117. Int J Mol Sci. 2024. PMID: 38396794 Free PMC article. Review.
-
The role of SH3BP2 in the pathophysiology of cherubism.Orphanet J Rare Dis. 2012 May 24;7 Suppl 1(Suppl 1):S5. doi: 10.1186/1750-1172-7-S1-S5. Epub 2012 May 24. Orphanet J Rare Dis. 2012. PMID: 22640988 Free PMC article. Review.
Cited by
-
Sh3bp2 Gain-Of-Function Mutation Ameliorates Lupus Phenotypes in B6.MRL-Faslpr Mice.Cells. 2019 Apr 30;8(5):402. doi: 10.3390/cells8050402. Cells. 2019. PMID: 31052273 Free PMC article.
-
Roles of osteoclasts in alveolar bone remodeling.Genesis. 2022 Sep;60(8-9):e23490. doi: 10.1002/dvg.23490. Epub 2022 Jun 27. Genesis. 2022. PMID: 35757898 Free PMC article. Review.
-
Brain Plasticity and Cell Competition: Immediate Early Genes Are the Focus.Cells. 2025 Jan 19;14(2):143. doi: 10.3390/cells14020143. Cells. 2025. PMID: 39851571 Free PMC article. Review.
-
Septin2 mediates podosome maturation and endothelial cell invasion associated with angiogenesis.J Cell Biol. 2020 Feb 3;219(2):e201903023. doi: 10.1083/jcb.201903023. J Cell Biol. 2020. PMID: 31865373 Free PMC article.
-
Tankyrase (PARP5) Inhibition Induces Bone Loss through Accumulation of Its Substrate SH3BP2.Cells. 2019 Feb 22;8(2):195. doi: 10.3390/cells8020195. Cells. 2019. PMID: 30813388 Free PMC article. Review.
References
-
- Teitelbaum SL, Tondravi MM, Ross FP. Osteoclasts, macrophages, and the molecular mechanisms of bone resorption. J Leukoc Biol. 1997;61(4):381–8. - PubMed
-
- Takayanagi H. Osteoimmunology: shared mechanisms and crosstalk between the immune and bone systems. Nat Rev Immunol. 2007;7(4):292–304. - PubMed
-
- Takayanagi H. Osteoimmunology and the effects of the immune system on bone. Nat Rev Rheumatol. 2009;5(12):667–76. - PubMed
-
- Takayanagi H, Kim S, Koga T, Nishina H, Isshiki M, Yoshida H, et al. Induction and activation of the transcription factor NFATc1 (NFAT2) integrate RANKL signaling in terminal differentiation of osteoclasts. Dev Cell. 2002;3(6):889–901. - PubMed
Publication types
MeSH terms
Substances
Grants and funding
LinkOut - more resources
Full Text Sources
Other Literature Sources
Molecular Biology Databases
Research Materials
