. 2018 Feb;58(2):216-231.
doi: 10.1165/rcmb.2016-0186OC.

Targeting Hypoxia-Inducible Factor-1α/Pyruvate Dehydrogenase Kinase 1 Axis by Dichloroacetate Suppresses Bleomycin-induced Pulmonary Fibrosis

Affiliations

Targeting Hypoxia-Inducible Factor-1α/Pyruvate Dehydrogenase Kinase 1 Axis by Dichloroacetate Suppresses Bleomycin-induced Pulmonary Fibrosis

Justin Goodwin et al. Am J Respir Cell Mol Biol. 2018 Feb.

Abstract

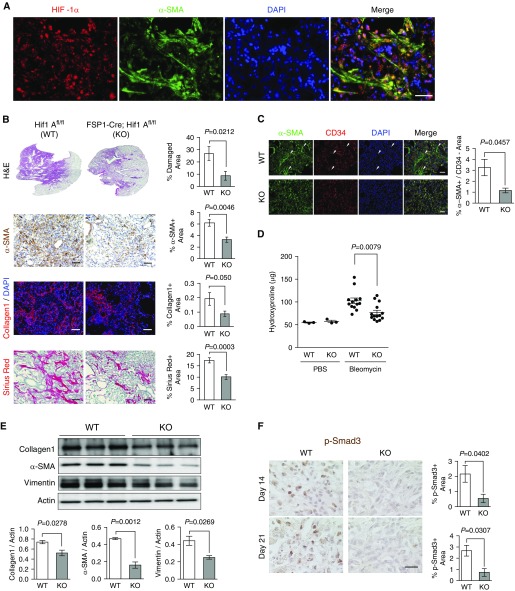
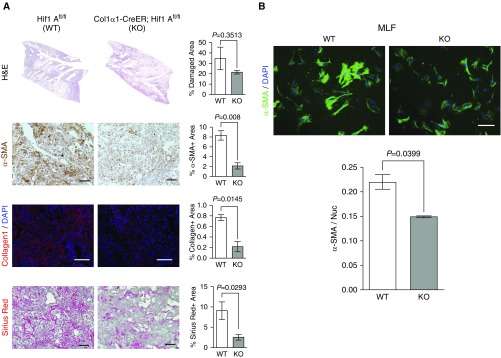
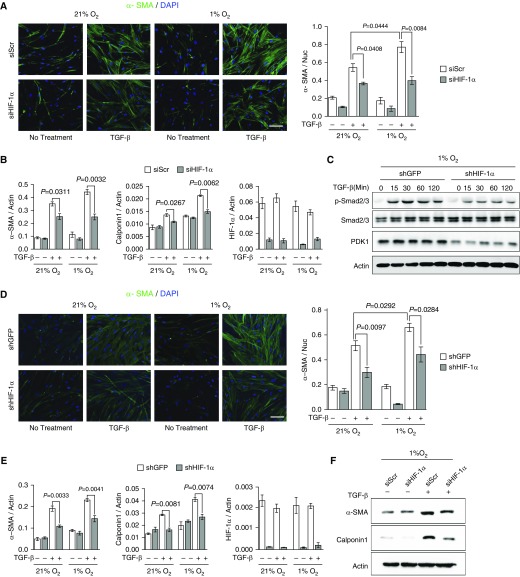
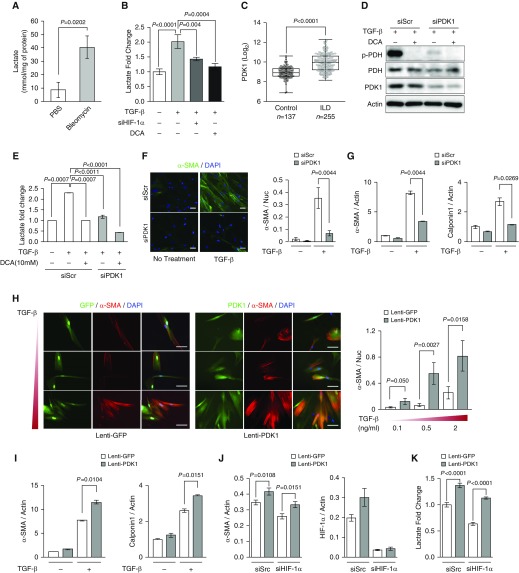
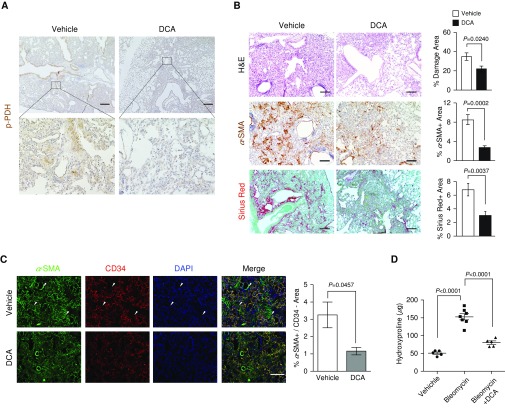
Hypoxia has long been implicated in the pathogenesis of fibrotic diseases. Aberrantly activated myofibroblasts are the primary pathological driver of fibrotic progression, yet how various microenvironmental influences, such as hypoxia, contribute to their sustained activation and differentiation is poorly understood. As a defining feature of hypoxia is its impact on cellular metabolism, we sought to investigate how hypoxia-induced metabolic reprogramming affects myofibroblast differentiation and fibrotic progression, and to test the preclinical efficacy of targeting glycolytic metabolism for the treatment of pulmonary fibrosis. Bleomycin-induced pulmonary fibrotic progression was evaluated in two independent, fibroblast-specific, promoter-driven, hypoxia-inducible factor (Hif) 1A knockout mouse models and in glycolytic inhibitor, dichloroacetate-treated mice. Genetic and pharmacological approaches were used to explicate the role of metabolic reprogramming in myofibroblast differentiation. Hypoxia significantly enhanced transforming growth factor-β-induced myofibroblast differentiation through HIF-1α, whereas overexpression of the critical HIF-1α-mediated glycolytic switch, pyruvate dehydrogenase kinase 1 (PDK1) was sufficient to activate glycolysis and potentiate myofibroblast differentiation, even in the absence of HIF-1α. Inhibition of the HIF-1α/PDK1 axis by genomic deletion of Hif1A or pharmacological inhibition of PDK1 significantly attenuated bleomycin-induced pulmonary fibrosis. Our findings suggest that HIF-1α/PDK1-mediated glycolytic reprogramming is a critical metabolic alteration that acts to promote myofibroblast differentiation and fibrotic progression, and demonstrate that targeting glycolytic metabolism may prove to be a potential therapeutic strategy for the treatment of pulmonary fibrosis.

Keywords: dichloroacetate; fibroblasts; hypoxia inducible factor-1α; pulmonary fibrosis; pyruvate dehydrogenase kinase1.


Figures

Figure 1.
Figure 1.
Fibroblast-specific protein (FSP) 1–driven fibroblast hypoxia-inducible factor (Hif) 1A ablation attenuates pulmonary fibrosis. (A) Representative immunofluorescent images of colocalized HIF-1α (red) and α-smooth muscle actin (α-SMA; green) in bleomycin-induced fibrotic lung tissues. (B) Representative images and quantification of wild-type (WT; Hif1Afl/fl) and FSP1-driven, Cre recombinase (Cre)-mediated, fibroblast-specific Hif1A knockout (KO; FSP1-Cre; Hif1Afl/fl) composite hematoxylin and eosin (H&E) montage images of whole lung lobes, α-SMA immunohistochemistry (IHC), immunofluorescent collagen, and Sirius red staining (n = 6–8 per group, 10–15 images per mouse were captured for quantification). (C) Representative images of α-SMA (green) and CD34 (red) double-immunofluorescent staining and quantification of α-SMA+/CD34 areas in WT (n = 5) and fibroblast-specific Hif1A KO mice (n = 3, 8–10 images per mouse were captured for quantification). Arrowheads indicate α-SMA+/CD34 areas. (D) Lung hydroxyproline content of WT and fibroblast Hif1A KO mice treated with PBS or bleomycin (n = 3 per PBS-treated group, n = 14 per bleomycin-treated group). (E) Western blot analysis and quantification of lung collagen (Col) 1, α-SMA, and vimentin expression in WT and fibroblast Hif1A KO mice treated with bleomycin (n = 3 per group). (F) Representative images and quantification of phosphorylated (p)-Smad3 IHC in WT and fibroblast Hif1A KO mice 14 days (n = 4 per group) and 21 days (n = 3 per group) after bleomycin treatment. Scale bar: 25 μm. All other scale bars: 100 μm. Error bars represent the mean (±SEM). Two-tailed t test.
Figure 2.
Figure 2.
Col1α1-CreER–driven fibroblast Hif1A ablation attenuates pulmonary fibrosis. (A) Representative images and quantification of WT (Hif1Afl/fl) and Col1α1-CreER–driven, fibroblast-specific Hif1A KO (Col1α1-CreER; Hif1Afl/fl) composite H&E montage images of whole lung lobes, α-SMA IHC, immunofluorescent Col1, and Sirius red staining (n = 3–4 per group, 8–12 images per mouse were captured for quantification). (B) Representative immunocytochemistry and quantification of α-SMA in primary mouse lung fibroblasts isolated from WT and fibroblast Hif1A KO mice (n = 3 per group, 6–8 images per mouse were captured for quantification). Scale bars: 100 μm. Error bars represent the mean (±SEM). Two-tailed t test. MLF = mouse lung fibroblasts.
Figure 3.
Figure 3.
HIF-1α knockdown inhibits transforming growth factor (TGF)-β–induced myofibroblast differentiation. (A) Representative immunocytochemistry and quantification of α-SMA in small interfering (si) Scramble (Scr) and siHIF-1α fibroblasts derived from patients with idiopathic pulmonary fibrosis cultured in 21 and 1% O2 and treated with 2 ng/ml TGF-β for 72 hours (n = 8 from four biologically independent experiments, five to six images were captured per group and normalized to nuclei for quantification). (B) Quantitative RT-PCR (qRT-PCR) analysis of α-SMA, calponin1, and HIF-1α mRNA expression in siScr and siHIF-1α idiopathic pulmonary fibroblasts (IPFs) cultured in 21 and 1% O2 and treated with 2 ng/ml TGF-β for 72 hours (n = 6 from three biologically independent experiments). (C) Western blot analysis of p-Smad2/3, total Smad2/3, and pyruvate dehydrogenase kinase (PDK) 1 expression in small hairpin (sh) GFP and shHIF-1α human lung fibroblasts (HLFs) cultured in 1% O2 and treated with 5 ng/ml TGF-β (0–120 min). These results were observed in three independent experiments. (D) Representative immunocytochemistry and quantification of α-SMA in shGFP and shHIF-1α HLFs cultured in 21 and 1% O2 and treated with 2 ng/ml TGF-β for 72 hours (n = 8 from four biologically independent experiments, five to six images were captured per group and normalized to nuclei for quantification). (E) qRT-PCR analysis of α-SMA, calponin1, and HIF-1α mRNA expression in shGFP and shHIF-1α HLFs cultured in 21 and 1% O2 and treated with 2 ng/ml TGF-β for 72 hours (n = 6 from three biologically independent experiments). (F) Western blot analysis of α-SMA and calponin1 expression in siScr and siHIF-1α HLFs cultured in 1% O2 and treated with 2 ng/ml TGF-β for 72 hours. These results were observed in three independent experiments. Scale bars: 100 μm. Error bars represent the mean (±SEM). One-way ANOVA with multiple comparison, post hoc.
Figure 4.
Figure 4.
PDK1 promotes myofibroblast differentiation. (A) Lactate concentration of lung tissue from PBS- and bleomycin-treated mice (n = 4 per group). Two-tailed t test. (B) Extracellular lactate measurement in siScr or siHIF-1α IPFs treated with TGF-β or TGF-β + dichloroacetate (DCA; n = 6 from three biologically independent experiments). IPFs were treated with 2 ng/ml TGF-β and 10 mM DCA for 72 hours. (C) Microarray gene profile analysis of PDK1 expression between control subjects (n = 137) and patients with interstitial lung disease (ILD; n = 255), derived from the Lung Genomics Research Consortium database. Mann-Whitney U test. (D) Western blot analysis of p-pyruvate dehydrogenase (PDH), total PDH, and PDK1 expression in siScr and siPDK1 HLFs treated with 5 ng/ml TGF-β and 10 mM DCA for 24 hours. These results were observed from three independent experiments. (E) Extracellular lactate measurement in siScr or siPDK1 HLFs treated with TGF-β or TGF-β + DCA (n = 6 from three biologically independent experiments). IPFs were treated with 2 ng/ml TGF-β and 10 mM DCA for 48 hours. (F) Representative immunocytochemistry and quantification of α-SMA in siScr and siPDK1 HLFs treated with 2 ng/ml TGF-β for 72 hours (n = 6 from three biologically independent experiments, 5–10 images were captured per group and normalized to nuclei for quantification). Two-tailed t test. (G) qRT-PCR analysis of α-SMA and calponin1 mRNA expression in siScr and siPDK1 HLFs treated with 2 ng/ml TGF-β for 72 hours (n = 4 from two biologically independent experiments). Two-tailed t test. (H) Representative immunocytochemistry and quantification of α-SMA in lentivirus (lenti)-GFP and lenti-PDK1 HLFs treated with the indicated TGF-β concentrations for 72 hours (n = 6 from three biologically independent experiments, 5–10 images were captured per group and normalized to nuclei for quantification). (I) qRT-PCR analysis of α-SMA and calponin1 mRNA expression in lenti-GFP and lenti-PDK1 HLFs treated with 2 ng/ml TGF-β for 72 hours (n = 4 from two biologically independent experiments). Two-tailed t test. (J) qRT-PCR analysis of α-SMA and HIF-1α expression in siScr/lenti-GFP or lenti-PDK1, and siHIF-1α/lenti-GFP or lenti-PDK1 HLFs treated with 2 ng/ml TGF-β for 72 hours (n = 8 from four biologically independent experiments). (K) Extracellular lactate measurement in siScr/lenti-GFP or lenti-PDK1, and siHIF-1α/lenti-GFP or lenti-PDK1 HLFs treated with 2 ng/ml TGF-β for 72 hours (n = 8 from four biologically independent experiments). Scale bars: 100 μm. Error bars represent the mean (±SEM). One-way ANOVA with multiple comparison, post hoc, unless otherwise noted.
Figure 5.
Figure 5.
DCA inhibits TGF-β–induced myofibroblast differentiation. (A) Extracellular lactate measurement in siScr or siHIF-1α HLFs treated with TGF-β or TGF-β + DCA (n = 6 from three biologically independent experiments). HLFs were treated with 5 ng/ml TGF-β and 10 mM DCA for 48 hours. (B) Metabolic flux analysis of oxygen consumption rate (OCR) and extracellular acidification rate (ECAR) in IPFs treated with 2 ng/ml TGF-β for 48 hours (n = 6 from two biologically independent experiments). IPFs were glucose starved for 2 hours before the assay and then treated sequentially with 10 mM glucose, 10 mM DCA, and 20 mM DCA. (C) Representative immunocytochemistry and quantification of α-SMA in control and DCA-treated IPFs cultured in 21 and 1% O2 and treated with 2 ng/ml TGF-β and 10 or 20 mM DCA for 72 hours (n = 8 from four biologically independent experiments, five to six images were captured per group and normalized to nuclei for quantification). (D) qRT-PCR analysis of α-SMA and calponin1 mRNA expression in control and DCA-treated IPFs cultured in 21 and 1% O2 and treated with 2 ng/ml TGF-β and 10 or 20 mM DCA for 72 hours (n = 6 from three biologically independent experiments). (E) Western blot analysis of p-Smad2/3, p-extracellular signal-regulated kinase (ERK) 1/2, and p-PDH expression in control and DCA-treated HLFs treated with 2 ng/ml TGF-β with or without 10 mM DCA for 1 hour. These results were observed in three independent experiments. N.S. = nonspecific band. (F) Representative immunocytochemistry and quantification of α-SMA in control and DCA-treated HLFs cultured in 1% O2 and treated with 2 ng/ml TGF-β and 10 or 20 mM DCA for 72 hours (n = 6 from three biologically independent experiments, five images were captured per group and normalized to nuclei for quantification). (G) qRT-PCR analysis of α-SMA mRNA expression in control and DCA-treated IPFs cultured in 1% O2 and treated with 2 ng/ml TGF-β and 1–20 mM DCA for 72 hours (n = 6 from three biologically independent experiments). Scale bars: 100 μm. Error bars represent the mean (±SEM). One-way ANOVA with multiple comparison, post hoc.
Figure 6.
Figure 6.
DCA suppresses bleomycin-induced pulmonary fibrosis. (A) Representative IHC images of p-PDH in bleomycin-induced pulmonary fibrotic mice treated with vehicle or DCA. Scale bars, 500 μm (inset, 100 μm). (B) Representative images and quantification of H&E, α-SMA IHC, and Sirius red staining in bleomycin-administered mice treated ad libitum with vehicle (n = 7) or 1.5 g/L DCA containing water (n = 8, 8–10 images per mouse were captured for quantification). Two-tailed t test. (C) Representative images of α-SMA (green) and CD34 (red) double-immunofluorescent staining and quantification of α-SMA+/CD34 areas in vehicle- and DCA-treated mice (n = 3–5, 8–10 images per mouse were captured for quantification). Arrowheads indicate α-SMA+/CD34 areas. Two-tailed t test. (D) Lung hydroxyproline content of PBS-treated or bleomycin-induced pulmonary fibrotic mice treated ad libitum with vehicle or 1.5 g/L DCA containing water (n = 5 PBS-treated group, n = 7 bleomycin-treated group, n = 5 DCA-treated group). (E) Western blot analysis and quantification of lung Col1, α-SMA, and vimentin expression in PBS-treated or bleomycin-induced pulmonary fibrotic mice treated ad libitum with vehicle or 1.5 g/L DCA containing water (n = 3 per group). (F) qRT-PCR analysis of Col1, α-SMA, and calponin1 mRNA expression in PBS-treated or bleomycin-induced pulmonary fibrotic mice treated ad libitum with vehicle or 1.5 g/L DCA containing water (n = 6 per group). (G) Representative images and quantification of p-Smad3 IHC in bleomycin-induced pulmonary fibrotic mice treated ad libitum with vehicle or 1.5 g/L DCA containing water (n = 3 per group). Scale bar: 25 μm. Two-tailed t test. (H) qRT-PCR analysis of TNF-α, IL-1β, and CCL2 mRNA expression from BAL of PBS-treated or bleomycin-induced pulmonary fibrotic mice treated ad libitum with water containing vehicle or 1.5 g/L DCA for 14 days (n = 3 per group). Scale bars: 100 μm unless otherwise noted. Error bars represent the mean (±SEM). One-way ANOVA with multiple comparison, post hoc, unless otherwise noted.
Figure 6.
Figure 6.
DCA suppresses bleomycin-induced pulmonary fibrosis. (A) Representative IHC images of p-PDH in bleomycin-induced pulmonary fibrotic mice treated with vehicle or DCA. Scale bars, 500 μm (inset, 100 μm). (B) Representative images and quantification of H&E, α-SMA IHC, and Sirius red staining in bleomycin-administered mice treated ad libitum with vehicle (n = 7) or 1.5 g/L DCA containing water (n = 8, 8–10 images per mouse were captured for quantification). Two-tailed t test. (C) Representative images of α-SMA (green) and CD34 (red) double-immunofluorescent staining and quantification of α-SMA+/CD34 areas in vehicle- and DCA-treated mice (n = 3–5, 8–10 images per mouse were captured for quantification). Arrowheads indicate α-SMA+/CD34 areas. Two-tailed t test. (D) Lung hydroxyproline content of PBS-treated or bleomycin-induced pulmonary fibrotic mice treated ad libitum with vehicle or 1.5 g/L DCA containing water (n = 5 PBS-treated group, n = 7 bleomycin-treated group, n = 5 DCA-treated group). (E) Western blot analysis and quantification of lung Col1, α-SMA, and vimentin expression in PBS-treated or bleomycin-induced pulmonary fibrotic mice treated ad libitum with vehicle or 1.5 g/L DCA containing water (n = 3 per group). (F) qRT-PCR analysis of Col1, α-SMA, and calponin1 mRNA expression in PBS-treated or bleomycin-induced pulmonary fibrotic mice treated ad libitum with vehicle or 1.5 g/L DCA containing water (n = 6 per group). (G) Representative images and quantification of p-Smad3 IHC in bleomycin-induced pulmonary fibrotic mice treated ad libitum with vehicle or 1.5 g/L DCA containing water (n = 3 per group). Scale bar: 25 μm. Two-tailed t test. (H) qRT-PCR analysis of TNF-α, IL-1β, and CCL2 mRNA expression from BAL of PBS-treated or bleomycin-induced pulmonary fibrotic mice treated ad libitum with water containing vehicle or 1.5 g/L DCA for 14 days (n = 3 per group). Scale bars: 100 μm unless otherwise noted. Error bars represent the mean (±SEM). One-way ANOVA with multiple comparison, post hoc, unless otherwise noted.

Similar articles

Cited by

References

    1. American Thoracic Society: idiopathic pulmonary fibrosis: diagnosis and treatment. International consensus statement. American Thoracic Society (ATS), and the European Respiratory Society (ERS) Am J Respir Crit Care Med. 2000;161:646–664. - PubMed
    1. American Thoracic Society; European Respiratory Society. American Thoracic Society/European Respiratory Society international multidisciplinary consensus classification of the idiopathic interstitial pneumonias. This joint statement of the American Thoracic Society (ATS), and the European Respiratory Society (ERS) was adopted by the ATS board of directors, June 2001 and by the ERS Executive Committee, June 2001. Am J Respir Crit Care Med. 2002;165:277–304. - PubMed
    1. Wynn TA. Integrating mechanisms of pulmonary fibrosis. J Exp Med. 2011;208:1339–1350. - PMC - PubMed
    1. Barkauskas CE, Noble PW. Cellular mechanisms of tissue fibrosis. 7. New insights into the cellular mechanisms of pulmonary fibrosis. Am J Physiol Cell Physiol. 2014;306:C987–C996. - PMC - PubMed
    1. Todd NW, Luzina IG, Atamas SP. Molecular and cellular mechanisms of pulmonary fibrosis. Fibrogenesis Tissue Repair. 2012;5:11. - PMC - PubMed

Publication types

MeSH terms

Substances