. 2017 Sep 15;12(9):e0183662.
doi: 10.1371/journal.pone.0183662. eCollection 2017.

Inflammatory cytokine production in tumor cells upon chemotherapy drug exposure or upon selection for drug resistance

Affiliations

Inflammatory cytokine production in tumor cells upon chemotherapy drug exposure or upon selection for drug resistance

Derek W Edwardson et al. PLoS One. .

Abstract

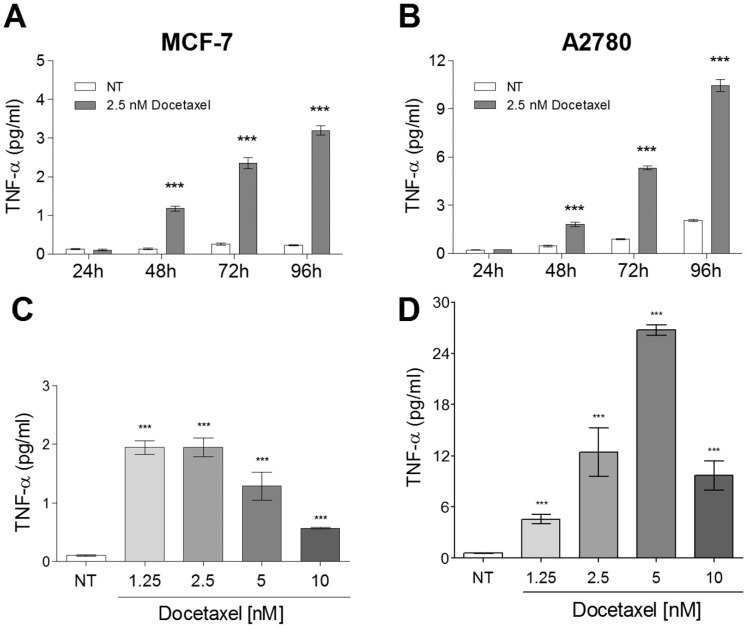
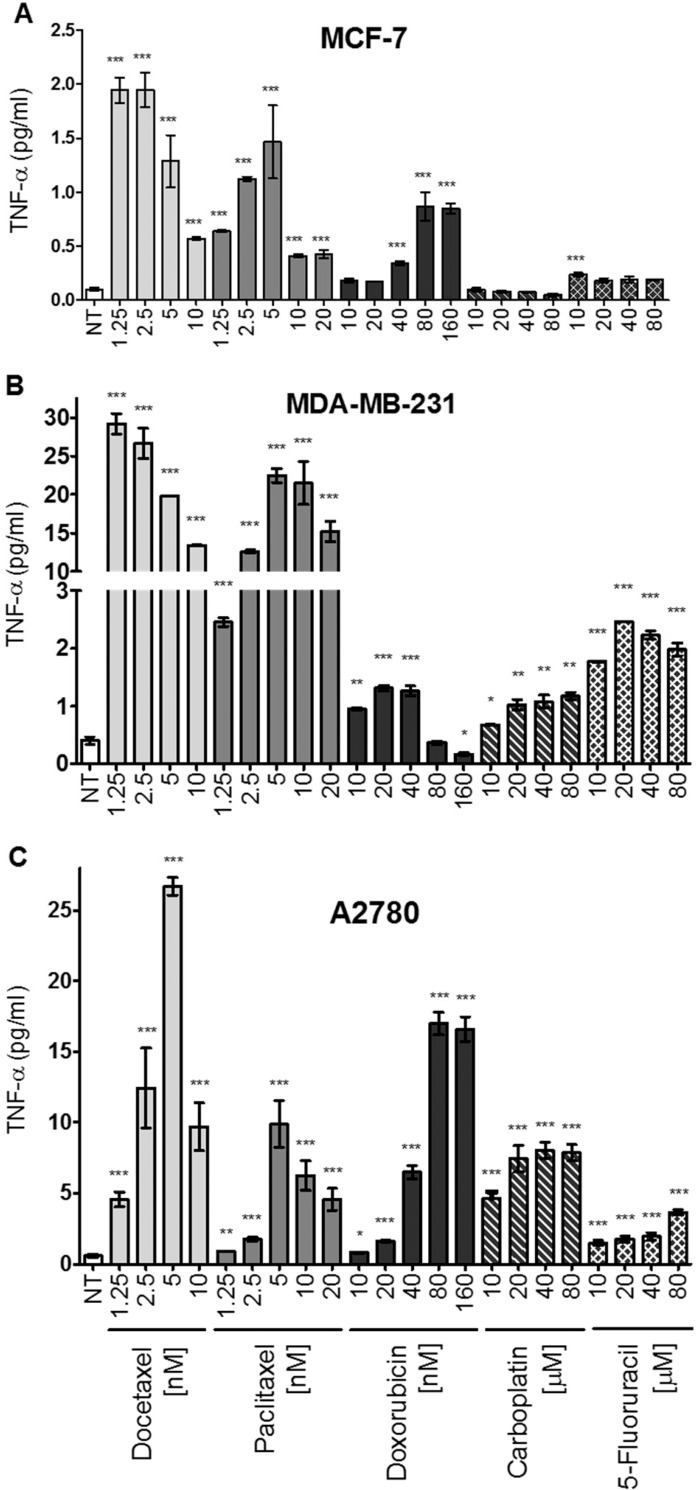
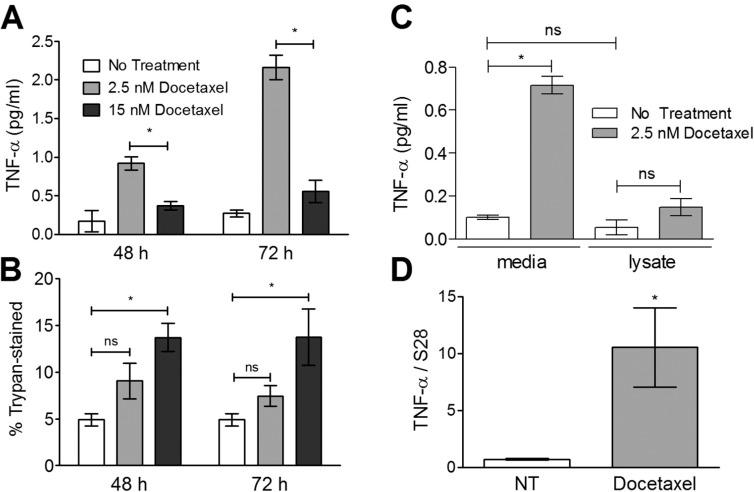
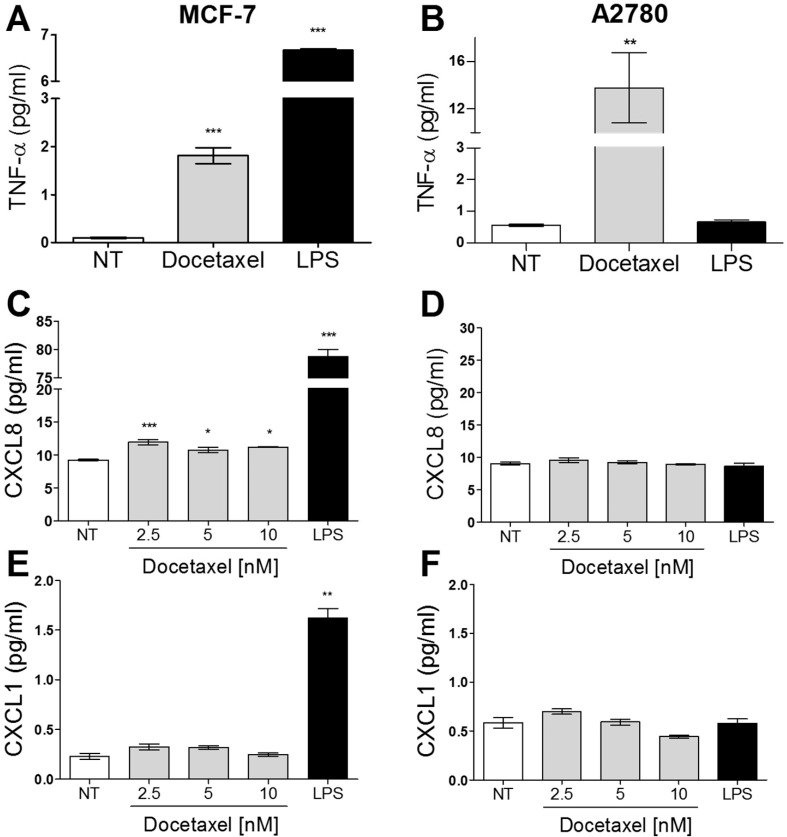
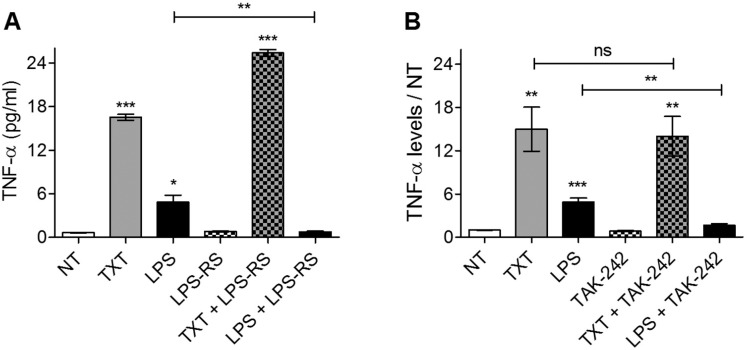
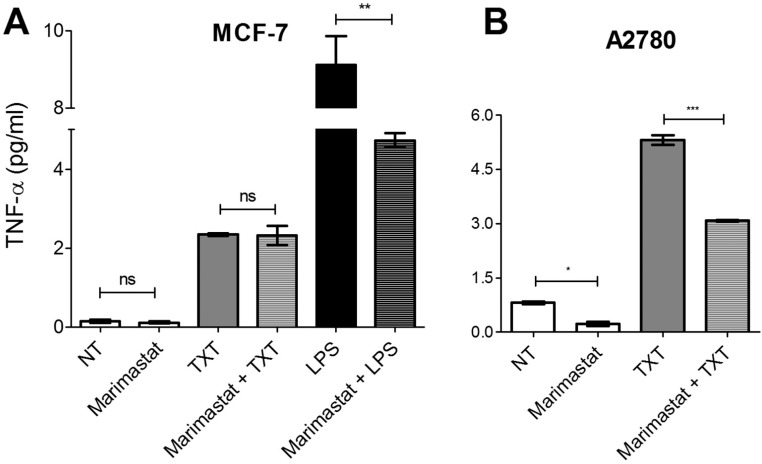
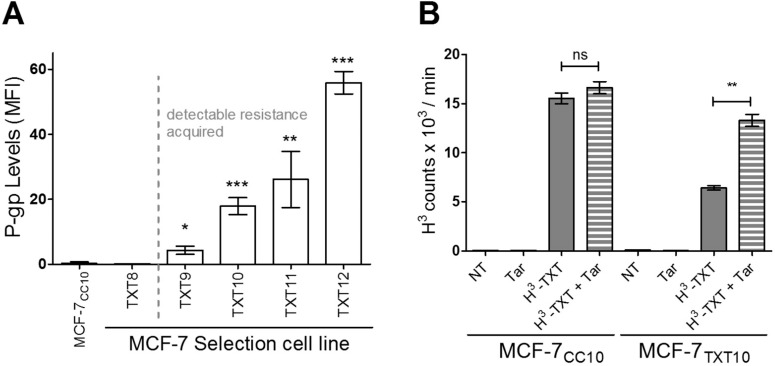
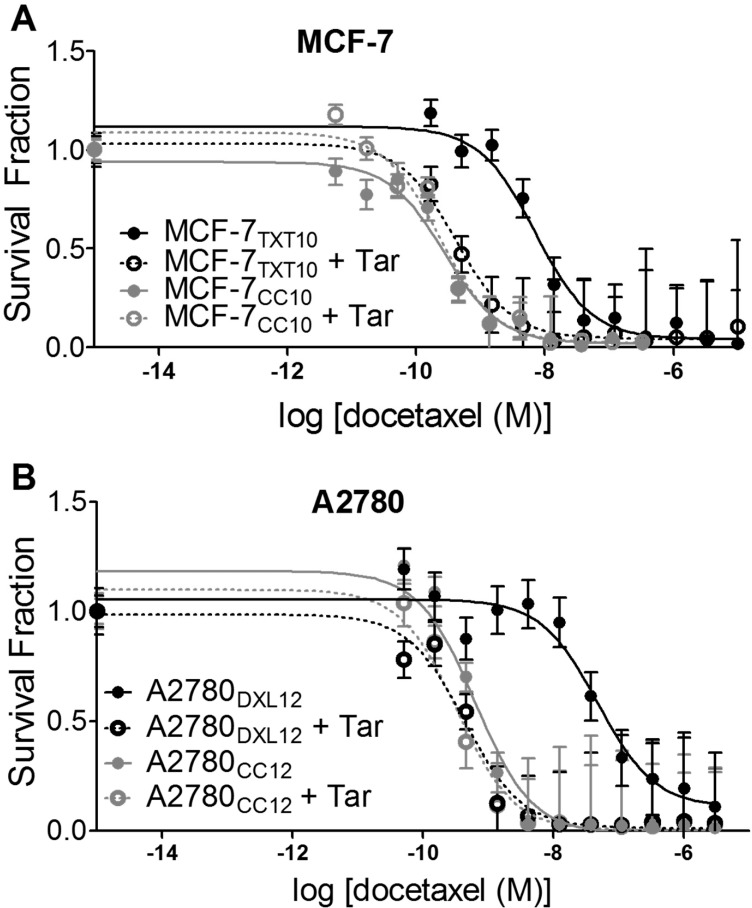
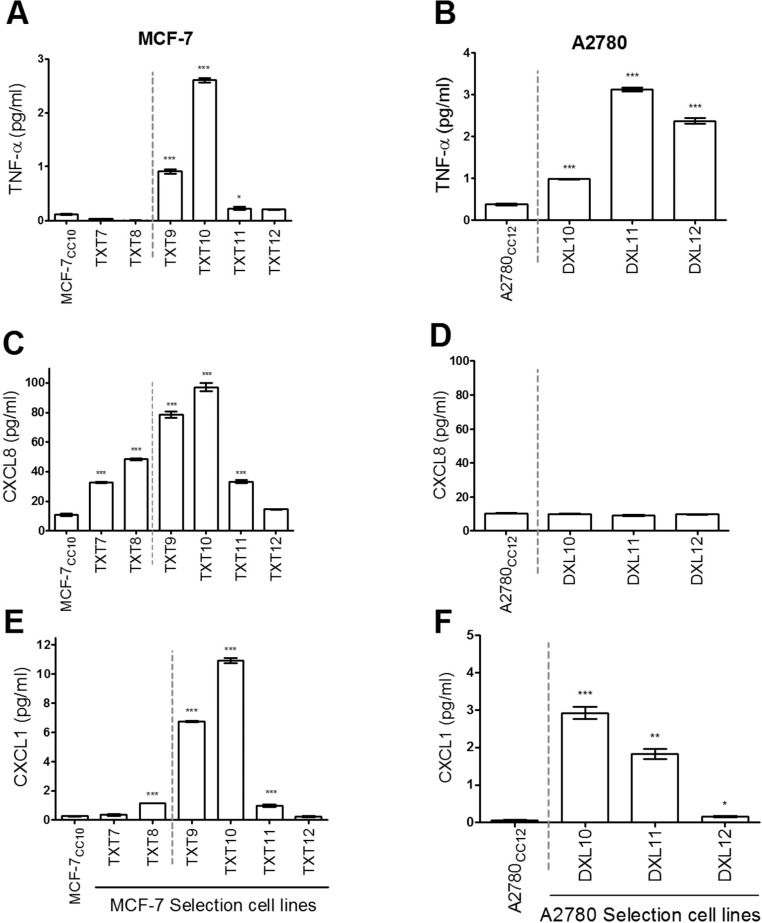
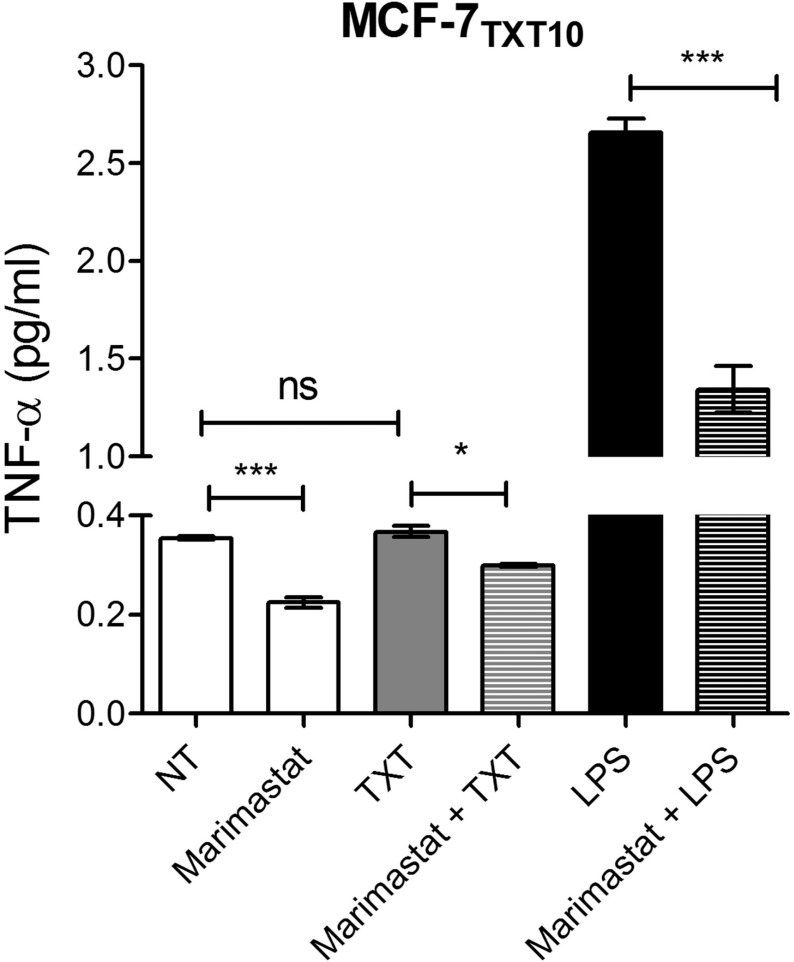
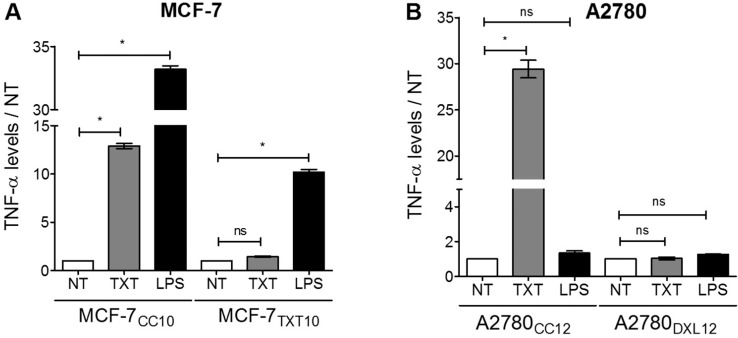
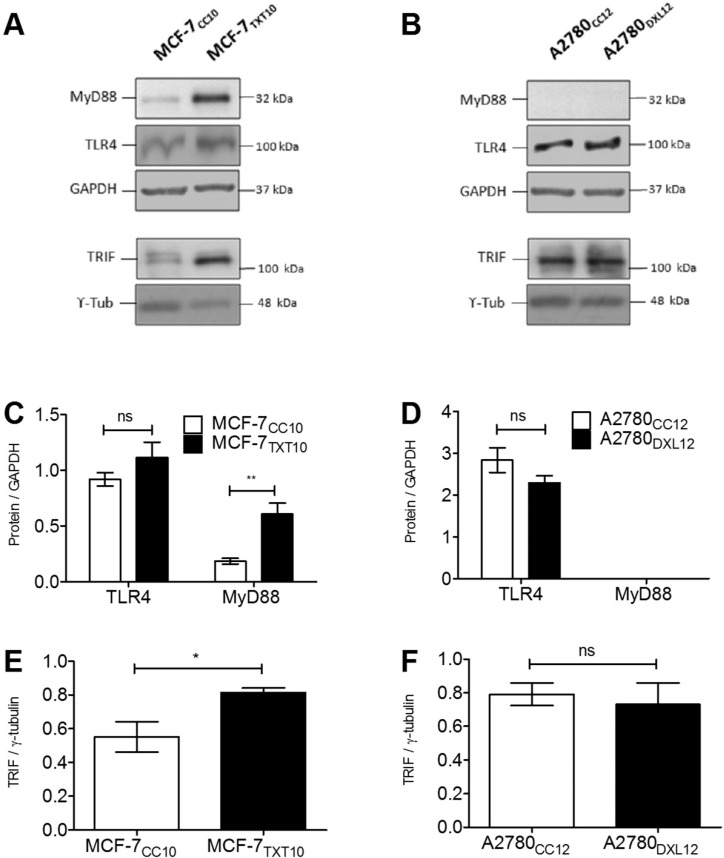
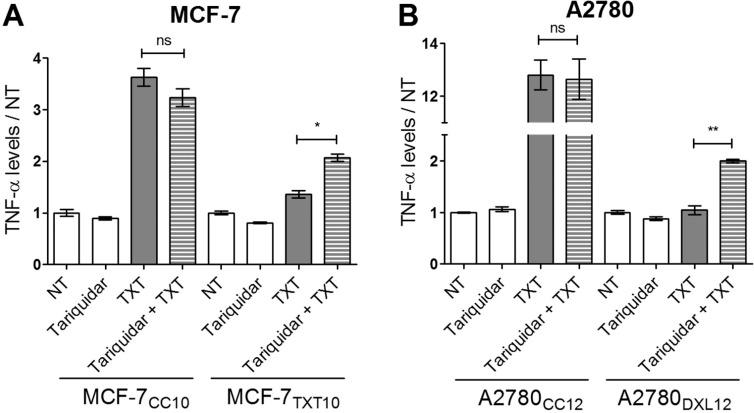
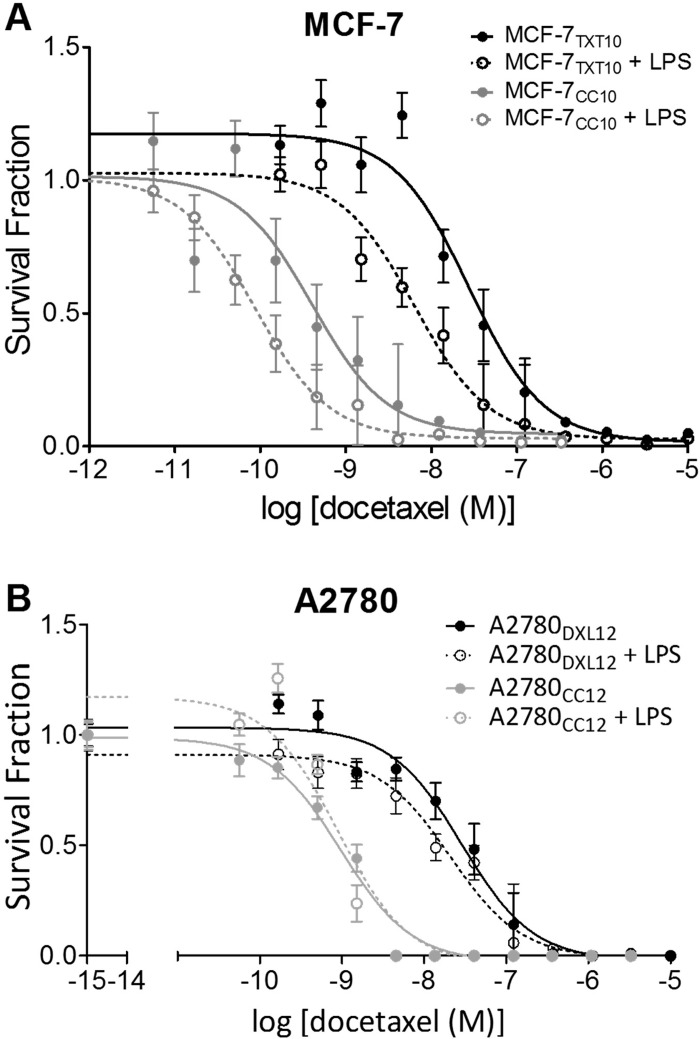
Tumor Necrosis Factor alpha (TNF-α) has been shown to be released by tumor cells in response to docetaxel, and lipopolysaccharides (LPS), the latter through activation of toll-like receptor 4 (TLR4). However, it is unclear whether the former involves TLR4 receptor activation through direct binding of the drug to TLR4 at the cell surface. The current study was intended to better understand drug-induced TNF-α production in tumor cells, whether from short-term drug exposure or in cells selected for drug resistance. ELISAs were employed to measure cytokine release from breast and ovarian tumor cells in response to several structurally distinct chemotherapy agents and/or TLR4 agonists or antagonists. Drug uptake and drug sensitivity studies were also performed. We observed that several drugs induced TNF-αrelease from multiple tumor cell lines. Docetaxel-induced cytokine production was distinct from that of LPS in both MyD88-positive (MCF-7) and MyD88-deficient (A2780) cells. The acquisition of docetaxel resistance was accompanied by increased constitutive production of TNF-αand CXCL1, which waned at higher levels of resistance. In docetaxel-resistant MCF-7 and A2780 cell lines, the production of TNF-α could not be significantly augmented by docetaxel without the inhibition of P-gp, a transporter protein that promotes drug efflux from tumor cells. Pretreatment of tumor cells with LPS sensitized MyD88-positive cells (but not MyD88-deficient) to docetaxel cytotoxicity in both drug-naive and drug-resistant cells. Our findings suggest that taxane-induced inflammatory cytokine production from tumor cells depends on the duration of exposure, requires cellular drug-accumulation, and is distinct from the LPS response seen in breast tumor cells. Also, stimulation of the LPS-induced pathway may be an attractive target for treatment of drug-resistant disease.


Conflict of interest statement

Competing Interests: Dr. Amadeo Parissenti and Dr. Jason Sprowl filed a patent application related to this investigation, but have since abandoned the patent application.

Figures

Fig 1
Fig 1. Docetaxel-induced TNF-α levels in media of breast and ovarian tumor cells are dose- and time-dependent.
A) and B) Effects of treatment time on TNF-α release by 2.5 nM docetaxel from MCF-7 and A2780 cells; C) and D) Effects of docetaxel concentration on TNF-α release in breast and ovarian cancer cell lines over 72 hours. The data represents the mean of three replicates (+ SEM). The significance of differences in secreted TNF-α levels between treated and untreated (NT) cells was assessed using a two-tailed T-test;*** p<0.0001.
Fig 2
Fig 2. Increased TNF-α levels induced in select tumor cell lines by a variety of chemotherapeutic drugs.
Soluble TNF-α levels in the media were measured by ELISA after 72 hr of treatment with either docetaxel, paclitaxel, doxorubicin, carboplatin, or 5-FU. Drug concentrations tested were based on IC50 values previously determined experimentally in MCF-7 cells. The data represents the mean of three replicates (+/-SEM). The significance of differences in TNF-α levels between treated and untreated cells was assessed using a two-tailed T-test; *** p<0.0001, **p<0.001, *p<0.05.
Fig 3
Fig 3. TNF-α release does not correlate with loss of membrane integrity.
Cells were treated for 48 or 72 hours with one of two concentrations of docetaxel and the level of TNF-α in the media was measured (A) as well as the number of trypan-positive cells (B). The significance of differences in TNF-α levels or loss of membrane integrity were assessed using a 2-way ANOVA with a Tukey post-test. Cells were also lysed under hypotonic conditions and media levels of TNF-α from lysed and non-lysed were measured using an ELISA (C). TNF-α mRNA levels were also determined by quantitative PCR using cDNA generated from RNA extracts after 36 hours of docetaxel treatment. In these studies the significance of differences in TNF-α transcript levels between preparations was measured using an unpaired, two-tailed T-test; * p<0.05. All data represent the mean of three replicates (+/-SEM).
Fig 4
Fig 4. Media cytokine profiles for tumor cells after LPS or docetaxel exposure.
The levels of TNF-α (A and B), CXCL8 (C and D), and CXCL1 (E and F) in cell media of either MCF-7 (A, C and E) or A2780 (B, D and F) cells were measured by ELISA after 72 hours of LPS or docetaxel treatment. The data represents the mean of three replicates (+/-SEM). All treatments were 10 μg/ml and 2.5 nM for LPS and docetaxel, respectively; The significance of differences in TNF-α levels between treated and untreated cells were determined using a two-tailed T-test; *** for p<0.0001, ** for p<0.01, and * for p<0.01.
Fig 5
Fig 5. The effect of TLR4 inhibition on secreted TNF-α levels induced by docetaxel or LPS.
MDA-MB-231 cells were treated for 72 hours with either 2.5 nM docetaxel (TXT) or 0.1 μg/ml LPS, after pretreatment with either 100 μg/ml LPS-RS (A) or 0.1 μg/ml TAK-242 (B). The data represent the mean of three replicates (+/-SEM). The significance of differences between treated and untreated cells were assessed using a two-tailed T-test; ***p<0.001, **p<0.01, *p<0.02.
Fig 6
Fig 6. The effect of MMP inhibition by Marimastat on cellular TNF-α levels.
MCF-7 and A2780 cells were treated with 2.5 nM docetaxel (TXT) or 10 μg/ml LPS for 72 hours in the presence or absence of 200 nM Marimastat, a broad-spectrum MMP inhibitor. The data represent the mean of three replicates (+/-SEM). The significance of differences in TNF-α levels between treatments was assessed using a two-tailed T-test; *** p<0.0001, ** p<0.001, *p<0.01.
Fig 7
Fig 7. Increased P-gp levels are associated with diminished drug uptake in drug-resistant MCF-7 cells.
(A) Flow cytometry was used to assess P-gp levels [as expressed by mean fluorescence intensity (MFI) values] for MCF-7 cells at selection doses 8, 9, 10, 11, and 12. (B) Docetaxel-resistant MCF-7TXT10 cells exhibited decreased intracellular drug accumulation, which was restored with the addition of Tariquidar (Tar), an allosteric inhibitor of P-gp. Tritiated docetaxel (H3-TXT) was administered at a concentration of 2.5 nM, either with or without 100 nM Tariquidar for 12 hours and docetaxel uptake was determined by measuring the radioactivity of cells. All data represents the mean of 3 replicates (+/-SEM). Two-tailed T-tests were employed to assess the significance of differences in docetaxel uptake between the various treatments in the control (MCF-7CC10) and docetaxel-resistant (MCF-7TXT10) cell lines; *** for p<0.0001, **p<0.001, and * for p<0.01.
Fig 8
Fig 8. Sensitivity to docetaxel is restored upon inhibition of P-gp activity with Tariquidar (Tar).
(A) Clonogenic assays yielded IC50 values for docetaxel in MCF-7CC10 cells of 0.28 nM and 0.24 nM, with and without 100 nM Tariquidar, respectively. IC50 values for MCF-7TXT10 cells were significantly different with (0.42 nM) and without (7.14 nM) Tariquidar, respectively (p<0.0001). (B) An identical trend was observed for the A2780CC12 (IC50 = 0.630 nM) and A2780DXL12 (IC50 = 47.5 nM) cell lines, where in the presence of Tariquidar IC50 values were 0.331 nM and 0.435 nM, respectively. Each data point represents the mean number of colonies (+/-SEM) in twelve independent microscopic fields. Each experiment was replicated three times with consistent trends. Non-linear regression analysis was used to compare the significance of difference in IC50 values between Tariquidar-treated and untreated conditions.
Fig 9
Fig 9. Basal cytokine production changes during selection for resistance to docetaxel.
Levels of TNF-α (A and B), CXCL8 (C and D), and CXCL1 (E and F) in media as measured by ELISA, from MCF-7 (A, C, and E) and A2780 cells (B, D, and F) after 72 hours of cell culture. Cell lines to the right of the vertical broken grey line exhibit acquired resistance to docetaxel, as confirmed in clonogenic assays. Each value represents the mean of three replicates (+/-SEM). Two-tailed T-tests were used to assess the significance of differences in cytokine levels between docetaxel-selected cell lines and their respective co-cultured control cell lines (MCF-7CC10 or A2780CC12); ***p<0.0001, **p<0.001, *p<0.01.
Fig 10
Fig 10. Effect of Marimastat on TNF-α levels in the medium of MCF-7TXT10 cells.
Cells were treated for 72 hours with media only (NT), 200 nM Marimastat, 2.5 nM docetaxel (TXT), 10 μg/ml LPS, or a combination thereof. The data represents the mean of three replicates (+/-SEM) and the significance of differences in TNF-α levels between treatments was determined using a T-test; *p<0.01, **p<0.001, ***p<0.0001.
Fig 11
Fig 11
Comparing the effects of docetaxel and LPS treatment on TNF-α release from drug-naive and drug-resistant cell lines for MCF-7 (A) and A2780 (B) cells. All docetaxel (TXT) concentrations used were 2.5 nM and LPS concentrations were 5 μg/ml. Comparisons between treated and untreated TNF-α levels were assessed for significance using a one-way ANOVA with a Tukey post-test; * for p<0.05; all data points represent the mean of three trials.
Fig 12
Fig 12. Levels of TLR4 and adaptor proteins during acquisition of resistance to docetaxel.
Immunoblots were performed from extracts of MCF-7 and A2780 drug-naive and drug-resistant cell lines (A and B) in order to confirm the presence or absence of TLR4 and adaptor proteins MyD88 and TRIF. Changes in protein levels of drug-naive and drug-resistant cell lines were assessed by densitometry (C, D, E, and F). Statistical analysis consisted of two-tailed T-tests; *p<0.05.
Fig 13
Fig 13. Effects of Tariquidar on docetaxel-induced TNF-α release.
All treatments lasted 72 hours at which point levels of TNF-α in the media were measured by ELISA for MCF-7 (A) and A2780 (B) cells. Cells were either untreated or treated with 100 nM Tariquidar and/or 2.5 nM docetaxel (TXT). The data are representative of three replicates (+/-SEM). A two-tailed T-test was used to assess the significance of differences in cellular TNF-α production between treatments;** for p<0.001, * for p<0.01.
Fig 14
Fig 14. Effect of LPS exposure on tumor cell sensitivity to docetaxel.
(A) Sensitivity to docetaxel was assessed using the clonogenic assay. MCF-7CC10 cells had an IC50 value for docetaxel of 0.4 nM docetaxel, and when pretreated with 10 μg/ml LPS, the value was reduced to 0.09 nM docetaxel. Likewise, MCF-7TXT10 cells exhibited an IC50 value for docetaxel of 27.6 nM docetaxel, which was reduced to 6.4 nM upon addition of 10 μg/ml LPS. Non-linear regression analysis comparing LPS-treated and LPS-absent curves revealed statistically significant differences in IC50 values (p<0.005). (B) Untreated and LPS-treated A2780CC12 cells both exhibited an IC50 value of 1.0 nM docetaxel. There was no significant difference in the IC50 values for docetaxel between LPS-treated and untreated A2780DXL12 cells (28.7 nM and 21.0 nM, respectively). Each data point is the mean of 12 microscopy field counts and each curve is representative of three replicate experiments, each showing a consistent trend.

Similar articles

Cited by

References

    1. Centers for Disease Control and Prevention n.d. http://www.cdc.gov/cancer/international/statistics.htm (accessed January 7, 2016).
    1. GLOBOCAN 2012: Estimated Cancer Incidence, Mortality and Prevalence Worldwide in 2012 n.d. http://globocan.iarc.fr/Pages/fact_sheets_cancer.aspx (accessed January 7, 2016).
    1. Smith I, Chua S. Medical treatment of early breast cancer. I: adjuvant treatment. BMJ 2006;332:34–7. doi: 10.1136/bmj.332.7532.34 - DOI - PMC - PubMed
    1. Fisher B, Bryant J, Wolmark N, Mamounas E, Brown a, Fisher ER, et al. Effect of preoperative chemotherapy on the outcome of women with operable breast cancer. J Clin Oncol 1998;16:2672–85. doi: 10.1200/JCO.1998.16.8.2672 - DOI - PubMed
    1. Eltahir A, Heys SD, Hutcheon AW, Sarkar TK, Smith I, Walker LG, et al. Treatment of large and locally advanced breast cancers using neoadjuvant chemotherapy. Am J Surg 1998;175:127–32. S0002961097002791 [pii]. - PubMed

MeSH terms