. 2017 Jun 11;8(34):55804-55820.
doi: 10.18632/oncotarget.18437. eCollection 2017 Aug 22.

Resistance to CTLA-4 checkpoint inhibition reversed through selective elimination of granulocytic myeloid cells

Affiliations

Resistance to CTLA-4 checkpoint inhibition reversed through selective elimination of granulocytic myeloid cells

Paul E Clavijo et al. Oncotarget. .

Abstract

Purpose: Local immunosuppression remains a critical problem that limits clinically meaningful response to checkpoint inhibition in patients with head and neck cancer. Here, we assessed the impact of MDSC elimination on responses to CTLA-4 checkpoint inhibition.

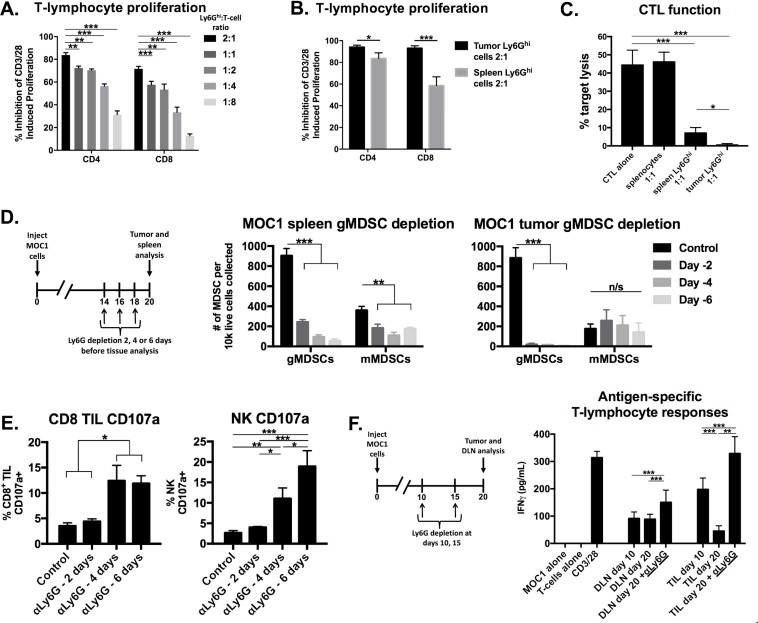
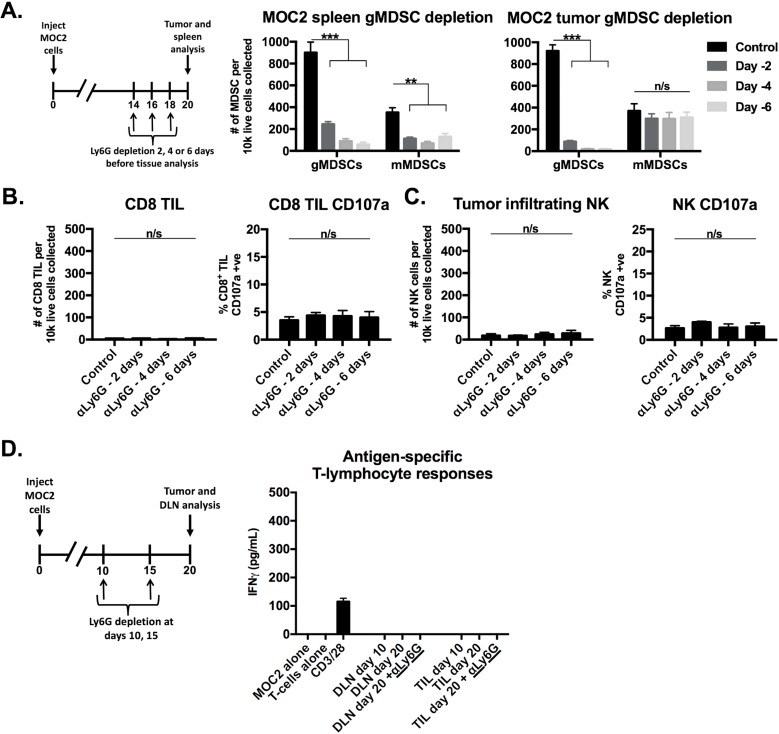
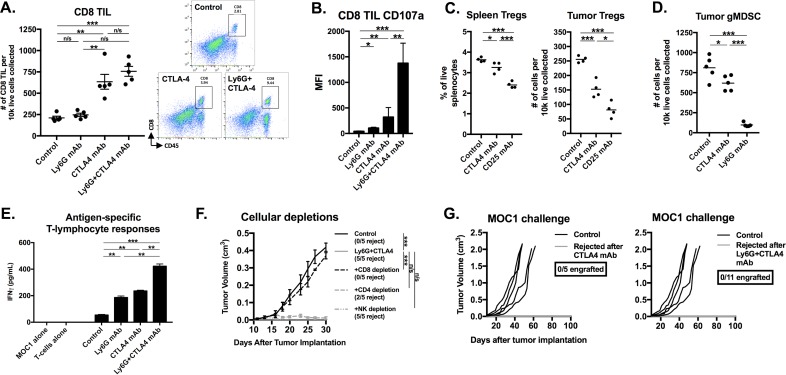
Experimental design: Murine syngeneic carcinoma immune infiltrates were characterized by flow cytometry. Granulocytic MDSCs (gMDSCs) were depleted and T-lymphocyte antigen-specific responses were measured. Tumor-bearing mice were treated with MDSC depletion and CTLA-4 checkpoint blockade. Immune signatures within the human HNSCC datasets from The Cancer Genome Atlas (TCGA) were analyzed and differentially expressed genes from sorted human peripheral MDSCs were examined.

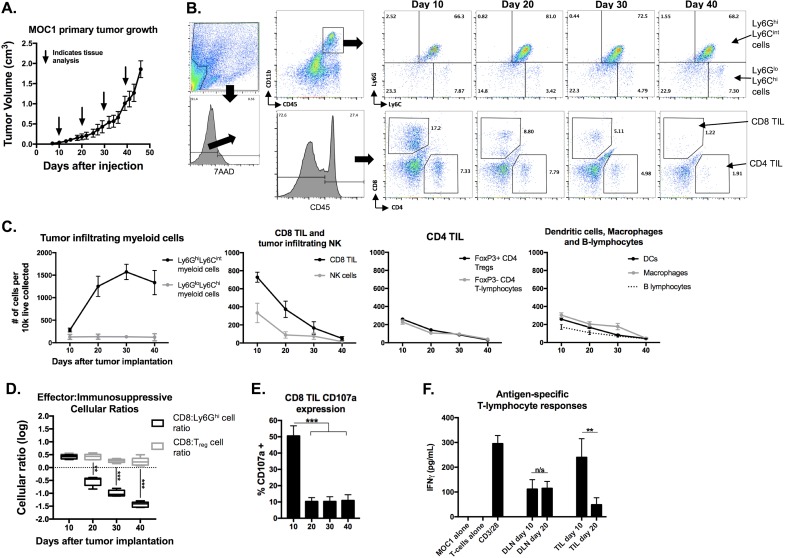
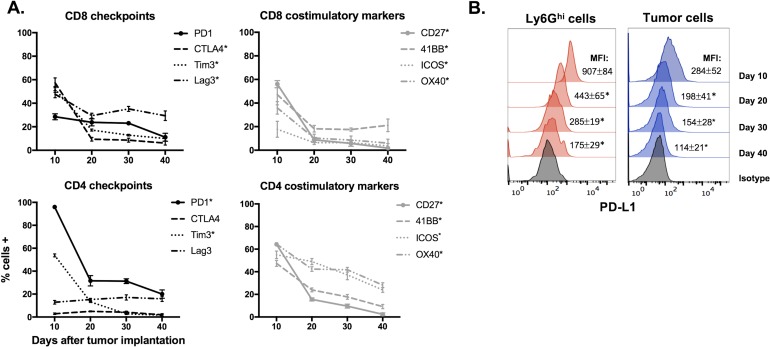
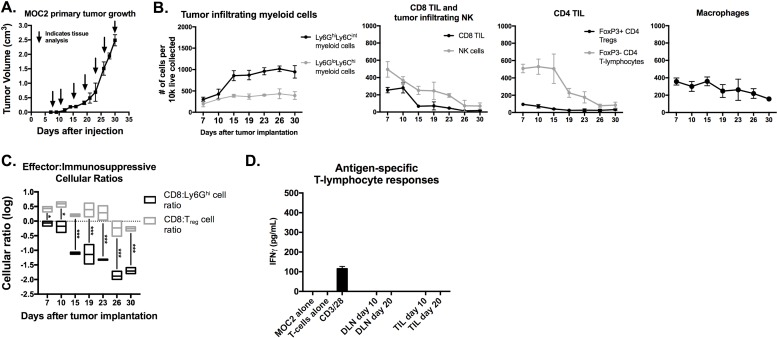
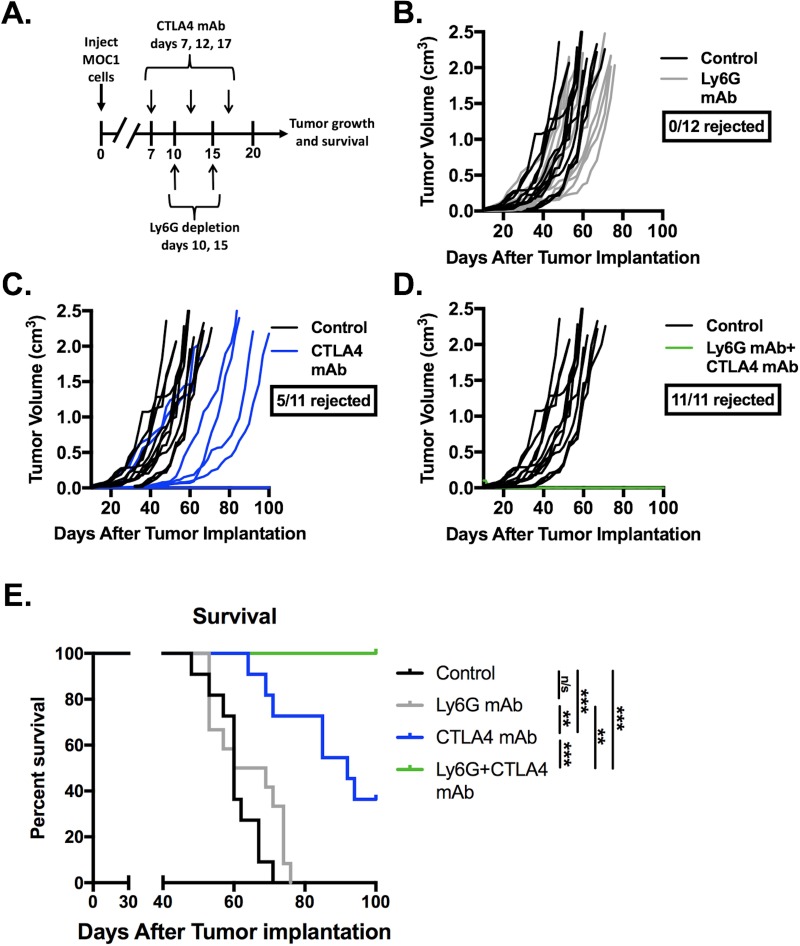
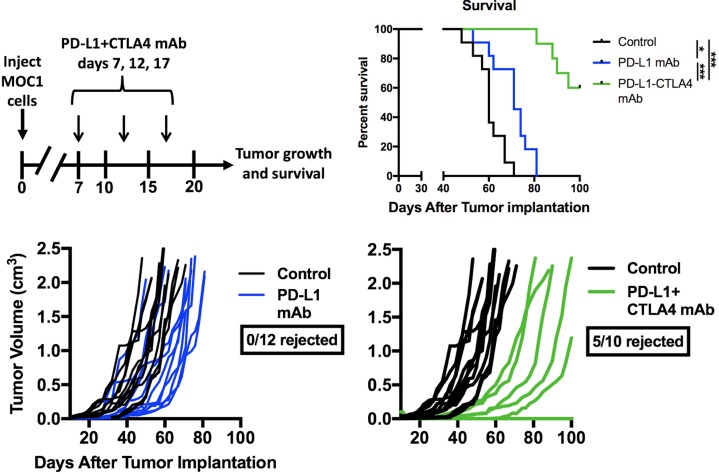
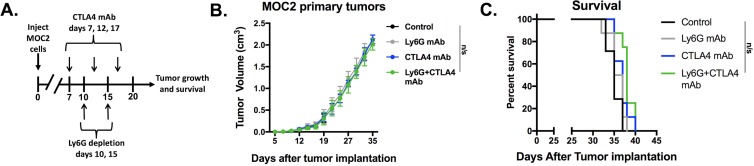
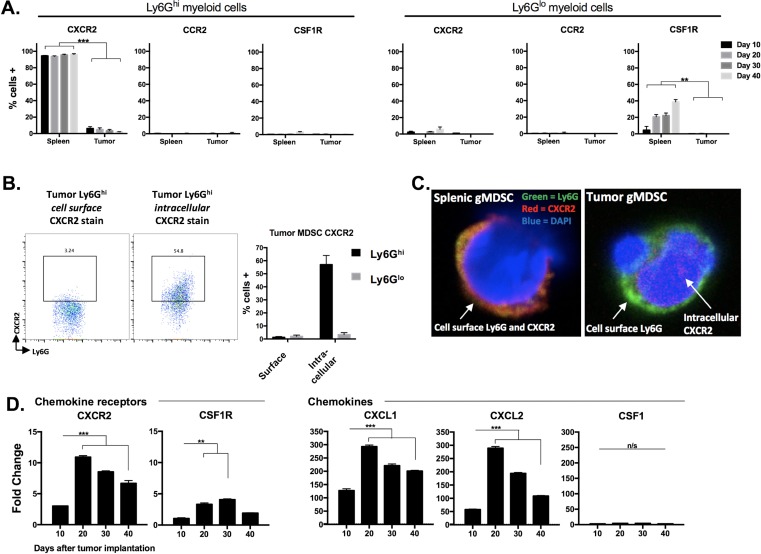
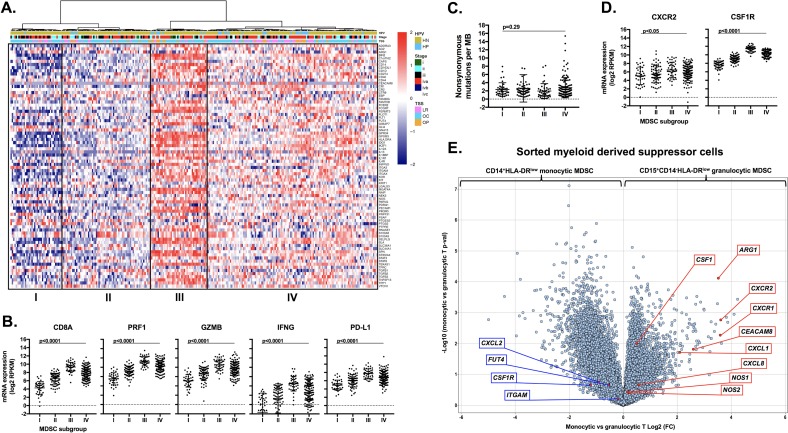
Results: gMDSCs accumulated with tumor progression and correlated with depletion of effector immune cells. Selective depletion of gMDSC restored tumor and draining lymph node antigen-specific T-lymphocyte responses lost with tumor progression. A subset of T-cell inflamed tumors responded to CTLA-4 mAb alone, but the addition of gMDSC depletion induced CD8 T-lymphocyte-dependent rejection of established tumors in all treated mice that resulted in immunologic memory. MDSCs differentially expressed chemokine receptors. Analysis of the head and neck cancer TCGA cohort revealed high CTLA-4 and MDSC-related chemokine and an MDSC-rich gene expression profile with a T-cell inflamed phenotype in > 60% of patients. CXCR2 and CSF1R expression was validated on sorted peripheral blood MDSCs from HNSCC patients.

Conclusions: MDSCs are a major contributor to local immunosuppression that limits responses to checkpoint inhibition in head and neck cancer. Limitation of MDSC recruitment or function represents a rational strategy to enhance responses to CTLA-4-based checkpoint inhibition in these patients.

Keywords: CTLA-4; MDSCs; T-cell inflamed; TCGA; rejection.


Conflict of interest statement

CONFLICTS OF INTEREST None.

Figures

Figure 1
Figure 1. Accumulation of MOC1 tumor Ly6G hi myeloid cells with tumor progression inversely correlated with accumulation of effector immune cells and T-lymphocyte antigen-specific reactivity
MOC1 tumors were harvested at days 10, 20, 30 and 40 (n = 5/time point) and analyzed for immune cell infiltration and activation by flow cytometry. A., average MOC1 primary tumor growth curve and tissue harvest time points. B., flow gating strategy and representative dot plots for Ly6GhiLy6Cint myeloid cells, Ly6GloLy6Chi myeloid cells, CD4+ and CD8+ TIL. C., quantification of myeloid cells, CD8 TIL, NK cells (CD3NK1.1+), FoxP3+/− CD4 TIL, DCs (CD11c+CD11b+/−PDCA+/−), macrophages (CD11b+F4/80+) and B-lymphocyte (B19+B220+) infiltration, normalized to number of cells per 1×10⁴ live cells collected. D., box and whiskers plot demonstrating changes in CD8+ TIL: Ly6Ghi cell ratio and CD8+ TIL:Treg (FoxP3+CD4+ TIL) ratio with tumor progression. E., quantification of CD8+ TIL cell surface CD107a positivity by flow cytometry. F., T-lymphocytes were isolated from day 10 and 20 draining lymph nodes and tumors (n = 5/group), pooled, and assessed for IFNγ production upon exposure to MOC1 tumor cell antigen; results pooled from two independent assays each with technical triplicates. **. P < 0.01; ***, P < 0.001. n/s, non-significant.
Figure 2
Figure 2. Expression of immune checkpoints and costimulatory markers in the MOC1 tumor microenvironment trended down with tumor progression
A., Immune checkpoints (PD1, CTLA-4, Tim3 and Lag3) and costimulatory markers (CD27, 41BB, ICOS and OX40) were measured on CD4+ and CD8+ TIL from MOC1 tumors at day 10, 20, 30 and 40 after tumor implantation (n = 5/time point) via flow cytometry. * denotes a statistically significant change (p < 0.05) from day 10 to 20. B., representative histograms of PD-L1 expression on MOC1 tumor infiltrating Ly6Ghi myeloid and tumor cells with tumor progression. * denotes a statistically significant change (p < 0.05) from previous time point.
Figure 3
Figure 3. Accumulation of MOC2 tumor Ly6G hi myeloid cells inversely correlated with accumulation of effector immune cells with tumor progression
MOC2 tumors were harvested at days 7, 10, 15, 19, 23, 26 and 30 (n = 3/time point) and analyzed for immune cell infiltration by flow cytometry. A, average MOC2 primary tumor growth curve and tissue harvest time points. B, quantification of gMDSC, mMDSC, CD8+ TIL, NK cells, FoxP3 positive and negative CD4+ TIL and macrophages, normalized to number of cells per 1×10⁴ total live cells collected. C., box and whiskers plot demonstrating changes in CD8+ TIL:gMDSC ratio and CD8+ TIL:Treg (FoxP3+CD4+ TIL) ratio with tumor progression. D., T-lymphocytes were isolated from day 10 and 20 draining lymph nodes and tumors (n = 5/group), pooled, and assessed for IFNγ production upon exposure to antigen on MOC1 tumor cells. *, p < 0.05; ***, p < 0.001.
Figure 4
Figure 4. Depletion of immunosuppressive gMDSCs from MOC1 tumor-bearing mice enhanced effector immune cell activation and rescued antigen-specific T-lymphocyte reactivity lost with tumor progression
A., isolated splenic Ly6Ghi myeloid cells were analyzed for their ex vivo ability to suppress CFSE-labelled CD4+ and CD8+ T-lymphocyte proliferation. Inhibition of proliferation (division index) with different Ly6Ghi:T-lymphocyte ratios are shown. B., isolated splenic and tumor-infiltrating gMDSCs were assessed for their ability to suppress CD4+ and CD8+ T-lymphocyte proliferation at a 2:1 Ly6Ghi cell:T-lymphocyte ratio. C., isolated splenic and tumor-infiltrating gMDSCs were assessed for their ability to suppress OT-1 CTL killing of SIINFEKL-pulsed EL4 cells. Splenocytes or spleen/tumor Ly6Ghi cells were added at a 1:1 ratio to CTLs. D., schematic demonstrating a single injection of Ly6G depleting antibody (clone 1A8, 200 μg/injection) in vivo at either day 14, 16 or 18 (6, 4 or 2 days before tissue analysis, respectively) before tissue analysis on day 20. Right bar graphs demonstrate absolute numbers of splenic and tumor MDSC after Ly6G mAb administration. E., CD8+ TIL and tumor infiltrating NK cell degranulation (CD107a positivity) was assessed by flow cytometry following gMDSC depletion. F, schematic demonstrating in vivo Ly6G depletion at days 10 and 15 with tissue analysis at day 20. Draining lymph node T-lymphocytes and TIL were isolated from mice treated with Ly6G depleting antibody or isotype control, pooled, and assessed for IFNγ production upon exposure to MOC1 tumor cell antigen. All in vitro data shown pooled from at least two independent experiments performed in technical triplicate. *, p < 0.05; **, p < 0.01; ***, p < 0.001. n/s, non-significant.
Figure 5
Figure 5. Depletion of gMDSCs from MOC2 tumor-bearing mice did not enhance effector immune cell activation
A., schematic demonstrating a single injection of Ly6G depleting antibody (clone 1A8, 200 μg/injection) at either day 14, 16 or 18 (6, 4 or 2 days before tissue analysis, respectively) before tissue analysis on day 20. Right bar graphs demonstrate absolute numbers of splenic and tumor MDSC after Ly6G mAb administration. B., CD8+ TIL infiltration and degranulation (CD107a positivity) were assessed by flow cytometry following gMDSC depletion. C., NK cell tumor infiltration and degranulation (CD107a positivity) were assessed by flow cytometry. D., schematic demonstrating Ly6G depletion at days 10 and 15 with tissue analysis at day 20. Draining lymph node T-lymphocytes and TIL were isolated from mice treated with Ly6G depleting antibody or isotype control, pooled, and assessed for IFNγ production upon exposure to MOC2 tumor cells. **, p < 0.01; ***, p < 0.001. n/s, non-significant.
Figure 6
Figure 6. Depletion of gMDSC sensitized MOC1 tumors to CTLA-4 mAb induced tumor rejection
Established MOC1 tumors were treated with Ly6G depleting antibody (clone 1A8, 200 μg/injection) and CTLA-4 mAb (clone 9H10, 100 μg/injection), alone or in combination. A., schematic of Ly6G depletion and checkpoint blockade. Primary tumor growth plots demonstrate growth curves for treated MOC1 tumors (colored lines) compared to control (black lines) for Ly6G mAb alone B., or CTLA-4 with C. or without D. Ly6G mAb. E., survival analysis of treated MOC1 tumor-bearing mice, with statistical significance between treatment groups as indicated. Results pooled results from two independent experiments are shown. **, p < 0.01; ***, p < 0.001. n/s, non-significant.
Figure 7
Figure 7. Addition of PD-L1 mAb to CTLA-4 mAb did not enhance MOC1 tumor control or rejection rates
Mice bearing established MOC1 tumors were treated with PD-L1 mAb (clone 10F.9G2, 200 μg/injection) alone or in combination with CTLA-4 mAb (clone 9H10, 100 μg/injection) and followed for tumor growth and survival. Treatment schema, individual tumor growth curves and survival are shown. *, p < 0.05; ***, p < 0.001.
Figure 8
Figure 8. Depletion of gMDSC did not enhance responses to CTLA-4 mAb in MOC2 tumor-bearing mice
Established MOC2 tumors were treated with Ly6G depleting antibody (clone 1A8, 200 μg/injection) and CTL-A4 mAb (clone 9H10, 100 μg/injection), alone or in combination. Treatment schema, average tumor growth curves for each treatment condition and survival are shown. n/s, non-significant.
Figure 9
Figure 9. Immune correlative and functional analysis revealed partial Treg depletion, CD8 + T-lymphocyte dependent tumor rejection, and induction of immunologic memory in MOC1 tumor-bearing mice treated with gMDSC depletion and CTLA-4 mAb
A., infiltration of CD8+ TIL following treatment with CTLA-4 mAb with or without Ly6G depletion was quantified (left panel) via flow cytometry with representative dot plots on the right. B., CD8+ TIL cell surface expression of CD107a was quantified. C., splenic or tumor-infiltrating FoxP3+CD4+ Tregs were quantified 48 hours after a single injection (200 μg) of either CTLA-4, CD25 or isotype control mAb into mice bearing 7 day-old tumors. D., tumor-infiltrating Ly6Ghi gMDSC were quantified 48 hours after a single injection (200 μg) of either CTLA-4, 1A8 or isotype control mAb into mice bearing 20 day-old tumors. E., draining lymph node T-lymphocytes were isolated from treated mice (n = 5/condition), pooled, and assessed for IFNγ production upon exposure to MOC1 tumor antigen. F., in separate experiments, tumor-bearing mice with established MOC1 tumors were treated with combination Ly6G and CTLA-4 mAbs with or without antibodies to deplete CD8 (clone YTS169.4, 200 μg/injection, twice weekly), CD4 (clone GK1.5, 200 μg/injection, twice weekly) or NK cells (clone PK136, 200 μg/injection, twice weekly). G., mice that rejected MOC1 tumors after CTLA-4 mAb alone or in combination with Ly6G mAb were challenged with 5×10⁶ parental MOC1 cells (55 days after original MOC1 implantation, approximately 35 days after MOC1 tumor rejection) and followed for tumor engraftment. *, p < 0.05; **, p < 0.01; ***, p < 0.001. n/s, non-significant.
Figure 10
Figure 10. gMDSC appear to be recruited into the tumor microenvironment through CXCR2 signaling
A., spleens and tumors from MOC1 tumor-bearing mice were harvested at day 10, 20, 30 and 40 and MDSCs were analyzed for cell surface CXCR2, CCR2 and CSF1R expression (n = 5/time point). B., representative dotplots of isolated tumor gMDSCs subjected to cell surface or intracellular (after fixation and permeabilization) CXCR2 staining. Quantification (bar graph) is shown below. Right photomicrographs (63x) demonstrate Ly6G (green) and CXCR2 (red) staining on isolated splenic gMDSC without fixation and permeabilization (top) and on isolated tumor gMDSC with fixation and permeabilization (bottom). C., unsorted MOC1 tumor tissues were collected at days 10, 20, 30 and 40, RNA was isolated from digested single cell suspensions, and qRT-PCR analysis was used to measure chemokine receptor (CXCR2, CSF1R, referenced to day 10 CSF1R levels) and ligand (CXCL1, CXCL2, CSF1, referenced to day 10 CSF1 levels) transcript levels (n = 3/time point). **, p < 0.01; ***, p < 0.001.
Figure 11
Figure 11. Analysis of human HNSCC data revealed high CXCR2 axis and checkpoint expression and identified MDSC rich subgroups that are T-cell inflamed
Immune signatures of 297 HNSCC patient samples by RNAseq from the TCGA cohort were analyzed. A., expression profiles of 77 MDSC-associated genes are presented by heatmap (y-axis) [39] where red indicates relative gene overexpression and blue indicates relative gene underexpression compared to means for each gene. Supervised hierarchical clustering revealed four human MDSC subgroups. Tumor site (NM, normal mucosa; OC, oral cavity; LR, larynx; OP, oropharynx) and HPV status (HP, HPV positive; HN, HPV negative) are indicated at the top of the heatmap. B., RNA expression patterns of effector CD8+ T-lymphocyte associated genes (CD8a, Prf1, Gzmb, Ifng, CD274/PD-L1) based on MDSC gene expression clustering subgroup, analyzed for significance by 1-way ANOVA. C., distribution of mutational burden by MDSC gene expression clustering subgroup. D., RNA expression patterns of chemokine receptors (CXCR2 and CFS1R) based on MDSC gene expression clustering subgroup. E., volcano plot displaying the magnitude (x-axis, fold change) and significance (y-axis, p-value) of differential gene expression between sorted peripheral blood monocytic and granulocytic MDSCs from four patients with advanced-stage pharyngeal SCC.
Figure 12
Figure 12. MDSC rich subgroups correlated with CXCR2 axis components, disease stage and HPV status
A., average gene expression profiles CTLA4, CXCR2 and CSF1R genes amongst 23 tumor types were ranked and plotted based upon their RSEM (log2) value. B., RNA expression patterns of the chemokines CXCL1, CXCL2, CXCL8 and CSF1 based on MDSC gene expression clustering subgroup, analyzed for significance by 1-way ANOVA. C., distribution of clinical parameters by MDSC gene expression clustering subgroup, analyzed for significance by χ-square analysis.

References

    1. Schumacher TN, Schreiber RD. Neoantigens in cancer immunotherapy. Science. 2015;348:69–74. - PubMed
    1. Keck MK, Zuo Z, Khattri A, Stricker TP, Brown CD, Imanguli M, Rieke D, Endhardt K, Fang P, Brägelmann J, DeBoer R, El-Dinali M, Aktolga S, et al. Integrative analysis of head and neck cancer identifies two biologically distinct HPV and three non-HPV subtypes. Clin Cancer Res. 2015;21:870–81. - PubMed
    1. Li B, Severson E, Pignon JC, Zhao H, Li T, Novak J, Jiang P, Shen H, Aster JC, Rodig S, Signoretti S, Liu JS, Liu XS. Comprehensive analyses of tumor immunity: implications for cancer immunotherapy. Genome Biol. 2016;17:174. - PMC - PubMed
    1. Topalian SL, Taube JM, Anders RA, Pardoll DM. Mechanism-driven biomarkers to guide immune checkpoint blockade in cancer therapy. Nat Rev Cancer. 2016;16:275–87. - PMC - PubMed
    1. Seiwert TY, Burtness B, Mehra R, Weiss J, Berger R, Eder JP, Heath K, McClanahan T, Lunceford J, Gause C, Cheng JD, Chow LQ. Safety and clinical activity of pembrolizumab for treatment of recurrent or metastatic squamous cell carcinoma of the head and neck (KEYNOTE-012): an open-label, multicentre, phase 1b trial. Lancet Oncol. 2016;17:956–65. - PubMed