. 2017 Jul 5;8(34):55984-55997.
doi: 10.18632/oncotarget.18995. eCollection 2017 Aug 22.

Hyperosmotic stress stimulates autophagy via polycystin-2

Affiliations

Hyperosmotic stress stimulates autophagy via polycystin-2

Daniel Peña-Oyarzun et al. Oncotarget. .

Abstract

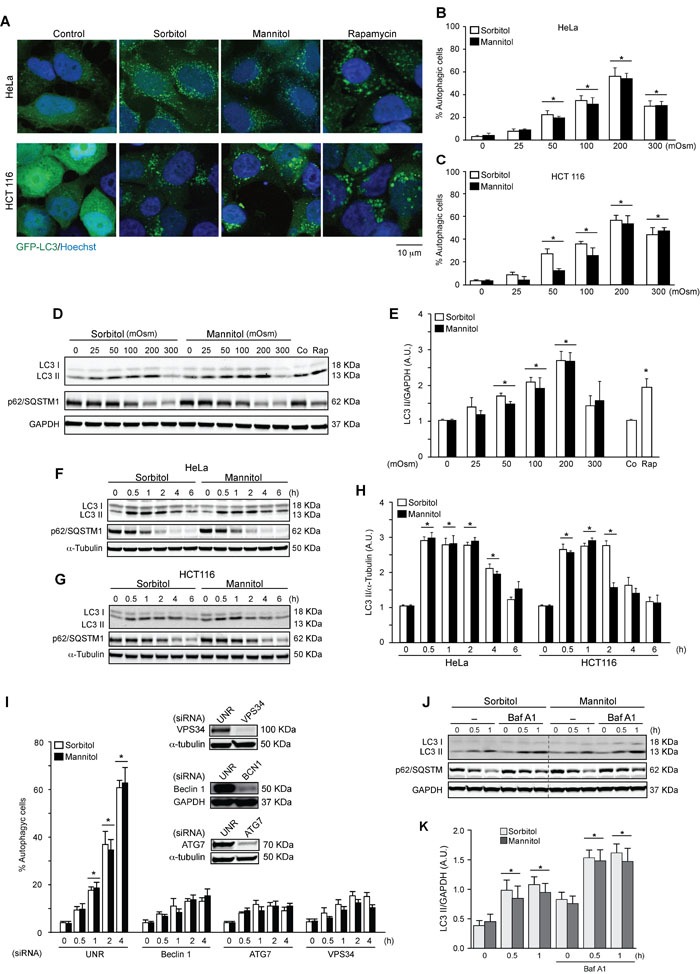
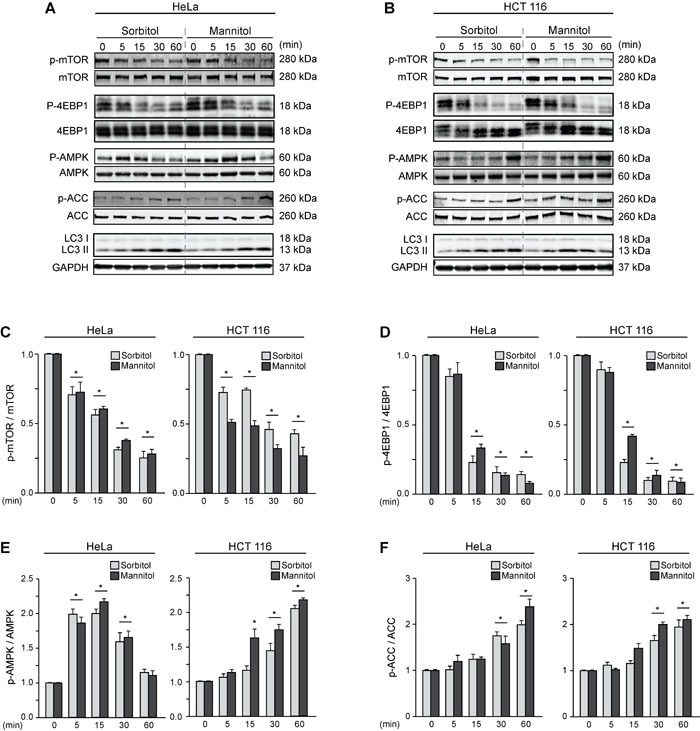
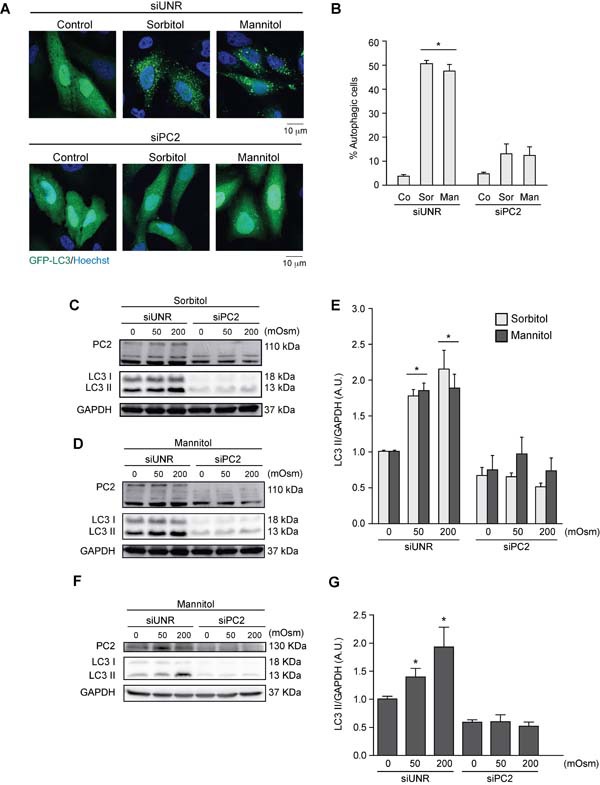
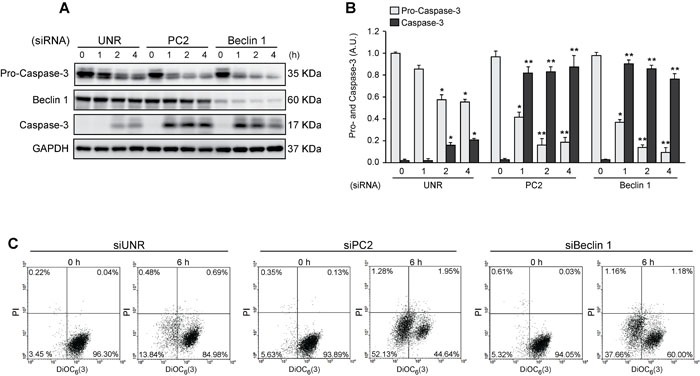
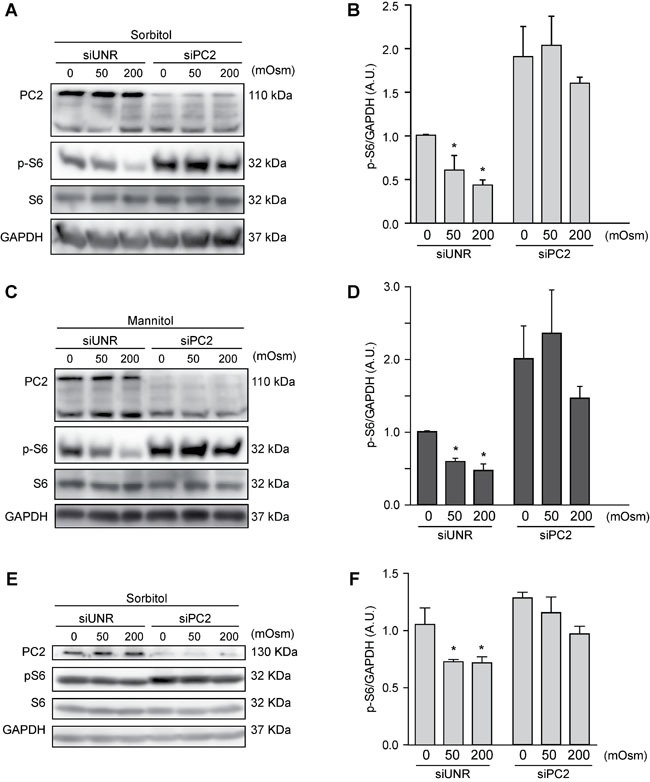
Various intracellular mechanisms are activated in response to stress, leading to adaptation or death. Autophagy, an intracellular process that promotes lysosomal degradation of proteins, is an adaptive response to several types of stress. Osmotic stress occurs under both physiological and pathological conditions, provoking mechanical stress and activating various osmoadaptive mechanisms. Polycystin-2 (PC2), a membrane protein of the polycystin family, is a mechanical sensor capable of activating the cell signaling pathways required for cell adaptation and survival. Here we show that hyperosmotic stress provoked by treatment with hyperosmolar concentrations of sorbitol or mannitol induces autophagy in HeLa and HCT116 cell lines. In addition, we show that mTOR and AMPK, two stress sensor proteins involved modulating autophagy, are downregulated and upregulated, respectively, when cells are subjected to hyperosmotic stress. Finally, our findings show that PC2 is required to promote hyperosmotic stress-induced autophagy. Downregulation of PC2 prevents inhibition of hyperosmotic stress-induced mTOR pathway activation. In conclusion, our data provide new insight into the role of PC2 as a mechanosensor that modulates autophagy under hyperosmotic stress conditions.

Keywords: Autophagy; hyperosmotic stress; mTOR; polycystin-2.


Conflict of interest statement

CONFLICTS OF INTEREST The authors declare that no competing interests exist.

Figures

Figure 1
Figure 1. Hyperosmotic stress stimulates autophagy
HeLa and HCT 116 cells were transduced with an adenovirus coding for GFP-LC3 (Ad GFP-LC3) for 24 h. Cultures were then exposed to different concentrations (25-300 mOsm) of sorbitol or mannitol for 2 h. Subsequently, autophagy was evaluated by fluorescent microscopy. 1 μM of rapamycin was used as a positive control to induce autophagy. Nuclei were dyed with 10 ng/mL of DAPI. Representative pictures are shown in A.. The percentage of cells with GFP-LC3 puncta (autophagic cells) in HeLa and HCT116 are shown in B. and C., respectively (mean ± SEM, n = 3, *p < 0.05 vs. 0 mOsm). LC3 I-to-LC3 II conversion and p62/SQSTM1 depletion were assessed by Western blot analysis in HeLa and HCT116 cells treated with various concentrations of sorbitol or mannitol (25-300 mOsm) D., E. for the indicated times (0.5-6 h) F.-H. Representative gels are shown in D., F. and G.. Quantification of gel bands is shown in E. and H. (mean ± SEM, n = 3, *p < 0.05 vs. 0 mOsm or 0 h). HeLa cells were transfected with specific siRNAs against Beclin 1, ATG7 or VPS34, followed by infection with Ad GFP-LC3. Subsequently, cells were treated with 200 mOsm of sorbitol or mannitol for 0, 0.5, 1, 2 or 4 h. Autophagy was evaluated by fluorescent microscopy. The percentage of autophagic cells was quantified, shown in I. (*p < 0.05 vs. 0 h) and representative gels inserted in the graphic indicate the efficiency of siRNA downregulation for Beclin 1, ATG7 and VPS34 I. An unrelated siRNA (UNR) was used as a control. GAPDH and α-tubulin were used as loading controls J.-K. The effect of BafA1 treatment on LC3 I-to-LC3 II conversion and p62/SQSTM1 degradation under hyperosmotic stress conditions was assessed. HeLa cell cultures were exposed to sorbitol or mannitol (200 mOsm) for 0, 0.5 or 1 h in the presence or absence of 50 nM of BafA1. LC3 II and p62/SQSTM1 levels were then determined by Western blot analysis J.. GAPDH levels were monitored as a loading control. Quantification of gel bands is shown in K. (mean ± SEM, n = 3, *p < 0.05 vs. 0 h).
Figure 2
Figure 2. Hyperosmotic stress modulates the mTOR and AMPK pathways
HeLa and HCT116 cultures were exposed to sorbitol or mannitol (200 mOsm) for 0, 5, 15, 30 or 60 min. Total and phosphorylated forms of mTOR, 4EBP1, AMPK, ACC and LC3 I-to-LC3 II conversion were evaluated by Western blot analysis. Representative gels are shown in A. and B.. GAPDH levels were monitored as a loading control. Quantification of gel bands is shown in C.-F. (mean ± SEM, n = 3, *p < 0.05 vs. 0 min).
Figure 3
Figure 3. PC2 is required for hyperosmotic stress-induced autophagy
PC2 was downregulated in HeLa cells by a specific siRNA against PC2. An unrelated siRNA (UNR) was used as a control. Subsequently, cells were infected with AdGFP-LC3 for 24 h and treated with sorbitol or mannitol (200 mOsm) for 2 h. Cells were fixed, and autophagy was evaluated by fluorescence microscopy. Representative pictures are shown in A. The percentage of autophagic cells is shown in B. (mean ± SEM, n = 3, *p < 0.05 vs. Co siUNR). Nuclei were dyed with 10 ng/mL of DAPI C.-G. PC2 was downregulated in HeLa C.-E. and HCT116 F.-G. cells with a specific siRNA against PC2. LC3 I-to-LC3 II conversion was evaluated by Western blot analysis in HeLa C.-E. and HCT116 F.-G. cells exposed to sorbitol or mannitol (0, 50 or 200 mOsm) for 2 h. Representative gels are shown in C., D. and F.. Quantification of gel bands is shown in shown in E. and G. (mean ± SEM, n = 3, *p < 0.05 vs. 0 mOsm siUNR). GAPDH levels were used as a loading control.
Figure 4
Figure 4. Pro-survival role of autophagy in cells subjected to hyperosmotic stress
HeLa cells were transfected with an unrelated control siRNA (siUNR) or specific siRNAs against PC2 and Beclin 1. 48 h later, cells were exposed to sorbitol (200 mOsm) at the indicated times. Pro-caspase-3, Beclin 1 and caspase-3 levels were evaluated by Western blot analysis. GAPDH levels were used as a loading control. Representative gels are shown in A. Quantification of gel bands is shown in B. (mean ± SEM, n = 3, *p < 0.05 vs. 0 h siUNR, **p < 0.01 vs. 0 h siUNR). Alternatively, cells were submitted to cytofluorimetric analysis of mitochondrial membrane potential (DiOC6(3) staining) and viability (PI staining). C. Representative dot plots of HeLa cells treated for 6 h with 200 mM sorbitol are shown (n = 3).
Figure 5
Figure 5. PC2 modulates the mTOR pathway under hyperosmotic stress conditions
PC2 was downregulated in HeLa A.-D. and HCT116 E.-F. cells using a specific siRNA against PC2. An unrelated siRNA (UNR) was used as a control. Subsequently, cells were treated with 0, 50 or 200 mOsm sorbitol or mannitol and p-S6, S6 and PC2 levels were evaluated by Western blot analysis. Representative gels are shown in A., C. and E.. Quantification of gel bands is shown in B., D. and F. (mean ± SEM, n = 3, *p < 0.05 vs. 0 mOsm siUNR). GAPDH levels were used as a loading control.

Similar articles

Cited by

References

    1. Lemp MA, Bron AJ, Baudouin C, Benitez Del Castillo JM, Geffen D, Tauber J, Foulks GN, Pepose JS, Sullivan BD. Tear osmolarity in the diagnosis and management of dry eye disease. Am J Ophthalmol. 2011;151:792–8. e1. - PubMed
    1. Pan Z, Wang Z, Yang H, Zhang F, Reinach PS. TRPV1 activation is required for hypertonicity-stimulated inflammatory cytokine release in human corneal epithelial cells. Invest Ophthalmol Vis Sci. 2011;52:485–493. - PMC - PubMed
    1. Stookey JD. High prevalence of plasma hypertonicity among community-dwelling older adults: results from NHANES III. J Am Diet Assoc. 2005;105:1231–1239. - PubMed
    1. Stookey JD, Barclay D, Arieff A, Popkin BM. The altered fluid distribution in obesity may reflect plasma hypertonicity. Eur J Clin Nutr. 2007;61:190–199. - PubMed
    1. Berga-Bolanos R, Drews-Elger K, Aramburu J, Lopez-Rodriguez C. NFAT5 regulates T lymphocyte homeostasis and CD24-dependent T cell expansion under pathologic hypernatremia. J Immunol. 2010;185:6624–6635. - PubMed

LinkOut - more resources