. 2016 Jun 1;8(34):56081-56094.
doi: 10.18632/oncotarget.9760. eCollection 2017 Aug 22.

Hexokinase 2 promotes tumor growth and metastasis by regulating lactate production in pancreatic cancer

Affiliations

Hexokinase 2 promotes tumor growth and metastasis by regulating lactate production in pancreatic cancer

Marybeth Anderson et al. Oncotarget. .

Abstract

Pancreatic ductal adenocarcinoma (PDAC) is a KRAS-driven cancer with a high incidence of metastasis and an overall poor prognosis. Previous work in a genetically engineered mouse model of PDAC showed glucose metabolism to be important for maintaining tumor growth. Multiple glycolytic enzymes, including hexokinase 2 (HK2), were upregulated in primary PDAC patient tumors, supporting a role for glycolysis in promoting human disease. HK2 was most highly expressed in PDAC metastases, suggesting a link between HK2 and aggressive tumor biology. In support of this we found HK2 expression to be associated with shorter overall survival in PDAC patients undergoing curative surgery. Transient and stable knockdown of HK2 in primary PDAC cell lines decreased lactate production, anchorage independent growth (AIG) and invasion through a reconstituted matrix. Conversely, stable overexpression of HK2 increased lactate production, cell proliferation, AIG and invasion. Pharmacologic inhibition of lactate production reduced the HK2-driven increase in invasion while addition of extracellular lactate enhanced invasion, together providing a link between glycolytic activity and metastatic potential. Stable knockdown of HK2 decreased primary tumor growth in cell line xenografts and decreased incidence of lung metastasis after tail vein injection. Gene expression analysis of tumors with decreased HK2 expression showed alterations in VEGF-A signaling, a pathway important for angiogenesis and metastasis, consistent with a requirement of HK2 in promoting metastasis. Overall our data provides strong evidence for the role of HK2 in promoting PDAC disease progression, suggesting that direct inhibition of HK2 may be a promising approach in the clinic.

Keywords: glycolysis; hexokinase 2; metastasis; pancreatic cancer.


Conflict of interest statement

CONFLICTS OF INTEREST The authors declare no conflict of interest.

Figures

Figure 1
Figure 1. HK2 expression is upregulated in PDAC and associated with a poor overall survival
a. Log2 expression of HK2 in normal pancreas, primary PDAC, and PDAC metastases. Box shows median expression with upper and lower quartiles and whiskers show maximum and minimum values. A one-way ANOVA with Bonferroni correction for multiple comparisons test determined statistical significance. b. Groups for Kaplan Meier survival analysis were based off HK2 expression in primary tumors. Lowest quartile showed median survival of 24 months (95% CI [14, 34]) while highest quartile showed median survival of 10 months (95% CI [9, 11]). c. Correlation between HK2, GLUT1 and LDHA expression in primary tumors (n=125) and overall survival as determined by univariate Cox proportional regression. Hazard ratios and 95% CI shown. d. Fold change in HK2 expression across a panel of PDAC cell lines relative to the immortalized epithelial cell line HPNE. Fold change determined using the ΔΔCT method with mean and standard error of the mean (SEM) shown (n=3 technical replicates).
Figure 2
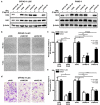
Figure 2. HK2 is required for AIG and invasion in PDAC cell lines
a. Transient and stable knockdown of HK2 was achieved using siRNA (siHK2, 20 nM) and a doxycycline inducible lentiviral shRNA construct (shHK2# and #2) in CFPAC-1-LUC and PANC-1. Cells were isolated after 72 hours of doxycycline (2 μg/mL) exposure. b. Representative images of colony formation in soft agar assays. c. Percent of growth with HK2 knockdown relative to control (siNS or shNS). Mean ± SEM of biological replicates (n=4) shown with student's t-tests for statistical significance. d. Representative images from Matrigel coated transwell invasion assays. e. Percent invasion of HK2 knockdown relative to control (siNS or shNS). Mean ± SEM of biological replicates (n=6) shown with student's t-tests for statistical significance.
Figure 3
Figure 3. HK2 is sufficient to promote AIG and invasion in PDAC cell lines
a. Stable overexpression of HK2 (pHAGE HK2) relative to control (pHAGE GFP) in CFPAC-1 and PANC-1 cell lines. b. Percent hexokinase activity of knockdown (siNS vs. siHK2) and overexpression (pHAGE GFP vs. pHAGE HK2) cell lines relative to control. Mean ± SEM of biological replicates (n=3) shown with student's t-tests for statistical significance. c. Cell proliferation in CFPAC-1-GFP and CFPAC-1-HK2 as determined using a MTT assay. Mean ± SEM of technical replicates (n=4) shown with student's t-tests for statistical significance at 48, 72, and 96 hours of growth. d. Percent colony growth with HK2 overexpression relative to control. Mean ± SEM of biological replicates (n=3) shown with student's t-tests for statistical significance. e. Percent invasion with HK2 overexpression relative to control. Mean ± SEM of biological replicates (n=6) shown with student's t-tests for statistical significance.
Figure 4
Figure 4. HK2 regulates lactate production and invasion in PDAC cell lines
a. Relative lactate production in CFPAC-1 and PANC-1 with HK2 knockdown (siHK2 vs. siNS) and overexpression (pHAGE HK2 vs. pHAGE GFP). Mean ± SEM of biological replicates (n=3) shown with student's t-tests for statistical significance. b. IC50 determination for CFPAC-1-HK2 and PANC-1-HK2 after 72 hours of oxamate treatment; Mean ± SEM of technical replicates (n=4) shown with student's t-tests for statistical significance. CFAPC-1 IC50 calculated to be 15 mM while PANC-1 determined to be 16mM using GraphPad Prism software (v.5, GraphPad Software, INC. La Jolla, CA, USA). c. L-lactate produced (mM) in CFPAC-1-HK2 and PANC-1-HK2 cell lines treated with PBS or IC50 oxamate for 72 hours. Mean ± SEM of biological replicates (n=3) shown with student's t-tests for statistical significance. d. Percent invasion in cells treated with PBS or IC50 oxamate. Mean ± SEM of biological replicates (n=6) shown with student's t-tests for statistical significance. e. Percent invasion in PDAC cells incubated with extracellular lactate (40 mM). Mean ± SEM of biological replicates (n=6) shown with student's t-tests for statistical significance.
Figure 5
Figure 5. HK2 is required for PDAC primary tumor growth and regulates gene expression
a. Expression of HK2 in CFPAC-1-LUC tumors containing doxycycline inducible shNS or shHK2#1 treated with sucrose (control) or doxycycline for 3 or 7 days. b. Percent tumor volume relative to start of treatment for shNS tumors treated with sucrose (black, n=9) or doxycycline (grey, n=10) for 30 days. Average normalized tumor volume and SEM shown. c. Percent tumor volume relative to start of treatment for shHK2 tumors treated with sucrose (black, n=8) or doxycycline (grey, n=8) for 30 days. Average normalized tumor volume and SEM shown with student's t-tests for statistical significance at each time point. d. Representative images of tumors isolated after 30 days of treatment with sucrose or doxycycline. e. Heat map of the expression of the top 20 ranked genes from the gene lists by Schoenfeld, et al [25] [32], including HK2 and VEGF-A, for shNS (control) and shHK2#1 (HK2 knockdown) tumors isolated at the end of treatment as determined by RNA-sequencing.
Figure 6
Figure 6. HK2 is required for metastasis in PDAC
a. Bioluminescence of mice injected with CFPAC-1-LUC shNS cells (top row) and cells with HK2 knockdown (CFPAC-1-shHK2 #1, bottom row) at the start of the study (column one) and at the end of the study (column 3). b. Bioluminescence measured for tumors observed in lungs obtained after autopsy. Each point represents luminescence of tumor foci (shNS, n=7 and shHK2, n=3) or an entire lung if no foci were observed (shHK2, n=6). c. Fisher's exact t-test showing a significant difference in formation of metastases with HK2 knockdown (P=0.011). d. Representative ex vivo images used for quantification of bioluminescence. H&E staining was used to confirm metastases formation. Arrowheads point to cancer cells in a metastatic lesion with surrounding normal lung tissue (top row). Lungs that did not exhibit bioluminescence showed no histological evidence of metastases (bottom row).

Similar articles

Cited by

References

    1. Howlader N, Noone A, Krapcho M, Garshell J, Neyman N, Altekruse S, Kosary C, Yu M, Ruhl J, Tatalovich Z, Cho H, Mariotto A, Lewis D, et al. SEER cancer statistics review, 1975-2010. Based on November 2012 SEER data submission, posted to the SEER web site. 2013
    1. Ryan DP, Hong TS, Bardeesy N. Pancreatic adenocarcinoma. New England Journal of Medicine. 2014;371:1039–1049. - PubMed
    1. Yeh JJ, Der CJ. Targeting signal transduction in pancreatic cancer treatment. Expert Opinion on Therapeutic Targets. 2007;11:673–694. - PubMed
    1. Bryant KL, Mancias JD, Kimmelman AC, Der CJ. KRAS: feeding pancreatic cancer proliferation. Trends in Biochemical Sciences. 2014;39:91–100. - PMC - PubMed
    1. Zhao Y, Liu H, Riker AI, Fodstad O, Ledoux SP, Wilson GL, Tan M. Emerging metabolic targets in cancer therapy. Frontiers in Bioscience: a Journal and Virtual Library. 2011;16:1844–1860. - PMC - PubMed