

Seed maturation associated transcriptional programs and regulatory networks underlying genotypic difference in seed dormancy and size/weight in wheat (Triticum aestivum L.)
- PMID: 28915785
- PMCID: PMC5603048
- DOI: 10.1186/s12870-017-1104-5
Seed maturation associated transcriptional programs and regulatory networks underlying genotypic difference in seed dormancy and size/weight in wheat (Triticum aestivum L.)
Abstract
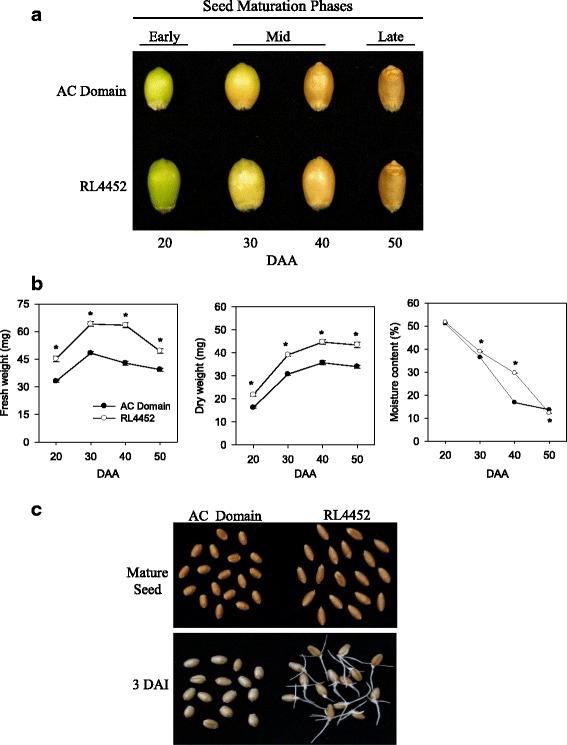
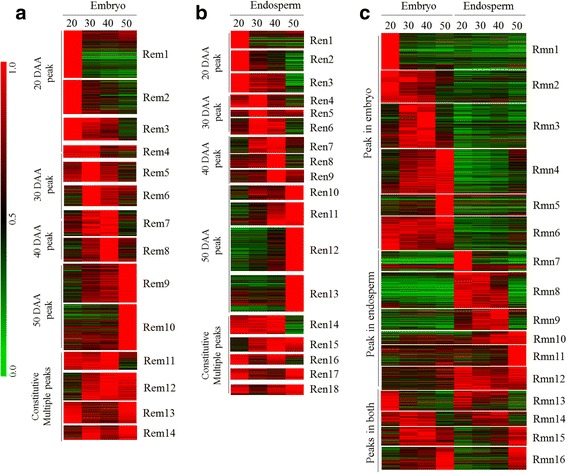
Background: Maturation forms one of the critical seed developmental phases and it is characterized mainly by programmed cell death, dormancy and desiccation, however, the transcriptional programs and regulatory networks underlying acquisition of dormancy and deposition of storage reserves during the maturation phase of seed development are poorly understood in wheat. The present study performed comparative spatiotemporal transcriptomic analysis of seed maturation in two wheat genotypes with contrasting seed weight/size and dormancy phenotype.
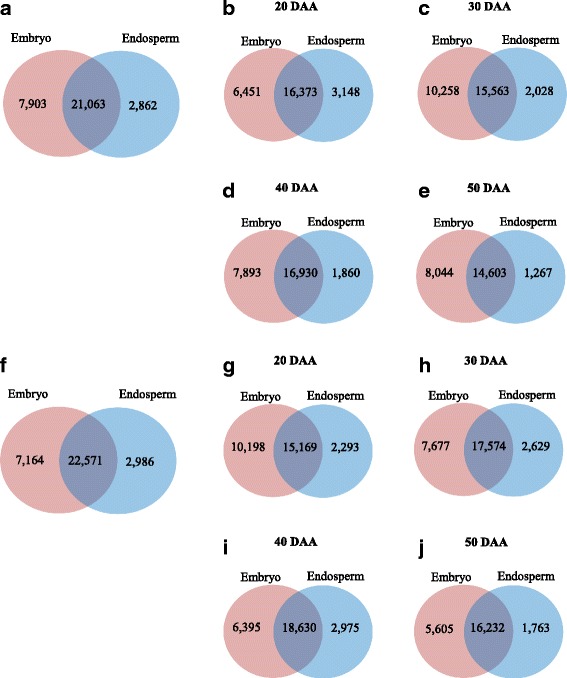
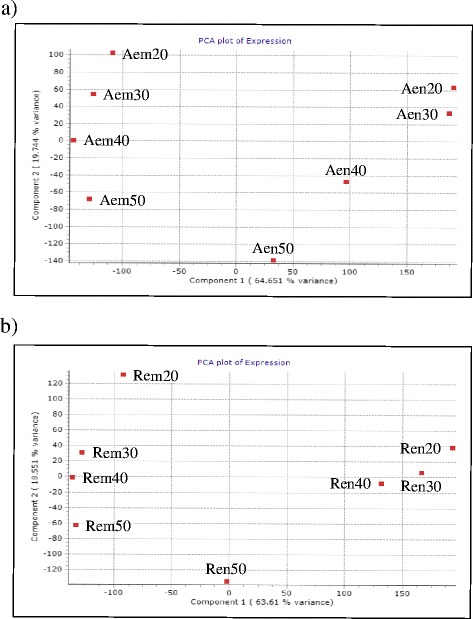
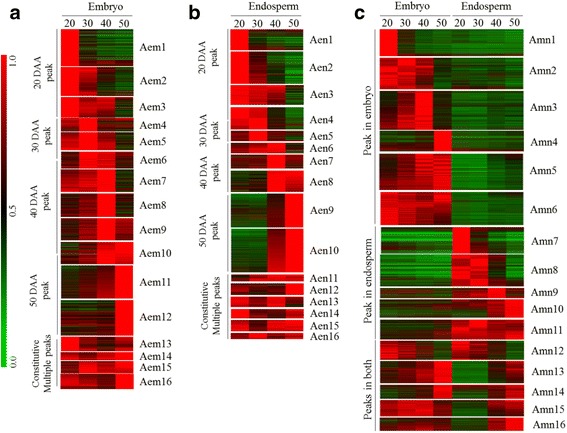
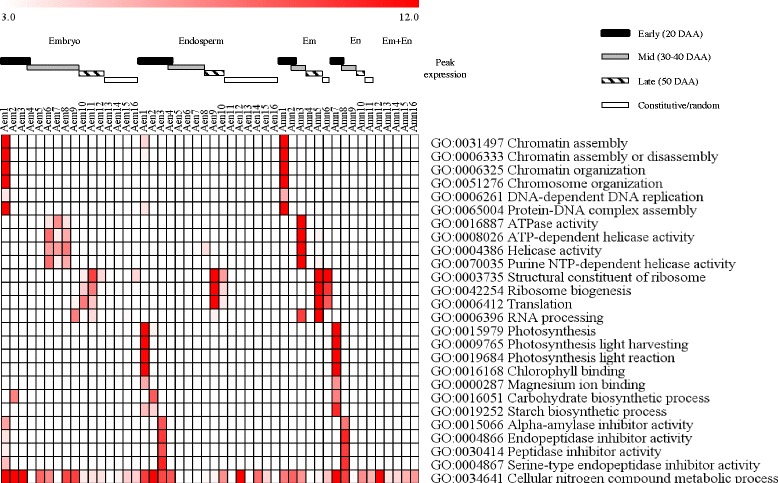
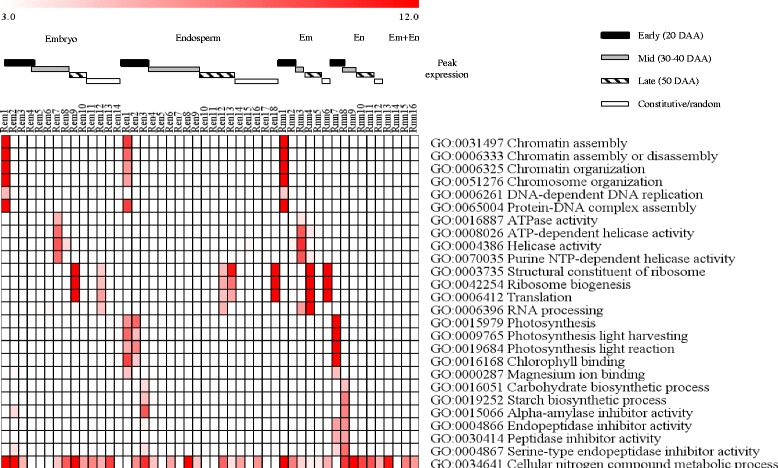
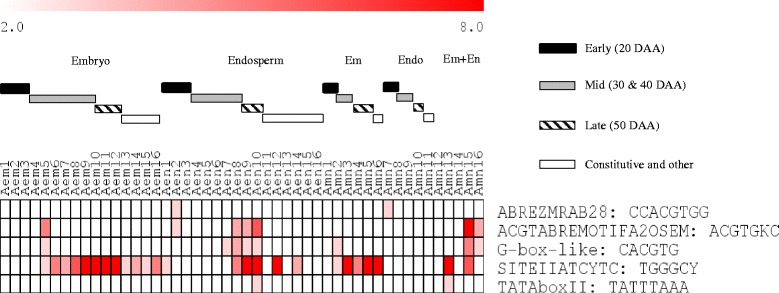
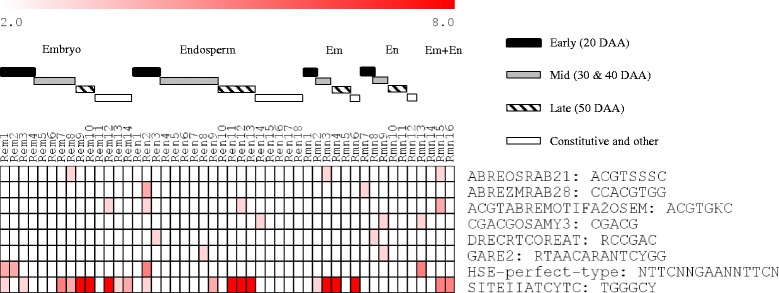
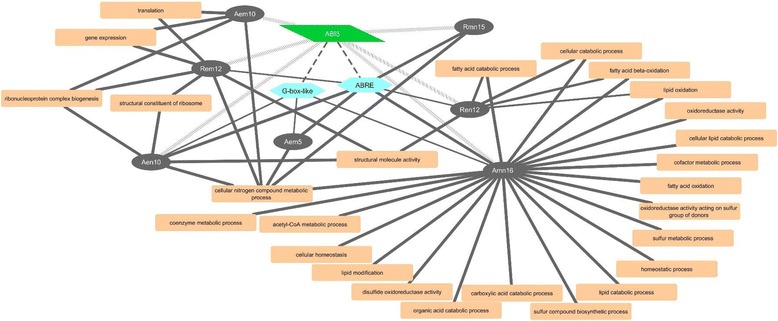
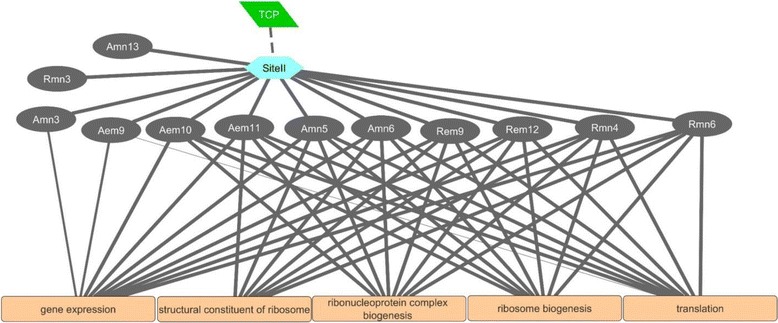
Results: The embryo and endosperm tissues of maturing seeds appeared to exhibit genotype-specific temporal shifts in gene expression profile that might contribute to the seed phenotypic variations. Functional annotations of gene clusters suggest that the two tissues exhibit distinct but genotypically overlapping molecular functions. Motif enrichment predicts genotypically distinct abscisic acid (ABA) and gibberellin (GA) regulated transcriptional networks contribute to the contrasting seed weight/size and dormancy phenotypes between the two genotypes. While other ABA responsive element (ABRE) motifs are enriched in both genotypes, the prevalence of G-box-like motif specifically in tissues of the dormant genotype suggests distinct ABA mediated transcriptional mechanisms control the establishment of dormancy during seed maturation. In agreement with this, the bZIP transcription factors that co-express with ABRE enriched embryonic genes differ with genotype. The enrichment of SITEIIATCYTC motif specifically in embryo clusters of maturing seeds irrespective of genotype predicts a tissue specific role for the respective TCP transcription factors with no or minimal contribution to the variations in seed dormancy.
Conclusion: The results of this study advance our understanding of the seed maturation associated molecular mechanisms underlying variation in dormancy and weight/size in wheat seeds, which is a critical step towards the designing of molecular strategies for enhancing seed yield and quality.
Keywords: Embryo; Endosperm; Genotype; Seed maturation; Transcriptome; Triticum aestivum; Wheat.
Conflict of interest statement
Ethics approval and consent to participate
Not applicable.
Consent for publication
Not applicable.
Competing interests
The authors declare that they have no competing interests.
Publisher’s Note
Springer Nature remains neutral with regard to jurisdictional claims in published maps and institutional affiliations.
Figures
Similar articles
-
Molecular Aspects of Seed Development Controlled by Gibberellins and Abscisic Acids.Int J Mol Sci. 2022 Feb 7;23(3):1876. doi: 10.3390/ijms23031876. Int J Mol Sci. 2022. PMID: 35163798 Free PMC article. Review.
-
Transcriptional programs regulating seed dormancy and its release by after-ripening in common wheat (Triticum aestivum L.).Plant Biotechnol J. 2012 May;10(4):465-76. doi: 10.1111/j.1467-7652.2012.00682.x. Epub 2012 Feb 1. Plant Biotechnol J. 2012. PMID: 22292455
-
Integrated analysis of seed proteome and mRNA oxidation reveals distinct post-transcriptional features regulating dormancy in wheat (Triticum aestivum L.).Plant Biotechnol J. 2013 Oct;11(8):921-32. doi: 10.1111/pbi.12083. Epub 2013 Jun 7. Plant Biotechnol J. 2013. PMID: 23745731
-
Transcriptomics of cytokinin and auxin metabolism and signaling genes during seed maturation in dormant and non-dormant wheat genotypes.Sci Rep. 2019 Mar 8;9(1):3983. doi: 10.1038/s41598-019-40657-9. Sci Rep. 2019. PMID: 30850728 Free PMC article.
-
Molecular networks regulating Arabidopsis seed maturation, after-ripening, dormancy and germination.New Phytol. 2008;179(1):33-54. doi: 10.1111/j.1469-8137.2008.02437.x. Epub 2008 Apr 14. New Phytol. 2008. PMID: 18422904 Review.
Cited by
-
The membrane associated NAC transcription factors ANAC060 and ANAC040 are functionally redundant in the inhibition of seed dormancy in Arabidopsis thaliana.J Exp Bot. 2022 Sep 12;73(16):5514-5528. doi: 10.1093/jxb/erac232. J Exp Bot. 2022. PMID: 35604925 Free PMC article.
-
Development and Optimization of Label-Free Quantitative Proteomics under Different Crossing Periods of Bottle Gourd.Curr Issues Mol Biol. 2023 Feb 6;45(2):1349-1372. doi: 10.3390/cimb45020088. Curr Issues Mol Biol. 2023. PMID: 36826033 Free PMC article.
-
Molecular Aspects of Seed Development Controlled by Gibberellins and Abscisic Acids.Int J Mol Sci. 2022 Feb 7;23(3):1876. doi: 10.3390/ijms23031876. Int J Mol Sci. 2022. PMID: 35163798 Free PMC article. Review.
-
Ethylene regulates post-germination seedling growth in wheat through spatial and temporal modulation of ABA/GA balance.J Exp Bot. 2020 Mar 25;71(6):1985-2004. doi: 10.1093/jxb/erz566. J Exp Bot. 2020. PMID: 31872216 Free PMC article.
-
Molecular Mechanisms Underlying Abscisic Acid/Gibberellin Balance in the Control of Seed Dormancy and Germination in Cereals.Front Plant Sci. 2018 May 23;9:668. doi: 10.3389/fpls.2018.00668. eCollection 2018. Front Plant Sci. 2018. PMID: 29875780 Free PMC article. Review.
References
-
- Bewley JD, Bradford K, Hilhorst H, Nonogaki H. Seeds: physiology of development, germination and dormancy. 3. New York: Springer-Verlag; 2013.
-
- Evers T, Millar S. Cereal grain structure and development: some implications for quality. J Cereal Sci. 2002;36:261–284. doi: 10.1006/jcrs.2002.0435. - DOI
-
- Wheat: The big picture. Available: http://www.cerealsdb.uk.net/cerealgenomics/WheatBP/Documents/DOC_WheatBP.... Accessed 20 Mar 2016.
MeSH terms
Substances
LinkOut - more resources
Full Text Sources
Other Literature Sources
