. 2017 Dec:163:160-176.
doi: 10.1016/j.neuroimage.2017.09.020. Epub 2017 Sep 13.

Replicability of time-varying connectivity patterns in large resting state fMRI samples

Affiliations

Replicability of time-varying connectivity patterns in large resting state fMRI samples

Anees Abrol et al. Neuroimage. 2017 Dec.

Abstract

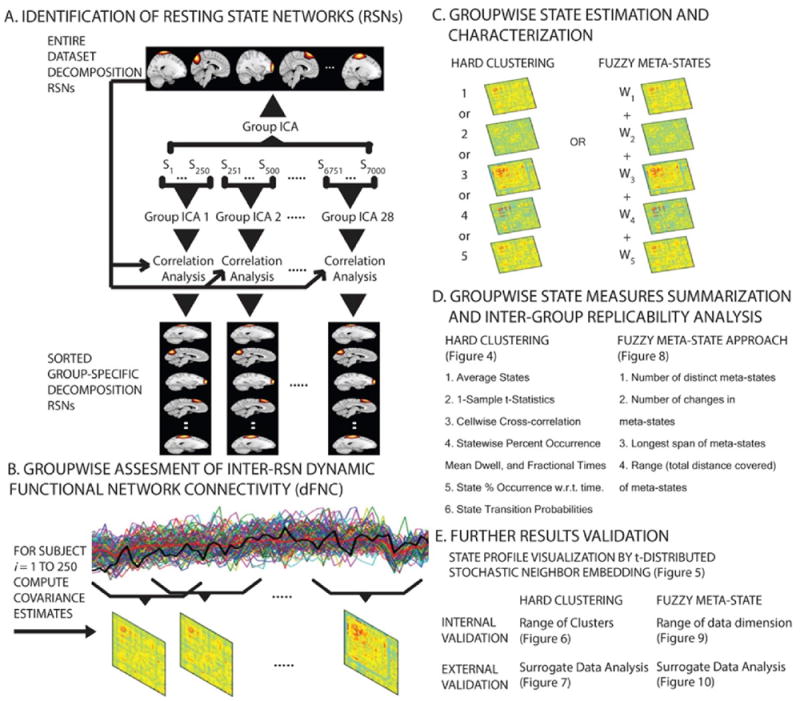
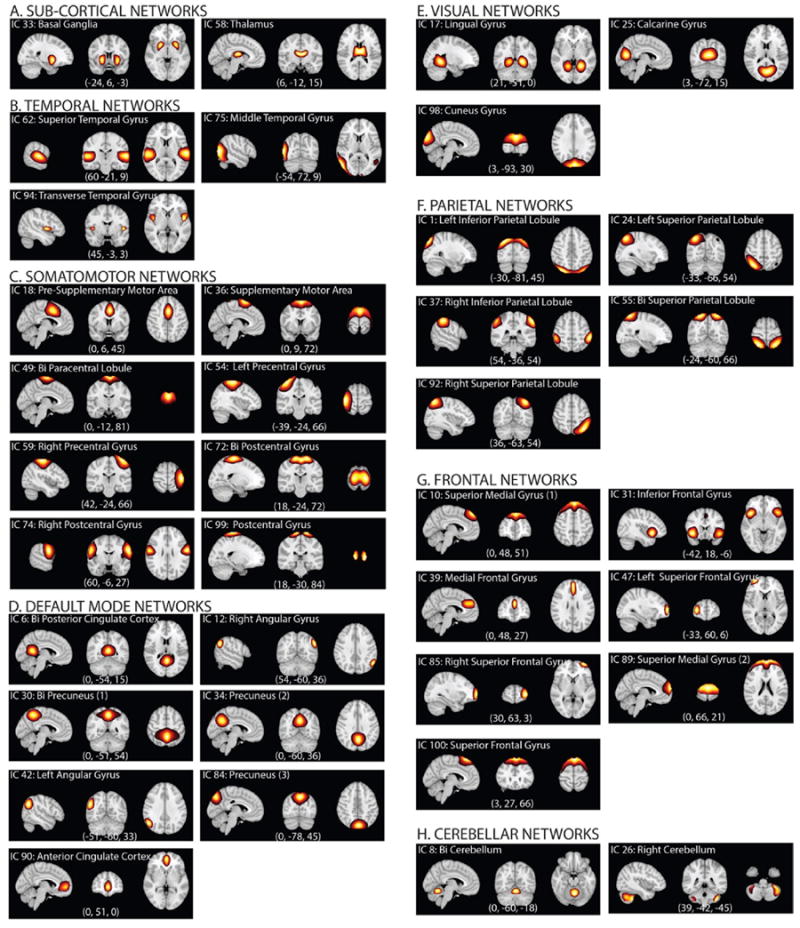
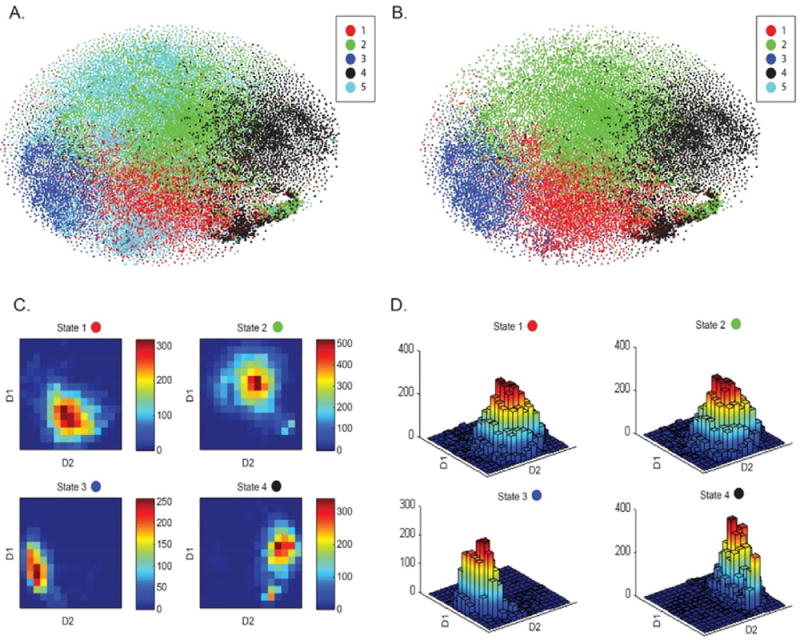
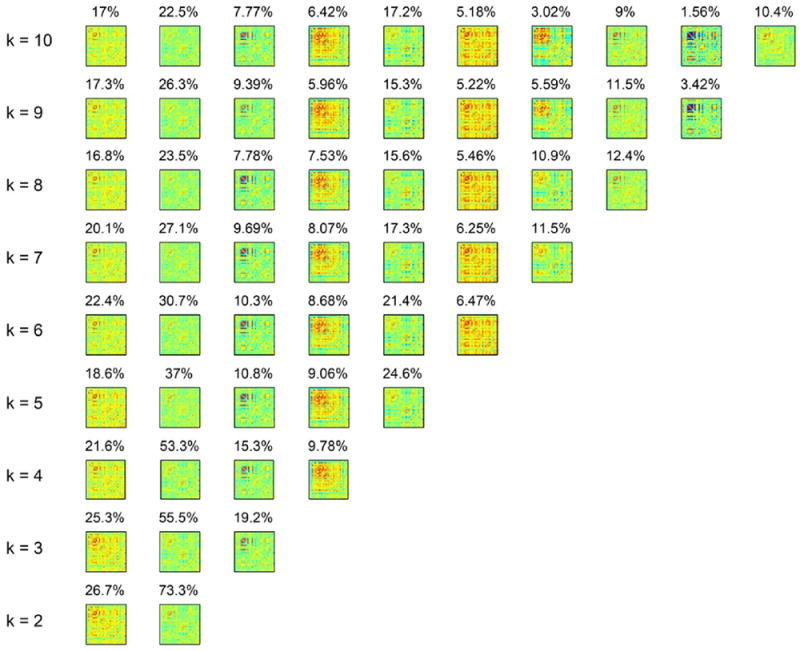
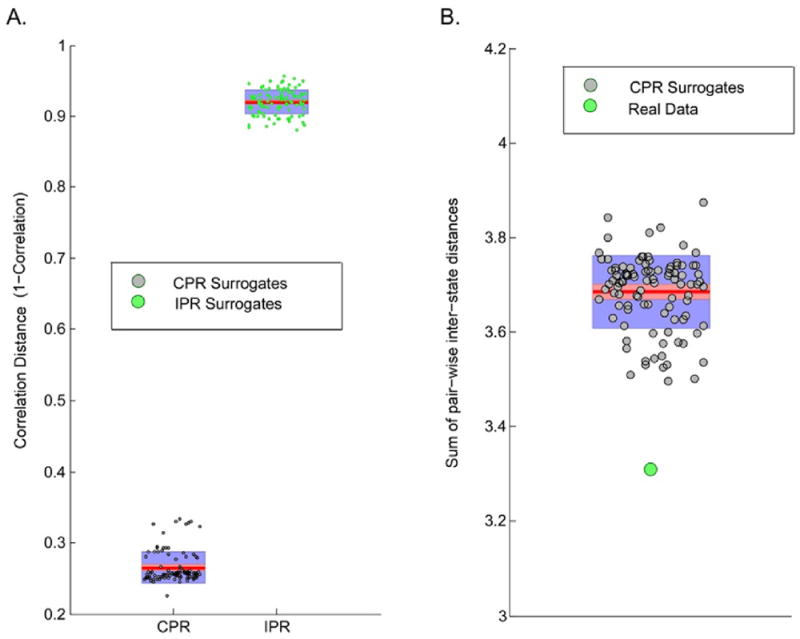
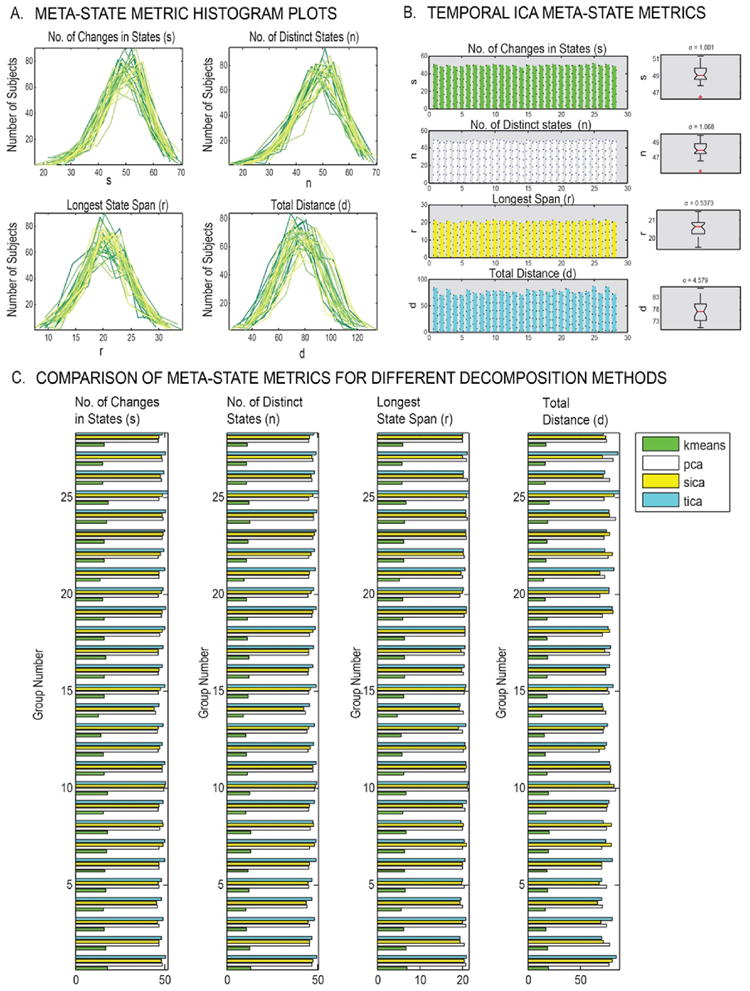
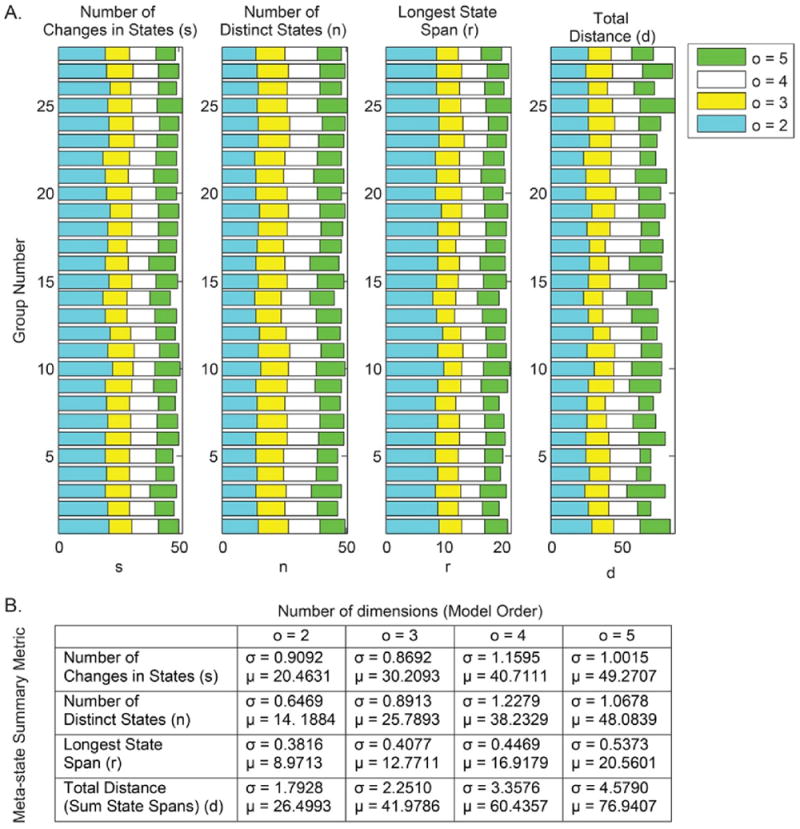
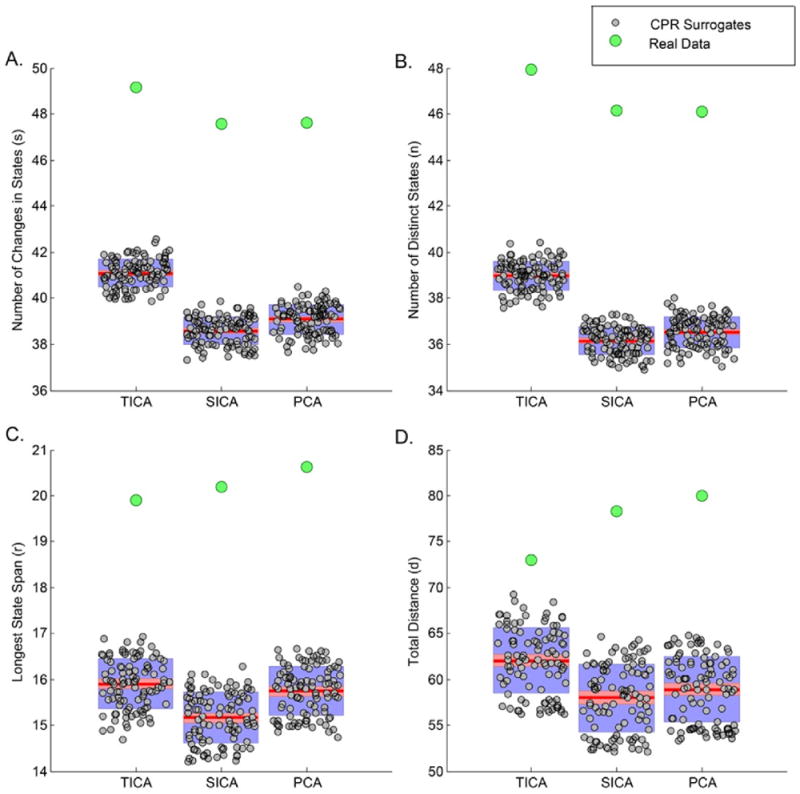
The past few years have seen an emergence of approaches that leverage temporal changes in whole-brain patterns of functional connectivity (the chronnectome). In this chronnectome study, we investigate the replicability of the human brain's inter-regional coupling dynamics during rest by evaluating two different dynamic functional network connectivity (dFNC) analysis frameworks using 7 500 functional magnetic resonance imaging (fMRI) datasets. To quantify the extent to which the emergent functional connectivity (FC) patterns are reproducible, we characterize the temporal dynamics by deriving several summary measures across multiple large, independent age-matched samples. Reproducibility was demonstrated through the existence of basic connectivity patterns (FC states) amidst an ensemble of inter-regional connections. Furthermore, application of the methods to conservatively configured (statistically stationary, linear and Gaussian) surrogate datasets revealed that some of the studied state summary measures were indeed statistically significant and also suggested that this class of null model did not explain the fMRI data fully. This extensive testing of reproducibility of similarity statistics also suggests that the estimated FC states are robust against variation in data quality, analysis, grouping, and decomposition methods. We conclude that future investigations probing the functional and neurophysiological relevance of time-varying connectivity assume critical importance.

Keywords: Dynamic functional connectivity; Fuzzy meta-state; Hard clustering; Replicability; Sliding window method; Surrogate testing.


Conflict of interest statement

The authors declare no competing financial interests.

Figures

Fig. 1
Fig. 1
Summary of the research methods. (A) 61 components from the Group Independent Component Analysis (GICA) on the entire dataset were identified as reference Resting State Networks (RSNs). The first 7000 datasets were partitioned into 28 age matched, independent groups each having 250 scans. All partitioned samples underwent GICA using the same parameters as the entire dataset GICA. Spatial maps and time-courses of the individual subjects were reconstructed for all decompositions. Networks across the decompositions were mapped onto the reference RSNs using a greedy spatial correlation analysis, and 37 components over a fixed threshold were retained for dFNC analysis. (B) The reconstructed time-courses went through additional processing to remove any probable noise sources and outliers. These processed time courses underwent dFNC analysis with a sliding window method thus resulting in emergence of inter-RSN covariance patterns for the different time windows. (C) To explore structure and frequency of the windowed connectivity patterns (CPs), recurring connectivity state profiles (SPs) were estimated and characterized using a hard-clustering approach (CPs clustered to map one of the recurring connectivity SPs), and a fuzzy meta-state approach (CPs decomposed into meta-states). (D) Sorted SPs were summarized deriving several similarity statistics in both approaches to evaluate replicability. (E) Results were validated using extensive internal (using the original fMRI data) as well as external (using synthesized surrogate datasets) validation methods in both approaches.
Fig. 2
Fig. 2
Resting State Networks (RSNs). Spatial maps of the 37 retained RSNs at the most activated sagittal, coronal and axial slices.
Fig. 3
Fig. 3
Optimal Clustering Analysis. (A) Elbow plot for a sample run; (B). Group-wise boxplots of the estimated optimal number of clusters over 10 independent runs. (B) The x-axis labels in Fig. 3b illustrate the number of runs for that particular group (out of a total of 10 runs) that estimated the optimal value of k equal to 5. In all, 241 out of the 280 independent runs estimated the optimal value of k equal to 5; hence, this value of k was validated as the optimal clustering case for the rest of the study.
Fig. 4
Fig. 4
State summary measures in the clustering approach. (A) SPs averaged over all groups; (B) 1-sample t-test results on the SPs; (C) 1-sample t-test results averaged over the domains; (D) Boxplots of pairwise linear correlations of the SPs; (E) Boxplots of average occurrence % of the SPs; (F) Boxplots of the average mean dwell times of the SPs; (G) Boxplots of average fractional times of the SPs; (H) Occurrence percentages of the SPs modelled w.r.t. time; and (I) Mean and std. deviation of average state transition probabilities (modelled as a first order Markov chain).
Fig. 5
Fig. 5
High-dimensional windowed FNC data projection onto a two-dimensional space using the t-distributed Stochastic Neighbor Embedding (tSNE) framework. (A) tSNE visualization of the windowed FNC data from all 28 groups suggests consistent clustering for states 1, 2, 3 and 4 for all groups, touching class boundaries and low degree of homogeneity for state 5. Additionally, from the state summary measures, State 5 was seen to be less reproducible as compared to the other 4 states. (B) tSNE visualization for states 1 to 4 for all groups confirms distinct (but touching) clustering regions for these different data classes. (C) and (D) Class conditional densities for the states 1 to 4 in 2 dimensions (Fig. 5C) and 3 dimensions (Fig. 5D) reveal distinct peaks for all 4 classes thus validating the structure in the data.
Fig. 6
Fig. 6
Internal validation in the hard-clustering approach. Clustering results for a range of number of clusters (k = 2 to 10) demonstrate high similarity of the emergent state profiles.
Fig. 7
Fig. 7
External Validation in the hard-clustering approach. (A). SPs emergent from clustering windowed FNC data corresponding to real fMRI data exhibit high correlation with SPs from similar analysis on 100 synthesized surrogate datasets of RSN time-courses with consistent phase randomization (CPR) and low correlation in case of inconsistent phase randomization (IPR); and (B) Observed sum of pair-wise inter-state distances in real data in comparison to the null distribution of this test statistic approximated from 100 CPR surrogate datasets.
Fig. 8
Fig. 8
State summary measures in the meta-state approach. (A) Histogram plots of the estimated subject-specific temporal ICA meta-state metrics demonstrate similar distributions across all groups; (B) Boxplots of group-wise averages of temporal ICA meta-state metrics indicate low variation in group summary metrics; (C) Similarity of group summary metrics across different groups within and across different decomposition methods. Notably, the metrics are consistent across groups in k-means, but different from other methods since k-means uses only 4 discrete states (1–4), as compared to other methods that use 8 states (−4 to −1 and 1 to 4).
Fig. 9
Fig. 9
Internal Validation in the meta-states approach. (A) Sensitivity test of number of dimensions (o = 2 to 5) to the meta-states framework validates similarity in group summary measures; (B) Averaged metrics are consistent across groups, but increase with model order as range of meta-states is proportional to model order.
Fig. 10
Fig. 10
External validation in the meta-states approach. Meta-state metrics corresponding to real fMRI data were observed to fall outside the respective null distributions generated from meta-state metrics corresponding to 100 CPR surrogate datasets of RSN time-courses. Results for the temporal ICA, spatial ICA and PCA decomposition methods are shown; similar result was observed for k-means decomposition method.

Similar articles

Cited by

References

    1. Abrol A, Chaze C, Damaraju E, Calhoun VD. The chronnectome: replicability of dynamic connectivity patterns in 7500 resting fmri datasets. IEEE Engineering in Medicine and Biology Society. 2016:5571–5574. - PubMed
    1. Allen EA, Erhardt EB, Damaraju E, Gruner W, Segall JM, Silva RF, Havlicek M, Rachakonda S, Fries J, Kalyanam R, Michael AM, Caprihan A, Turner JA, Eichele T, Adelsheim S, Bryan AD, Bustillo J, Clark VP, Feldstein Ewing SW, Filbey F, Ford CC, Hutchison K, Jung RE, Kiehl KA, Kodituwakku P, Komesu YM, Mayer AR, Pearlson GD, Phillips JP, Sadek JR, Stevens M, Teuscher U, Thoma RJ, Calhoun VD. A baseline for the multivariate comparison of resting state networks. Front Syst Neurosci. 2011;5 - PMC - PubMed
    1. Allen EA, Damaraju E, Plis SM, Erhardt EB, Eichele T, Calhoun VD. Tracking whole-brain connectivity dynamics in the resting state. Cereb Cortex 2012a - PMC - PubMed
    1. Allen EA, Erhardt EB, Wei Y, Eichele T, Calhoun VD. Capturing intersubject variability with group independent component analysis of fMRI data: a simulation study. NeuroImage. 2012b;59(4):4141–4159. - PMC - PubMed
    1. Allen EA, Damaraju E, Eichele T, Wu L, Calhoun VD. EEG signatures of dynamic functional network connectivity states. Brain Topogr. 2017:1–16. - PMC - PubMed

Publication types