Human Plasma Metabolomics Study across All Stages of Age-Related Macular Degeneration Identifies Potential Lipid Biomarkers
- PMID: 28916333
- PMCID: PMC8077680
- DOI: 10.1016/j.ophtha.2017.08.008
Human Plasma Metabolomics Study across All Stages of Age-Related Macular Degeneration Identifies Potential Lipid Biomarkers
Abstract
Purpose: To characterize the plasma metabolomic profile of patients with age-related macular degeneration (AMD) using mass spectrometry (MS).
Design: Cross-sectional observational study.
Participants: We prospectively recruited participants with a diagnosis of AMD and a control group (>50 years of age) without any vitreoretinal disease.
Methods: All participants underwent color fundus photography, used for AMD diagnosis and staging, according to the Age-Related Eye Disease Study classification scheme. Fasting blood samples were collected and plasma was analyzed by Metabolon, Inc. (Durham, NC), using ultrahigh-performance liquid chromatography (UPLC) and high-resolution MS. Metabolon's hardware and software were used to identify peaks and control quality. Principal component analysis and multivariate regression were performed to assess differences in the metabolomic profiles of AMD patients versus controls, while controlling for potential confounders. For biological interpretation, pathway enrichment analysis of significant metabolites was performed using MetaboAnalyst.
Main outcome measures: The primary outcome measures were levels of plasma metabolites in participants with AMD compared with controls and among different AMD severity stages.
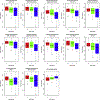
Results: We included 90 participants with AMD (30 with early AMD, 30 with intermediate AMD, and 30 with late AMD) and 30 controls. Using UPLC and MS, 878 biochemicals were identified. Multivariate logistic regression identified 87 metabolites with levels that differed significantly between AMD patients and controls. Most of these metabolites (82.8%; n = 72), including the most significant metabolites, belonged to the lipid pathways. Analysis of variance revealed that of the 87 metabolites, 48 (55.2%) also were significantly different across the different stages of AMD. A significant enrichment of the glycerophospholipids pathway was identified (P = 4.7 × 10⁻⁹) among these metabolites.
Conclusions: Participants with AMD have altered plasma metabolomic profiles compared with controls. Our data suggest that the most significant metabolites map to the glycerophospholipid pathway. These findings have the potential to improve our understanding of AMD pathogenesis, to support the development of plasma-based metabolomics biomarkers of AMD, and to identify novel targets for treatment of this blinding disease.
Copyright © 2017 American Academy of Ophthalmology. Published by Elsevier Inc. All rights reserved.
Figures


Comment in
-
Re: Laíns et al.: Human plasma metabolomics study across all stages of age-related macular degeneration identifies potential lipid biomarkers (Ophthalmology. 2018;125:245-254).Ophthalmology. 2018 Jul;125(7):e45-e46. doi: 10.1016/j.ophtha.2018.02.025. Ophthalmology. 2018. PMID: 29935673 No abstract available.
-
Reply.Ophthalmology. 2018 Jul;125(7):e46-e47. doi: 10.1016/j.ophtha.2018.02.026. Ophthalmology. 2018. PMID: 29935675 No abstract available.
References
-
- Wong WL, Su X, Li X, et al. Global prevalence of age-related macular degeneration and disease burden projection for 2020 and 2040: a systematic review and meta-analysis. Lancet Glob Heal. 2014;2(2):e106–e116. - PubMed
Publication types
MeSH terms
Substances
Grants and funding
LinkOut - more resources
Full Text Sources
Other Literature Sources

