Kinetic stability and sequence/structure studies of urine-derived Bence-Jones proteins from multiple myeloma and light chain amyloidosis patients
- PMID: 28916410
- PMCID: PMC5626661
- DOI: 10.1016/j.bpc.2017.08.011
Kinetic stability and sequence/structure studies of urine-derived Bence-Jones proteins from multiple myeloma and light chain amyloidosis patients
Abstract
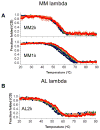
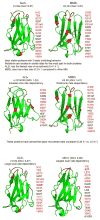
It is now accepted that the ability of a protein to form amyloid fibrils could be associated both kinetic and thermodynamic protein folding parameters. A recent study from our laboratory using recombinant full-length (encompassing the variable and constant domain) immunoglobulin light chains found a strong kinetic control of the protein unfolding for these proteins. In this study, we are extending our analysis by using urine-derived Bence Jones proteins (BJPs) from five patients with light chain (AL) amyloidosis and four patients with multiple myeloma (MM). We observed lower stability in κ proteins compared to λ proteins (for both MM and AL proteins) in agreement with previous studies. The kinetic component of protein stability is not a universal feature of BJPs and the hysteresis observed during refolding reactions could be attributed to the inability of the protein to refold all domains. The most stable proteins exhibited 3-state unfolding transitions. While these proteins do not refold reversibly, partial refolding shows 2-state partial refolding transitions, suggesting that one of the domains (possibly the variable domain) does not refold completely. Sequences were aligned with their respective germlines and the location and nature of the mutations were analyzed. The location of the mutations were analyzed and compared with the stability and amyloidogenic properties for the proteins in this study, increasing our understanding of light chain unfolding and amyloidogenic potential.
Keywords: Bence-Jones; Circular dichroism; Kinetic stability; Light chain amyloidosis; Protein aggregation; Thermal unfolding.
Copyright © 2017 Elsevier B.V. All rights reserved.
Figures


Similar articles
-
Effect of lysine modification on the stability and cellular binding of human amyloidogenic light chains.Biochim Biophys Acta. 2011 Jan;1812(1):32-40. doi: 10.1016/j.bbadis.2010.07.022. Epub 2010 Aug 6. Biochim Biophys Acta. 2011. PMID: 20692337
-
Biochemical and aggregation analysis of Bence Jones proteins from different light chain diseases.Amyloid. 2008 Mar;15(1):29-39. doi: 10.1080/13506120701815324. Amyloid. 2008. PMID: 18266119 Free PMC article.
-
Structural analysis of the amyloidogenic kappa Bence Jones protein (FUR).Amyloid. 1999 Jun;6(2):77-88. doi: 10.3109/13506129909007307. Amyloid. 1999. PMID: 10439113
-
Tetramer Bence Jones protein in the immunoproliferative diseases. Angioimmunoblastic lymphadenopathy, primary amyloidosis, and multiple myeloma.Am J Clin Pathol. 1989 Jun;91(6):639-46. doi: 10.1093/ajcp/91.6.639. Am J Clin Pathol. 1989. PMID: 2499179 Review.
-
Amyloid arthropathy mimicking seronegative rheumatoid arthritis in multiple myeloma: case reports and review of the literature.Amyloid. 2009 Dec;16(4):226-31. doi: 10.3109/13506120903421785. Amyloid. 2009. PMID: 19922335 Review.
Cited by
-
Amyloidogenic immunoglobulin light chain kinetic stabilizers comprising a simple urea linker module reveal a novel binding sub-site.Bioorg Med Chem Lett. 2022 Mar 15;60:128571. doi: 10.1016/j.bmcl.2022.128571. Epub 2022 Jan 19. Bioorg Med Chem Lett. 2022. PMID: 35065233 Free PMC article.
-
Discovery of Potent Coumarin-Based Kinetic Stabilizers of Amyloidogenic Immunoglobulin Light Chains Using Structure-Based Design.J Med Chem. 2021 May 13;64(9):6273-6299. doi: 10.1021/acs.jmedchem.1c00339. Epub 2021 May 3. J Med Chem. 2021. PMID: 33939422 Free PMC article.
-
A functional assay to identify amyloidogenic light chains.Amyloid. 2018 Jun;25(2):93-100. doi: 10.1080/13506129.2018.1456425. Epub 2018 Mar 23. Amyloid. 2018. PMID: 29571269 Free PMC article.
-
Immunoglobulin light chain amyloid aggregation.Chem Commun (Camb). 2018 Sep 20;54(76):10664-10674. doi: 10.1039/c8cc04396e. Chem Commun (Camb). 2018. PMID: 30087961 Free PMC article. Review.
-
Role of the mechanisms for antibody repertoire diversification in monoclonal light chain deposition disorders: when a friend becomes foe.Front Immunol. 2023 Jul 13;14:1203425. doi: 10.3389/fimmu.2023.1203425. eCollection 2023. Front Immunol. 2023. PMID: 37520549 Free PMC article. Review.
References
-
- Sipe JD, et al. Amyloid fibril proteins and amyloidosis: chemical identification and clinical classification International Society of Amyloidosis 2016 Nomenclature Guidelines. Amyloid: the international journal of experimental and clinical investigation: the official journal of the International Society of Amyloidosis. 2016;23(4):209–213. doi: 10.1080/13506129.2016.1257986. - DOI - PubMed
-
- Glenner GG, et al. Physical and chemical properties of amyloid fibers. II. Isolation of a unique protein constituting the major component from human splenic amyloid fibril concentrates. The journal of histochemistry and cytochemistry: official journal of the Histochemistry Society. 1969;17(12):769–80. - PubMed
MeSH terms
Substances
Grants and funding
LinkOut - more resources
Full Text Sources
Other Literature Sources
Medical

