. 2017 Dec:113:1-15.
doi: 10.1016/j.freeradbiomed.2017.09.007. Epub 2017 Sep 13.

Down-regulation of NOX2 activity in phagocytes mediated by ATM-kinase dependent phosphorylation

Affiliations

Down-regulation of NOX2 activity in phagocytes mediated by ATM-kinase dependent phosphorylation

Sylvain Beaumel et al. Free Radic Biol Med. 2017 Dec.

Abstract

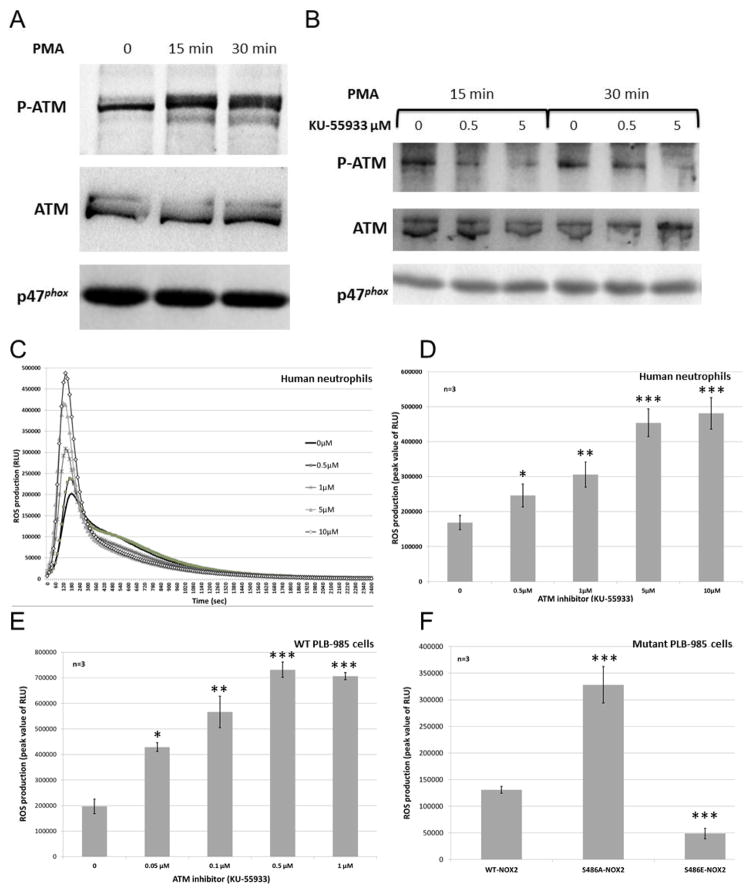
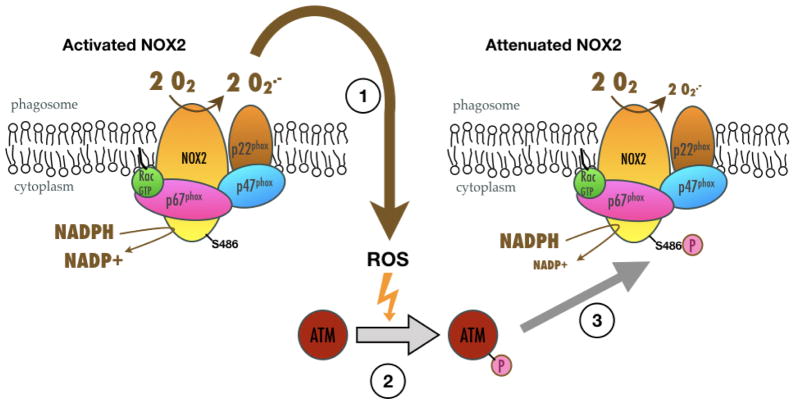
NADPH oxidases (NOX) have many biological roles, but their regulation to control production of potentially toxic ROS molecules remains unclear. A previously identified insertion sequence of 21 residues (called NIS) influences NOX activity, and its predicted flexibility makes it a good candidate for providing a dynamic switch controlling the NOX active site. We constructed NOX2 chimeras in which NIS had been deleted or exchanged with those from other NOXs (NIS1, 3 and 4). All contained functional heme and were expressed normally at the plasma membrane of differentiated PLB-985 cells. However, NOX2-ΔNIS and NOX2-NIS1 had neither NADPH-oxidase nor reductase activity and exhibited abnormal translocation of p47phox and p67phox to the phagosomal membrane. This suggested a functional role of NIS. Interestingly after activation, NOX2-NIS3 cells exhibited superoxide overproduction compared with wild-type cells. Paradoxically, the Vmax of purified unstimulated NOX2-NIS3 was only one-third of that of WT-NOX2. We therefore hypothesized that post-translational events regulate NOX2 activity and differ between NOX2-NIS3 and WT-NOX2. We demonstrated that Ser486, a phosphorylation target of ataxia telangiectasia mutated kinase (ATM kinase) located in the NIS of NOX2 (NOX2-NIS), was phosphorylated in purified cytochrome b558 after stimulation with phorbol 12-myristate-13-acetate (PMA). Moreover, ATM kinase inhibition and a NOX2 Ser486Ala mutation enhanced NOX activity whereas a Ser486Glu mutation inhibited it. Thus, the absence of Ser486 in NIS3 could explain the superoxide overproduction in the NOX2-NIS3 mutant. These results suggest that PMA-stimulated NOX2-NIS phosphorylation by ATM kinase causes a dynamic switch that deactivates NOX2 activity. We hypothesize that this downregulation is defective in NOX2-NIS3 mutant because of the absence of Ser486.

Keywords: Ataxia telangiectasia mutated (ATM); NADPH oxidase; NOX; NOX-specific Insertion Sequence (NIS); Neutrophil; Phosphorylation.


Conflict of interest statement

Conflict of interest

The authors declare that they have no conflicts of interest with the contents of this article.

Figures

Fig. 1
Fig. 1. Representation of the new three-dimensional homology model of the cytosolic dehydrogenase domain of NOX2
A) Structure-based sequence alignment including individual sequences of crystallized dehydrogenase domain homologs of the FNR family (identified with PDB ids), and sequence logos of mammalian NOX subfamilies. Blue bar indicates a conserved beta strand; red bars indicate conserved alpha helices. Black Bracket indicates the approximate extent of the NOX Insertion Sequence (NIS). * indicates the location of Ser486 and the ATM phosphorylation site SQ in the NIS is underlined. Logos were obtained from alignments of 20 mammalian NOX1 sequences, 28 NOX2, 30 NOX3, and 28 NOX4 as described in Experimental Procedures. B) NOX2 DH domain homology model from Taylor et al [25], represented in blue ribbons, except the NOX2NIS highlighted in gold. Approximate locations of FAD (yellow sticks) and NADPH (gray sticks). C) Our improved NOX2 DH model is represented as ribbons, dark green for the NADPH binding domain -corresponding to the 3A1F structure- and pale green for the FAD binding domain. NOX2-NIS is again in gold color. Side chains of critical residues for cytosolic factor interactions (D484, H490, D500) and for phosphorylation by ATM kinase (Ser486) are shown in stick representation. Molecular graphic images were produced using PyMOL software. (2-column fitting image).
Fig. 2
Fig. 2. Cell surface expression of the wild type and mutated NOX2 proteins in transfected X-CGD PLB-985 cells
A) Mutagenesis of the α helix(484–504) of NOX2 (NOX2-NIS) - The wild type amino acid sequence of the NOX2-NIS is on the top line. The mutations introduced in this sequence are shown in shaded boxes. The black squares indicate the amino acid residues that are identical to the wild type sequence whereas the dashes correspond to the NOX2 amino acids deleted in the mutant sequences. Amino acids D484, H490 and D500 described as essential for assembly with the cytosolic factors are underlined. B) Flow cytometry analysis of NOX2 expression –Differentiated transfected X-CGD PLB-985 cells (5.105) were incubated with the NOX2 monoclonal antibody 7D5, combined with a PE-conjugated anti-mouse IgG, as described in “the experimental procedures”. Mouse IgG1 isotype was used as an irrelevant monoclonal antibody. C) Immunoblot analysis of both subunits of cytochrome b558, NOX2 and p22phox, was performed in 1 % Triton X-100 (v/v) soluble extract (80 μg) from PLB-985 mutant cells, subjected to SDS-PAGE, blotted onto a nitrocellulose sheet and revealed with monoclonal antibodies 54.1 and 44.1, respectively. D) Cytochrome b558 differential spectra performed with the same detergent extracts as described in C, were recorded at room temperature with a DU 640 Beckman spectrophotometer. MW, molecular weight markers (kDa) (1.5-column fitting image).
Fig. 3
Fig. 3. Cytosolic factors translocation to the phagosomal membrane in transfected PLB-985 cells stimulated by latex beads
P47phox and p67phox translocation to the phagosomal membranes were evaluated by confocal microscopy analysis in 5. 105 wild type or mutated PLB-985 cells stimulated by PMA-treated latex beads for 15 min at 37 °C as described in “the experimental procedures”. NOX2 cells represent the positive control and XCGD cells represent the negative control of p47phox and p67phox translocation to the phagosomal membranes. The + indicates normal cytosolic factor translocation while − indicates absence of cytosolic factor translocation to the phagosomal membrane. Scale bar is 10 μm. These results are representative of observations obtained in at least four independent experiments. (2-column fitting image).
Fig. 4
Fig. 4. Purification of cytochromes b558 from transfected PLB-985 cells
A) Silver-stained SDS PAGE of purified WT-NOX2 and NOX2-NIS3 cytochromes b558 (30 picomol) and immunoblot analysis of both subunits of purified cytochromes b558 performed with 1.5 picomol of purified cytochromes b558 using 54.1 and 44.1 monoclonal antibodies directed against NOX2 and p22phox respectively. The intermediate band revealed by the 44.1 antibody is probably a dimer of p22phox. B) Differential spectrum analysis of purified cytochromes b558. The reduced-minus-oxidized difference spectra were recorded at room temperature with a DU 640 Beckman spectrophotometer. C) Purification factors and yields of the purification process of WT and NOX2-NIS3 cytochrome b558. D) Kinetic parameters of the purified WT-NOX2 and NOX2-NIS3 cytochromes b558. NADPH oxidase activity was reconstituted in a cell-free system assay using purified WT or NOX2-NIS3 cytochromes b558 (5 nM), recombinant cytosolic proteins p47phox, p67phox and Rac1 (1 μM each), in the presence of NADPH (150 μM). Kinetic parameters were determined by varying the concentration of one parameter keeping the others at a saturating level. The data represent average ± SD of at least three independent experiments. The statistical significances of the differences were evaluated by the non-parametric Mann–Whitney test. *p<0.05. MW, molecular weight markers (kDa). (1.5-column fitting image).
Fig. 5
Fig. 5. LC-MS/MS analysis of peptide NNAGFLSYNIYLTGWDESphQANHFAVHHDEEKDVITGLK from NOX2 phosphorylated on Ser486
Briefly 1×10⁸ PLB-985 cells/ml treated by 5μM cytochalasin B for 15 min at 37°C were stimulated by PMA (0.5μg) during 10 min at 37°C. Cytochrome b558 was purified as described in “the experimental procedures”. A) HCD spectrum from the precursor ion 883.406Th in the 5+ charge state obtained at 97.2 min. This spectrum was scored 108 by Mascot and confidence on phosphosite specific assignment was 100%. Fragment ions matching with the theoretical spectrum are annotated. This peptide was identified only in activated cells. B) Extracted ion chromatogram of m/z 883.406Th both in resting and PMA activated differentiated WT-NOX2 PLB-985 cells. (2-column fitting image).
Fig. 6
Fig. 6. MS/MS analysis of peptides ERPQIGGTphIK and QPPSphNPPPRPPAEAR from p22phox phosphorylated on Thr147 and Ser153 respectively
Briefly 1×10⁸ PLB-985 cells/ml treated by 5μM cytochalasin B for 15 min at 37°C were stimulated by PMA (0.5μg) during 10 min at 37°C. Then cytochrome b558 purification was done as described in “the experimental procedures”. A) HCD spectrum from the precursor ion 589.80Th in the 2+ charge state obtained at 18 min. This spectrum was scored 37 by Mascot. Fragment ions matching with the theoretical spectrum are annotated. This peptide was identified only in activated cells. B) Extracted ion chromatogram of m/z 589.80Th both in resting and PMA activated differentiated WT-NOX2 PLB-985 cells. C) HCD spectrum from the precursor ion 564.27Th in the 3+ charge state obtained at 16.2min. This spectrum was scored 26 by Mascot. Fragment ions matching with the theoretical spectrum are annotated. Multiple spectra were acquired both in resting and activated samples. D) Extracted ion chromatogram of m/z 564.27Th both in resting and PMA activated differentiated WT-NOX2 PLB-985 cells. (2-column fitting image).
Fig. 7
Fig. 7. Effect of ATM inhibition on the NADPH oxidase activity in human phagocytes
A) Western blot analysis of ATM phosphorylation (Ser1981) in 5.106 human neutrophils during the time course of PMA activation (20 ng/ml) for 15 or 30 min. Soluble extracts (100 μg of protein) in RIPA buffer (Thermo Fischer Scientific, Courtaboeuf, France) were subjected to SDS-PAGE, blotted onto a nitrocellulose sheet and visualized with polyclonal antibodies against ATM, phospho-ATM and monoclonal antibodies against p47phox. Blot is representative of 4 independent experiments. B) Western blot analysis of the inhibition of ATM phosphorylation in human neutrophils pre-incubated for 15 min with KU-55933 (0.5 and 5 μM) and then activated with PMA (20 ng/ml) for 15 or 30 min. Blot is representative of 3 independent experiments. C) Kinetics of ROS production by human neutrophils (5.105) pre-incubated with the ATM inhibitor KU-55933 (0.5 μM to 10 μM) and activated by PMA (80 ng/ml) for 60 min. The NADPH oxidase activity is expressed as the peak value of relative luminescence units (RLU) measured in 15 min from human neutrophils (D) or differentiated WT-NOX2 PLB-985 cells. (E). The data represent average ± SD of at least 3 independent experiments. F) ROS production expressed as the peak values of RLU measured in 15 min was measured by luminol-amplified chemiluminescence for 60 min in 5.105 differentiated WT-NOX2, Ser486Ala-NOX2 and Ser486Glu-NOX2 PLB-985 cells after PMA stimulation. Values represent the mean ± SD of at least 3 independent experiments. The statistical significances of the differences of NADPH oxidase activity in presence of KU-55933 vs. the control absence of KU-55933 were evaluated by the Student test. *p<0.05, **p<0.01 and ***p<0.0001. (1.5-column fitting image).
Fig. 8
Fig. 8. Regulation of ROS production in neutrophil by ATM activation
The NADPH oxidase complex is activated after PMA stimulation leading to the phosphorylation of cytosolic factors and p22phox subunits by PKC (on Thr147) and other kinases for optimal assembly of the complex. The activated NADPH oxidase complex can produce ROS in large quantities (step 1). In order to protect the cell from DNA damage, ROS can activate ATM kinase by autophosphorylation (step 2) which in turn phosphorylates Ser486 in the NIS of NOX2 (step 3). The consequence is a conformational change in NOX2 leading to a decrease in ROS production. (1.5-column fitting image).

Similar articles

Cited by

References

    1. Bedard K, Krause KH. The NOX family of ROS-generating NADPH oxidases: physiology and pathophysiology. Physiol Rev. 2007;87:245–313. - PubMed
    1. Nisimoto Y, Jackson HM, Ogawa H, Kawahara T, Lambeth JD. Constitutive NADPH-dependent electron transferase activity of the Nox4 dehydrogenase domain. Biochemistry. 2010;49:2433–2442. - PMC - PubMed
    1. Lambeth JD. Nox enzymes, ROS, and chronic disease: an example of antagonistic pleiotropy. Free Radic Biol Med. 2007;43:332–347. - PMC - PubMed
    1. Paravicini TM, Touyz RM. NADPH oxidases, reactive oxygen species, and hypertension: clinical implications and therapeutic possibilities. Diabetes Care. 2008;31(Suppl 2):S170–180. - PubMed
    1. Frey RS, Ushio-Fukai M, Malik AB. NADPH oxidase-dependent signaling in endothelial cells: role in physiology and pathophysiology. Antioxid Redox Signal. 2009;11:791–810. - PMC - PubMed

Publication types

LinkOut - more resources