. 2018 Jan 10;38(2):263-277.
doi: 10.1523/JNEUROSCI.0322-17.2017. Epub 2017 Sep 15.

Behavioral, Modeling, and Electrophysiological Evidence for Supramodality in Human Metacognition

Affiliations

Behavioral, Modeling, and Electrophysiological Evidence for Supramodality in Human Metacognition

Nathan Faivre et al. J Neurosci. .

Abstract

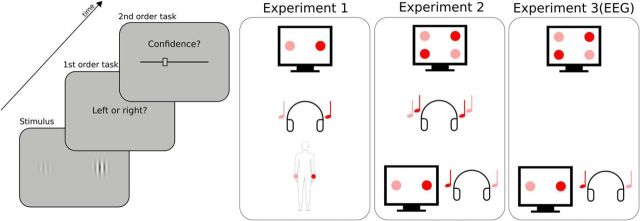
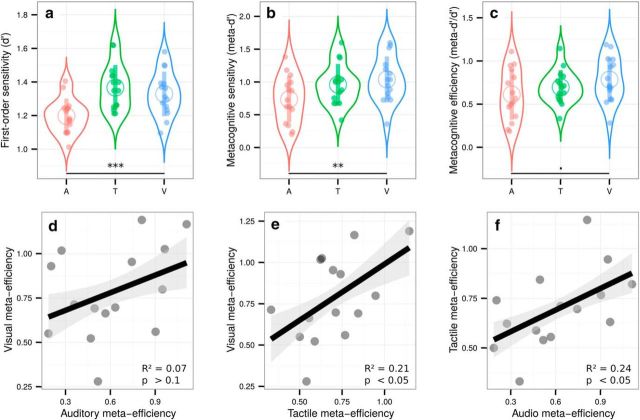
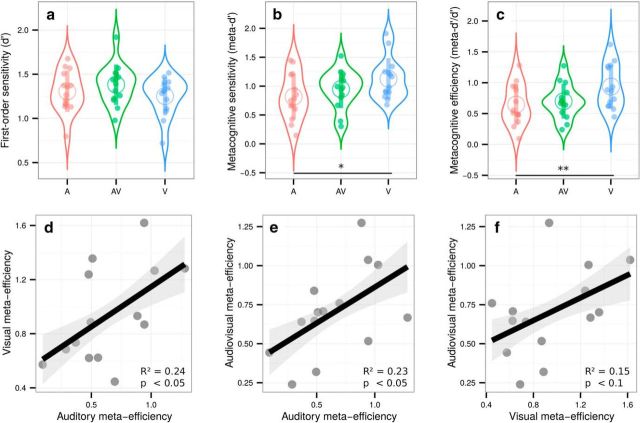
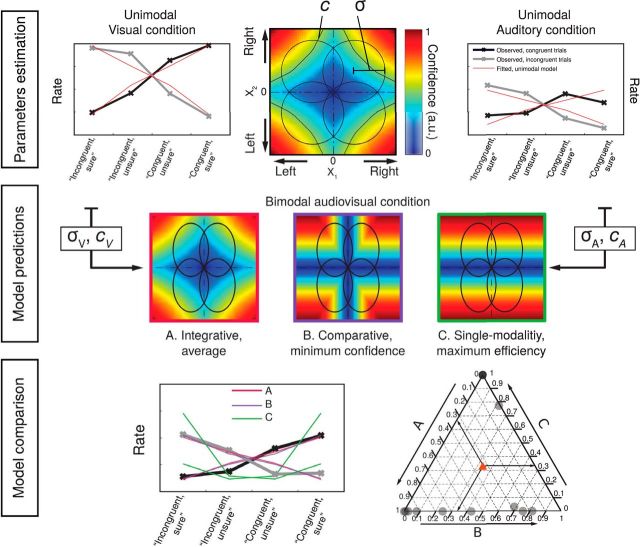
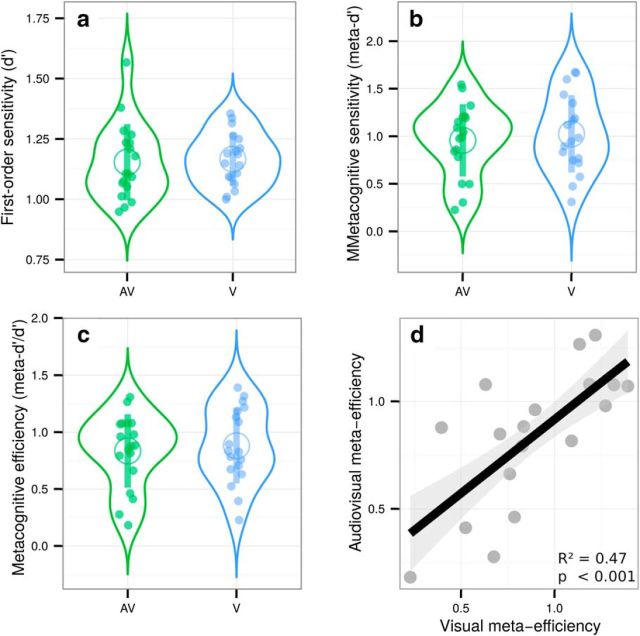
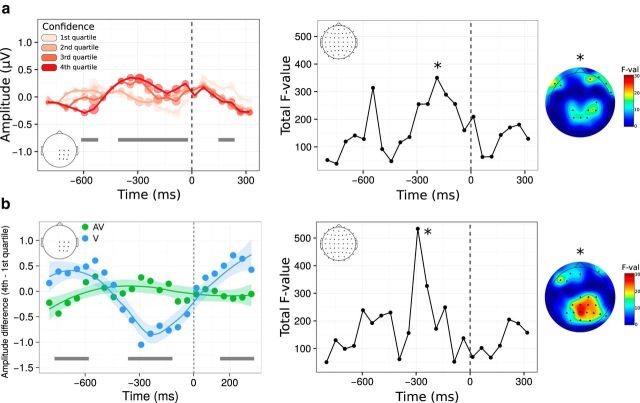
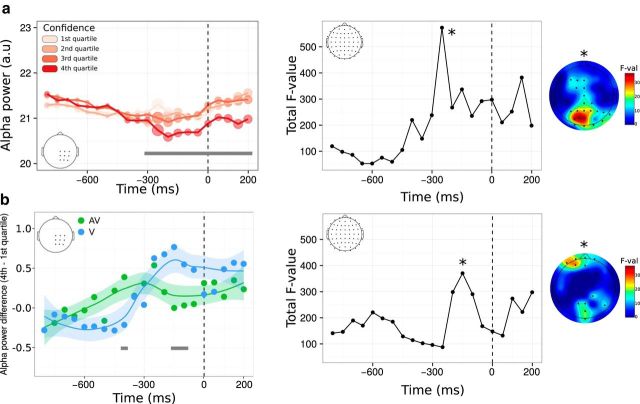
Human metacognition, or the capacity to introspect on one's own mental states, has been mostly characterized through confidence reports in visual tasks. A pressing question is to what extent results from visual studies generalize to other domains. Answering this question allows determining whether metacognition operates through shared, supramodal mechanisms or through idiosyncratic, modality-specific mechanisms. Here, we report three new lines of evidence for decisional and postdecisional mechanisms arguing for the supramodality of metacognition. First, metacognitive efficiency correlated among auditory, tactile, visual, and audiovisual tasks. Second, confidence in an audiovisual task was best modeled using supramodal formats based on integrated representations of auditory and visual signals. Third, confidence in correct responses involved similar electrophysiological markers for visual and audiovisual tasks that are associated with motor preparation preceding the perceptual judgment. We conclude that the supramodality of metacognition relies on supramodal confidence estimates and decisional signals that are shared across sensory modalities.SIGNIFICANCE STATEMENT Metacognitive monitoring is the capacity to access, report, and regulate one's own mental states. In perception, this allows rating our confidence in what we have seen, heard, or touched. Although metacognitive monitoring can operate on different cognitive domains, we ignore whether it involves a single supramodal mechanism common to multiple cognitive domains or modality-specific mechanisms idiosyncratic to each domain. Here, we bring evidence in favor of the supramodality hypothesis by showing that participants with high metacognitive performance in one modality are likely to perform well in other modalities. Based on computational modeling and electrophysiology, we propose that supramodality can be explained by the existence of supramodal confidence estimates and by the influence of decisional cues on confidence estimates.

Keywords: EEG; audiovisual; confidence; metacognition; signal detection theory; supramodality.


Figures

Figure 1.
Figure 1.
Experimental procedure. Participants had to perform a perceptual task on a stimulus (first-order task) and then indicate their confidence in their response by placing a cursor on a visual analog scale (second-order task). The types of stimuli and first-order task varied across conditions and experiments, as represented schematically on the right. In Experiment 1, a pair of two images, sounds, or tactile vibrations was presented on each trial. The stimuli of each pair were lateralized and differed in intensity (here, high intensity is depicted in red, low intensity in pink). The first-order task was to indicate whether the most intense stimulus was located on the right (as depicted here) or left side. In Experiment 2, either two pairs of two images (unimodal visual condition), two sounds (unimodal auditory condition), or one pair of two images with one pair of two sounds (bimodal audiovisual condition) were presented on each trial. The first-order task was to indicate whether the most intense stimulus of each pair were both on the same side (congruent trial) or each on a different side (incongruent trial, as depicted here). Experiment 3 was a replication of Experiment 2 including EEG recordings, focusing on the unimodal visual condition and the bimodal audiovisual condition. The order of conditions within each experiment was counterbalanced across participants.
Figure 2.
Figure 2.
Top, Violin plots representing first-order sensitivity (a: d′), metacognitive sensitivity (b: meta-d′), and metacognitive efficiency (c: meta-d′/d′) in the auditory (A, in red), tactile (T, in green), and visual modalities (V, in blue). Full dots represent individual data points. Empty circles represent average estimates. Error bars indicate SD. The results show that, independently of first-order performance, metacognitive efficiency is higher in vision compared with audition. Bottom, Correlations between individual metacognitive efficiencies in the visual and auditory conditions (d), visual and tactile conditions (e), and tactile and auditory conditions (f). The results show that metacognitive efficiency correlates across sensory modalities, providing evidence in favor of the supramodality hypothesis. **p < 0.01, ***p < 0.001, •p < 0.1.
Figure 3.
Figure 3.
Top, Violin plots representing first-order sensitivity (a: d′), metacognitive sensitivity (b: meta-d′), and metacognitive efficiency (c: meta-d′/d′) in the auditory (A, in red), audiovisual (AV, in green), and visual (V, in blue) modalities. Full dots represent individual data points. Empty circles represent average estimates. Error bars indicate SD. The results show that, independently of first-order performance, metacognitive efficiency is better for visual stimuli versus auditory or audiovisual stimuli, but not poorer for audiovisual versus auditory stimuli. Bottom, Correlations between individual metacognitive efficiencies in the visual and auditory conditions (d), audiovisual and auditory conditions (e), and audiovisual and visual conditions (f). The results show that metacognitive efficiency correlates between unimodal and bimodal perceptual tasks in favor of the supramodality hypothesis. *p < 0.05, **p < 0.01.
Figure 4.
Figure 4.
Top row, Parameter estimation in the unimodal visual and unimodal auditory conditions. In the middle panel, circles represent the partially overlapping bivariate internal signal distributions for each of the stimulus combinations, represented at a fixed density contour. The top right quadrant corresponds to congruent stimuli, in which the stimuli in each pair were stronger on the right side. The colors represent the predicted confidence, normalized to the interval (0,1) for every combination of internal signal strength for each stimulus pair (X1, X2). Parameters for internal noise (σ) and criterion (c) were defined for each participant based on the fitting of response rates (“congruent”/“incongruent” and “sure”/“unsure” based on a median split of confidence ratings) in the unimodal visual (left) and auditory (right) conditions. The thick black and gray lines correspond, respectively, to observed responses in congruent and incongruent trials for a representative participant. The red lines represent the response rates predicted by the model with fitted parameters. Middle row: Model predictions. Modeling of bimodal data based on the combination of cA, cV, and σA, σV, according to integrative (A, in blue), comparative (B, in red), and single-modality (C, in green) rules. Note that for models A and B, confidence increases with increasing internal signal level in both modalities, whereas in the single-modality model C, confidence depends on the signal strength of only one modality. Bottom row, Model comparison for the audiovisual condition. Left, Fit of response rates in the audiovisual condition for a representative participant according to model A (blue), B (red), or C (green). Right, Individual BIC weights for the three model fits. The arrows show how to read the plot from an arbitrary data point in the diagram, indicated with a red triangle. Consider that the sum of the BICw for all models A–C amounts to 1 for each participant. To estimate the relative BICw of each model for any given participant, use the lines parallel to the vertex labeled 1 for that model. The intersection between the line parallel to the vertex and the triangle edge corresponding to the model indicates the BICw.
Figure 5.
Figure 5.
Violin plots representing first-order sensitivity (a: d′), metacognitive sensitivity (b: meta-d′), and metacognitive efficiency (c: meta-d′/d′) in the audiovisual (AV, in green) and visual conditions (V, in blue). Full dots represent individual data points. Empty circles represent average estimates. Error bars indicate SD. The results show no difference between visual and audiovisual metacognitive efficiency. d, Correlation between individual metacognitive efficiencies in the audiovisual and visual conditions.
Figure 6.
Figure 6.
Voltage amplitude time locked to correct type 1 responses as a function of confidence. a, Left, Time course of the main effect of confidence within a predefined ROI. Although raw confidence ratings were used for the statistical analysis, they are depicted here as binned into four quartiles, from quartile 1 corresponding to trials with the 25% lowest confidence ratings (light pink) to quartile 4 corresponding to trials with the 25% highest confidence ratings (dark red). The size of each circle along the amplitude line is proportional to the corresponding F-value from mixed model analyses within 50 ms windows. Right, Same analysis as shown in a on the left on the whole scalp. The plot represents the time course of the summed F-value over 64 electrodes for the main effect of confidence. The topography where a maximum F-value is reached (*) is shown next to each plot. b. Left, Time course of the interaction between confidence and condition following a linear mixed-model analysis within the same ROI as in a. Although raw confidence ratings were used for the statistical analysis, the plot represents the difference in voltage amplitude between trials in the fourth versus first confidence quartile. Right, Same analysis as shown in b on the left on the whole scalp, with corresponding topography. In all plots, gray bars correspond to significant main effects (a) or interactions (b), with p < 0.05 FDR corrected. Significant effects on topographies are highlighted with black stars (p < 0.001, uncorrected).
Figure 7.
Figure 7.
Alpha power time locked to correct type 1 responses as a function of confidence. a, Left, Time course of the main effect of confidence within a predefined ROI. Although raw confidence ratings were used for the statistical analysis, they are depicted here as binned into four quartiles, from quartile 1 corresponding to trials with the 25% lowest confidence ratings (light pink) to quartile 4 corresponding to trials with the 25% highest confidence ratings (dark red). The size of each circle along the alpha power line is proportional to the corresponding F-value from mixed-model analyses within 50 ms windows. Right, Same analysis shown in a on the left on the whole scalp. The plot represents the time course of the summed F-value over 64 electrodes for the main effect of confidence. The topography where a maximum F-value is reached (*) is shown next to each plot. b, Left, Time course of the interaction between confidence and condition following a linear mixed-model analysis within the same ROI as in a. Although raw confidence ratings were used for the statistical analysis, the plot represents the difference in voltage amplitude between trials in the fourth versus first confidence quartile. Right, Same analysis as shown in b on the left on the whole scalp, with corresponding topography. In all plots, gray bars correspond to significant main effects (a) or interactions (b), with p < 0.05 FDR-corrected. Significant effects on topographies are highlighted with black stars (p < 0.001, uncorrected).

Similar articles

Cited by

References

    1. Ais J, Zylberberg A, Barttfeld P, Sigman M (2016) Individual consistency in the accuracy and distribution of confidence judgments. Cognition 146:377–386. 10.1016/j.cognition.2015.10.006 - DOI - PubMed
    1. Bagiella E, Sloan RP, Heitjan DF (2000) Mixed-effects models in psychophysiology. Psychophysiology 37:13–20. 10.1111/1469-8986.3710013 - DOI - PubMed
    1. Baird B, Mrazek MD, Phillips DT, Schooler JW (2014) Domain-specific enhancement of metacognitive ability following meditation training. J Exp Psychol Gen 143:1972–1979. 10.1037/a0036882 - DOI - PubMed
    1. Barrett AB, Dienes Z, Seth AK (2013) Measures of metacognition on signal-detection theoretic models. Psychol Methods 18:535–552. 10.1037/a0033268 - DOI - PubMed
    1. Bates DM, Kliegl R, Vasishth S, Baayen H (2015) Parsimonious mixed models. arXiv preprint arXiv:150 604967:1–27.

Publication types

LinkOut - more resources