

Comparative analysis of alternative polyadenylation in S. cerevisiae and S. pombe
- PMID: 28916539
- PMCID: PMC5630032
- DOI: 10.1101/gr.222331.117
Comparative analysis of alternative polyadenylation in S. cerevisiae and S. pombe
Abstract
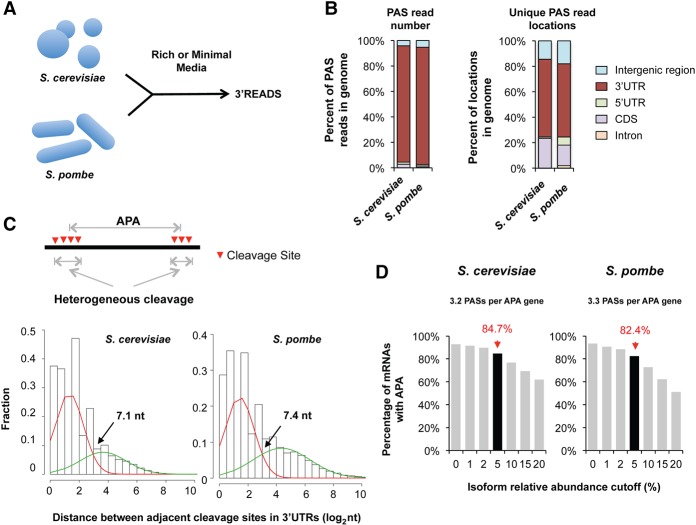
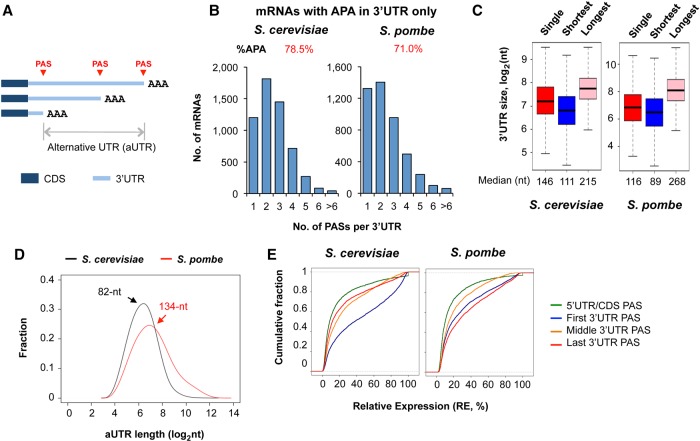
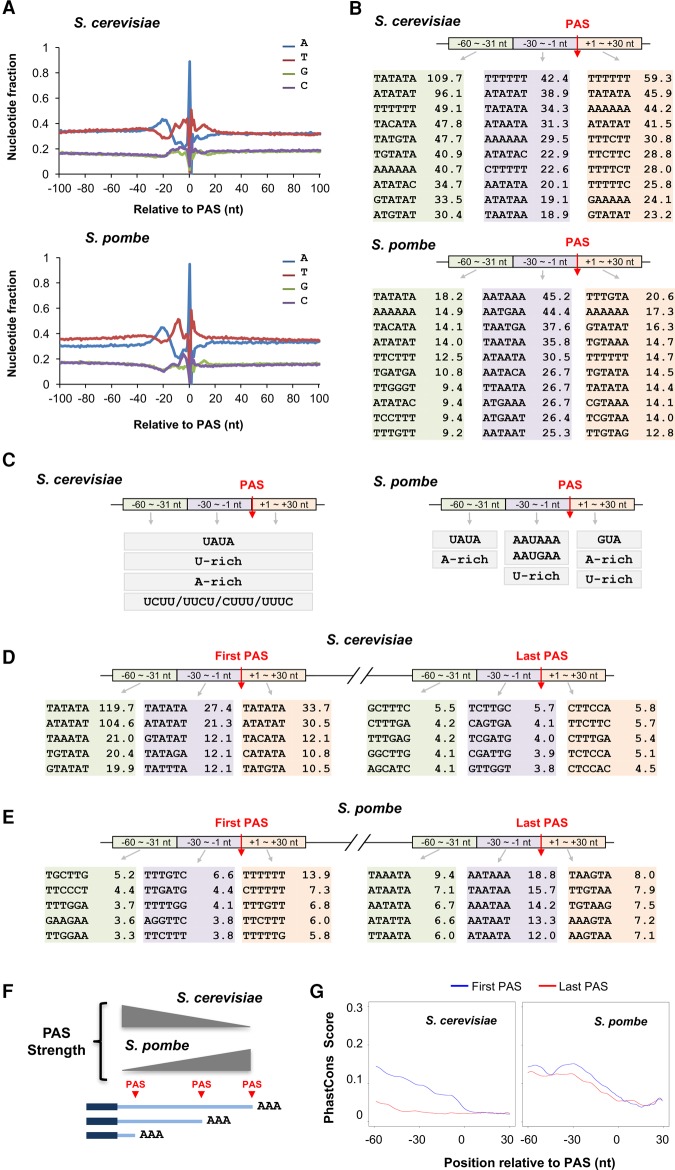
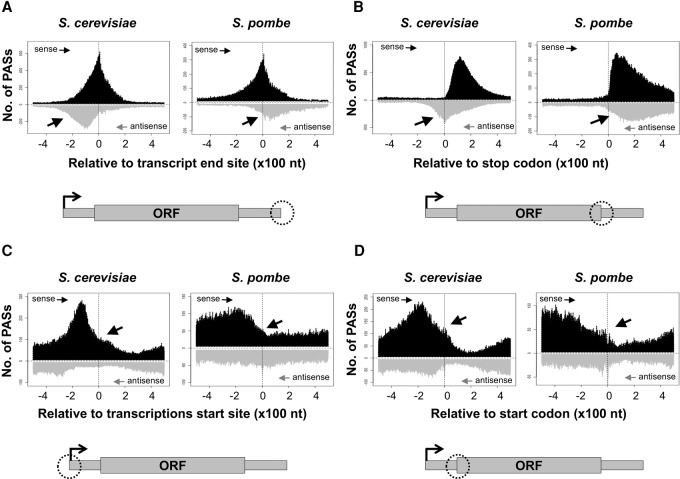
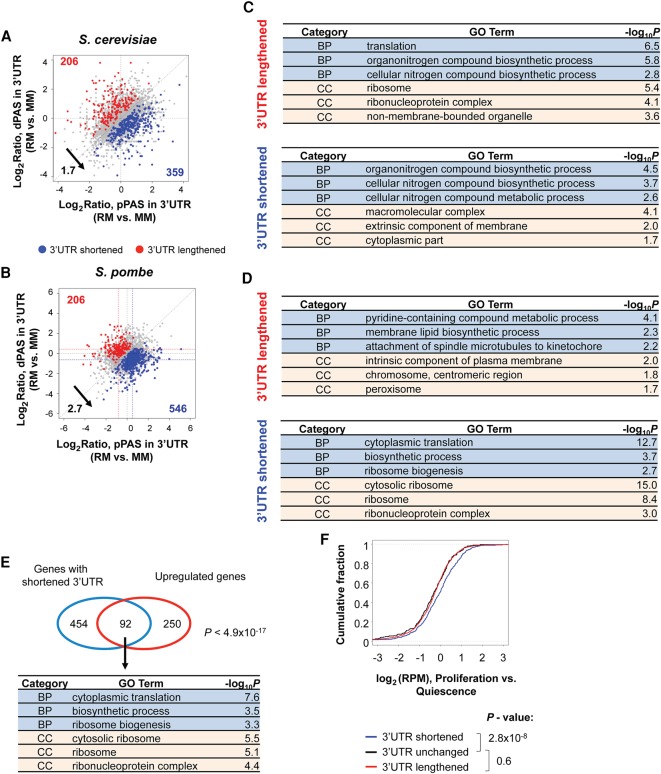
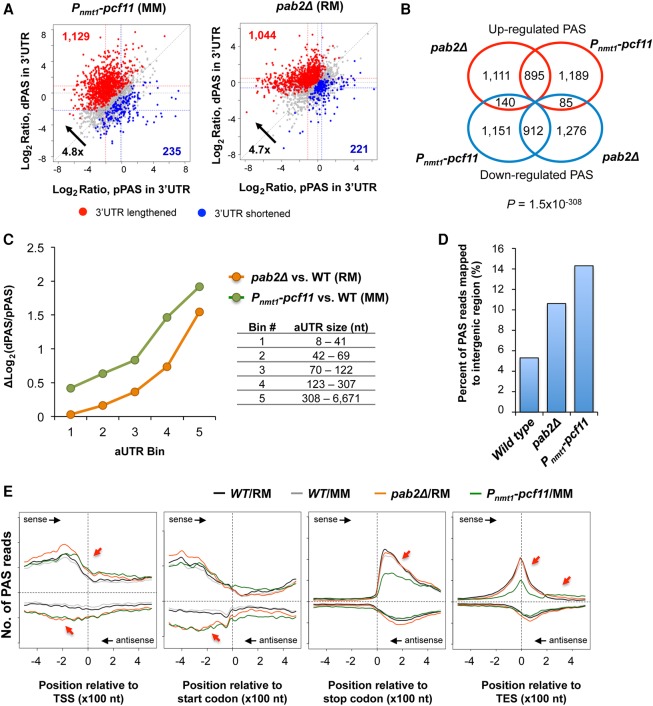
Alternative polyadenylation (APA) is a widespread mechanism that generates mRNA isoforms with distinct properties. Here we have systematically mapped and compared cleavage and polyadenylation sites (PASs) in two yeast species, S. cerevisiae and S. pombe Although >80% of the mRNA genes in each species were found to display APA, S. pombe showed greater 3' UTR size differences among APA isoforms than did S. cerevisiae PASs in different locations of gene are surrounded with distinct sequences in both species and are often associated with motifs involved in the Nrd1-Nab3-Sen1 termination pathway. In S. pombe, strong motifs surrounding distal PASs lead to higher abundances of long 3' UTR isoforms than short ones, a feature that is opposite in S. cerevisiae Differences in PAS placement between convergent genes lead to starkly different antisense transcript landscapes between budding and fission yeasts. In both species, short 3' UTR isoforms are more likely to be expressed when cells are growing in nutrient-rich media, although different gene groups are affected in each species. Significantly, 3' UTR shortening in S. pombe coordinates with up-regulation of expression for genes involved in translation during cell proliferation. Using S. pombe strains deficient for Pcf11 or Pab2, we show that reduced expression of 3'-end processing factors lengthens 3' UTR, with Pcf11 having a more potent effect than Pab2. Taken together, our data indicate that APA mechanisms in S. pombe and S. cerevisiae are largely different: S. pombe has many of the APA features of higher species, and Pab2 in S. pombe has a different role in APA regulation than its mammalian homolog, PABPN1.
© 2017 Liu et al.; Published by Cold Spring Harbor Laboratory Press.
Figures
Similar articles
-
The Nrd1-like protein Seb1 coordinates cotranscriptional 3' end processing and polyadenylation site selection.Genes Dev. 2016 Jul 1;30(13):1558-72. doi: 10.1101/gad.280222.116. Genes Dev. 2016. PMID: 27401558 Free PMC article.
-
Yeast Nrd1, Nab3, and Sen1 transcriptome-wide binding maps suggest multiple roles in post-transcriptional RNA processing.RNA. 2011 Nov;17(11):2011-25. doi: 10.1261/rna.2840711. Epub 2011 Sep 27. RNA. 2011. PMID: 21954178 Free PMC article.
-
The nuclear poly(A) binding protein of mammals, but not of fission yeast, participates in mRNA polyadenylation.RNA. 2017 Apr;23(4):473-482. doi: 10.1261/rna.057026.116. Epub 2017 Jan 17. RNA. 2017. PMID: 28096519 Free PMC article.
-
RNA-binding proteins in regulation of alternative cleavage and polyadenylation.Adv Exp Med Biol. 2014;825:97-127. doi: 10.1007/978-1-4939-1221-6_3. Adv Exp Med Biol. 2014. PMID: 25201104 Review.
-
The multitasking polyA tail: nuclear RNA maturation, degradation and export.Philos Trans R Soc Lond B Biol Sci. 2018 Nov 5;373(1762):20180169. doi: 10.1098/rstb.2018.0169. Philos Trans R Soc Lond B Biol Sci. 2018. PMID: 30397105 Free PMC article. Review.
Cited by
-
Regulation of alternative polyadenylation in the yeast Saccharomyces cerevisiae by histone H3K4 and H3K36 methyltransferases.Nucleic Acids Res. 2020 Jun 4;48(10):5407-5425. doi: 10.1093/nar/gkaa292. Nucleic Acids Res. 2020. PMID: 32356874 Free PMC article.
-
Evolutionary dynamics of polyadenylation signals and their recognition strategies in protists.Genome Res. 2024 Oct 29;34(10):1570-1581. doi: 10.1101/gr.279526.124. Genome Res. 2024. PMID: 39327029 Free PMC article.
-
RNA Binding to CCRRM of PABPN1 Induces Conformation Change.Biology (Basel). 2025 Apr 17;14(4):432. doi: 10.3390/biology14040432. Biology (Basel). 2025. PMID: 40282297 Free PMC article.
-
Heat shock induces alternative polyadenylation through dynamic DNA methylation and chromatin looping.Cell Stress Chaperones. 2025 Jul;30(4):100084. doi: 10.1016/j.cstres.2025.100084. Epub 2025 May 22. Cell Stress Chaperones. 2025. PMID: 40412548 Free PMC article.
-
Genome-Wide Discovery of DEAD-Box RNA Helicase Targets Reveals RNA Structural Remodeling in Transcription Termination.Genetics. 2019 May;212(1):153-174. doi: 10.1534/genetics.119.302058. Epub 2019 Mar 22. Genetics. 2019. PMID: 30902808 Free PMC article.
References
-
- Benaglia T, Chauveau D, Hunter DR, Young DS. 2009. mixtools: an R package for analyzing mixture models. J Stat Softw 32: 29.
Publication types
MeSH terms
Substances
Grants and funding
LinkOut - more resources
Full Text Sources
Other Literature Sources
Molecular Biology Databases