

Effect of Soy and Soy Isoflavones on Obesity-Related Anthropometric Measures: A Systematic Review and Meta-analysis of Randomized Controlled Clinical Trials
- PMID: 28916571
- PMCID: PMC5593113
- DOI: 10.3945/an.117.015370
Effect of Soy and Soy Isoflavones on Obesity-Related Anthropometric Measures: A Systematic Review and Meta-analysis of Randomized Controlled Clinical Trials
Abstract
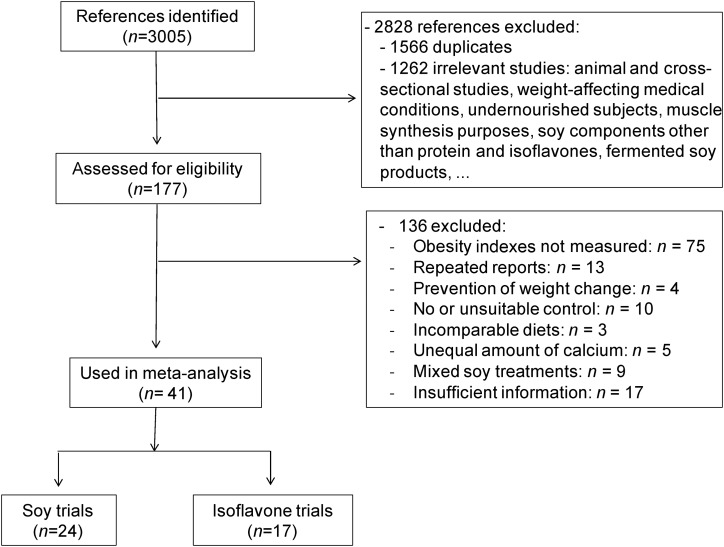
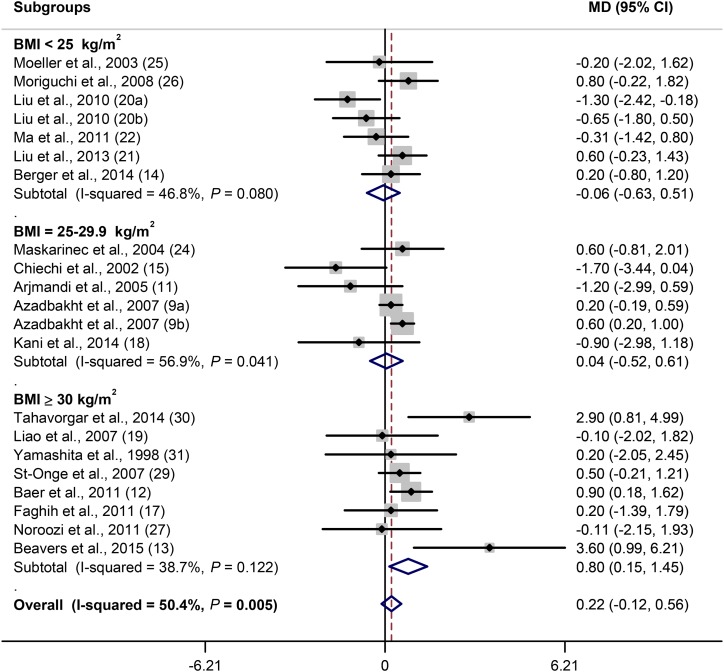
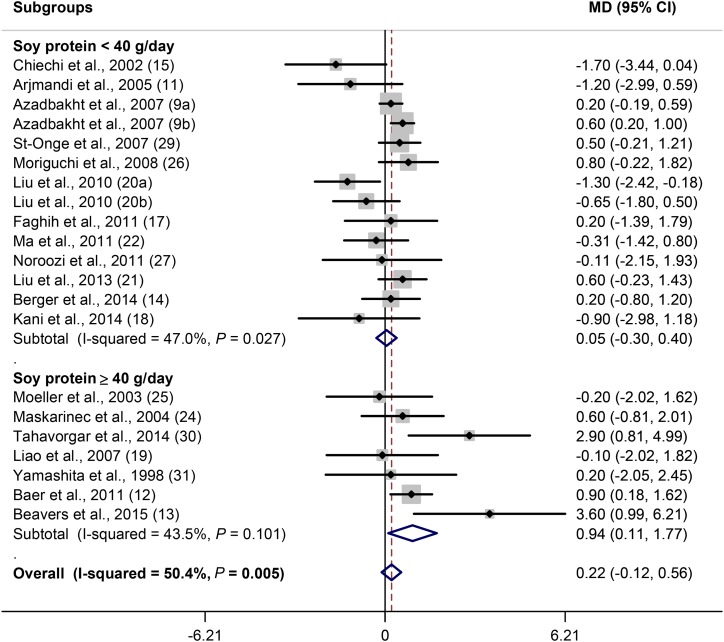
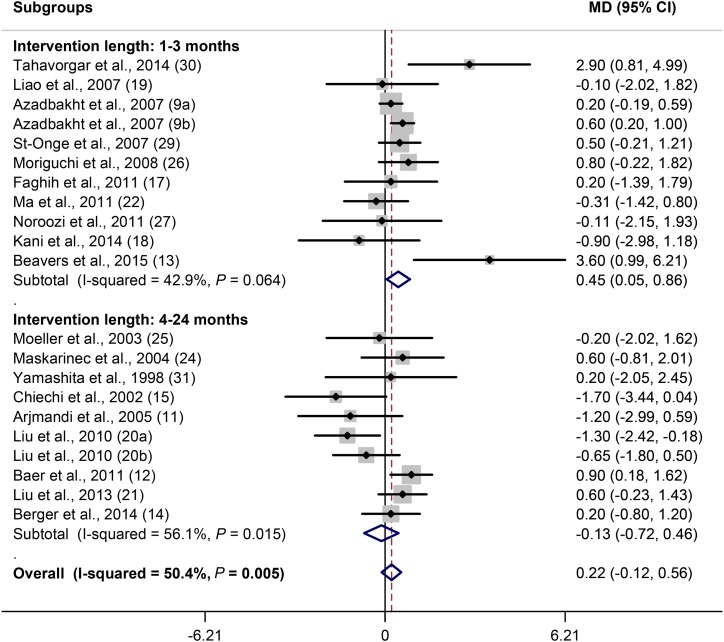
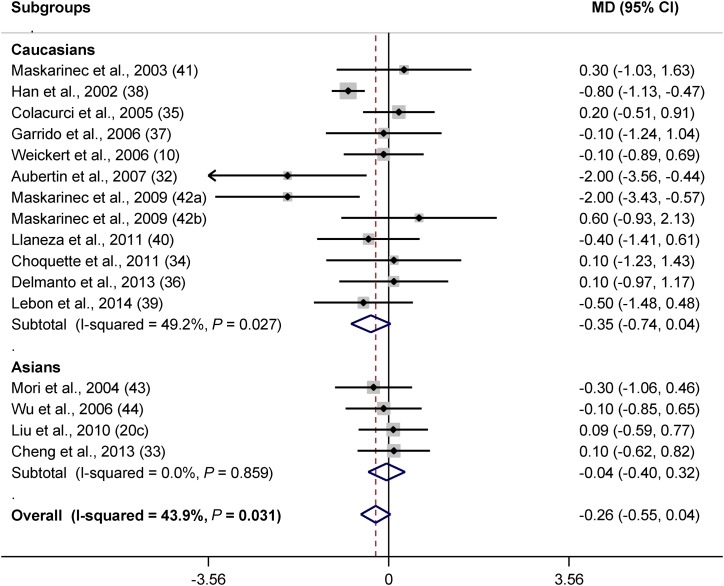
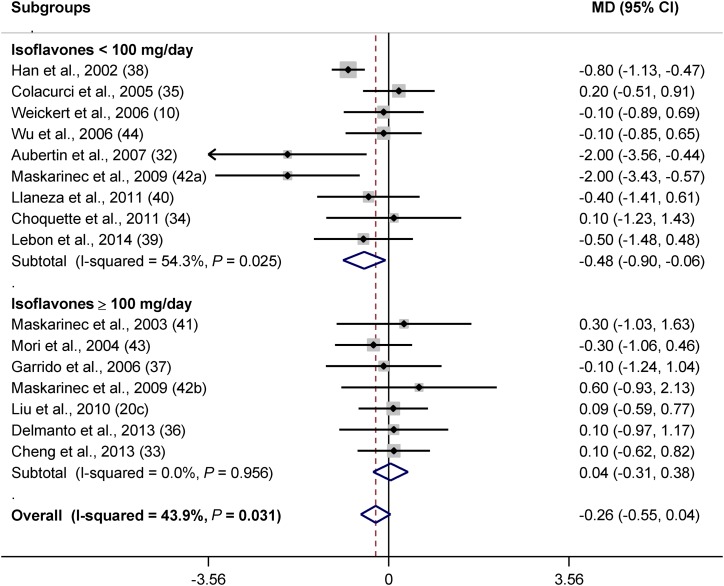
Soy may be a suitable food for anti-obesity efforts because of its high protein and isoflavone content. We conducted this meta-analysis to evaluate potential effects of soy and soy isoflavones on weight, waist circumference, and fat mass. PubMed, MEDLINE, Scopus, EMBASE, and Cochrane databases were searched. Twenty-four trials with soy and 17 trials with isoflavones passed the eligibility stage. According to the results, soy showed no overall statistically significant effect on weight, waist circumference, or fat mass, but a significant increasing effect on weight was observed in some circumstances: for instance, in obese subjects [mean difference (MD): 0.80 kg; 95% CI: 0.15, 1.45 kg; P = 0.02], with ingestions of ≥40 g soy protein/d (MD: 0.94 kg; 95% CI: 0.11, 1.77 kg; P = 0.03), with short-term applications (1-3 mo) (MD: 0.45 kg; 95% CI: 0.05, 0.86 kg; P = 0.03), and when soy was compared with meat (MD: 0.36 kg; 95% CI: 0.09, 0.64 kg; P = 0.03) and whey protein (MD: 1.53 kg; 95% CI: 0.10, 2.96 kg; P = 0.04). In contrast to the effects of soy on weight, soy significantly decreased waist circumference in older ages (MD: -0.36 cm; 95% CI: -0.71, -0.01 cm; P = 0.04), in women (MD: -0.32 cm; 95% CI: -0.57, -0.08 cm; P = 0.01), and at doses of <40 g soy protein/d (MD: -0.31 cm; 95% CI: -0.57, -0.05 cm; P = 0.02). Isoflavone studies, conducted only in women, showed that isoflavones may reduce body mass index (BMI; in kg/m2) (MD: -0.26; 95% CI: -0.55, 0.04; P = 0.085), especially in dosages <100 mg/d (MD: -0.48; 95% CI: -0.90, -0.06; P = 0.02) and in intervention periods of 2-6 mo (MD: -0.28; 95% CI: -0.56, 0.00; P = 0.053), but no effect was observed in higher doses or longer intervention periods. Also, a trend for reduced BMI after consumption of isoflavones was observed in Caucasians (MD: -0.35; 95% CI: -0.74, 0.04; P = 0.08). Overall, results showed that, although soy is the major source of isoflavones, soy and isoflavones may have different impacts on weight status.
Keywords: fat mass; isoflavones; soy; waist circumference; weight.
© 2017 American Society for Nutrition.
Conflict of interest statement
Author disclosures: MA, MZ, and FN, no conflicts of interest.
Figures
Similar articles
-
Effects of total fat intake on bodyweight in children.Cochrane Database Syst Rev. 2018 Feb 15;2(2):CD012960. doi: 10.1002/14651858.CD012960. Cochrane Database Syst Rev. 2018. Update in: Cochrane Database Syst Rev. 2018 Jul 05;7:CD012960. doi: 10.1002/14651858.CD012960.pub2. PMID: 29446437 Free PMC article. Updated.
-
Effects of total fat intake on bodyweight in children.Cochrane Database Syst Rev. 2018 Jul 5;7(7):CD012960. doi: 10.1002/14651858.CD012960.pub2. Cochrane Database Syst Rev. 2018. PMID: 29974953 Free PMC article.
-
Sertindole for schizophrenia.Cochrane Database Syst Rev. 2005 Jul 20;2005(3):CD001715. doi: 10.1002/14651858.CD001715.pub2. Cochrane Database Syst Rev. 2005. PMID: 16034864 Free PMC article.
-
Interventions to change the behaviour of health professionals and the organisation of care to promote weight reduction in children and adults with overweight or obesity.Cochrane Database Syst Rev. 2017 Nov 30;11(11):CD000984. doi: 10.1002/14651858.CD000984.pub3. Cochrane Database Syst Rev. 2017. PMID: 29190418 Free PMC article.
-
Heliox for croup in children.Cochrane Database Syst Rev. 2021 Aug 16;8(8):CD006822. doi: 10.1002/14651858.CD006822.pub6. Cochrane Database Syst Rev. 2021. PMID: 34397099 Free PMC article.
Cited by
-
Soy Products Ameliorate Obesity-Related Anthropometric Indicators in Overweight or Obese Asian and Non-Menopausal Women: A Meta-Analysis of Randomized Controlled Trials.Nutrients. 2019 Nov 15;11(11):2790. doi: 10.3390/nu11112790. Nutrients. 2019. PMID: 31731772 Free PMC article.
-
Gut microbial change after administration of Lacticaseibacillus paracasei AO356 is associated with anti-obesity in a mouse model.Front Endocrinol (Lausanne). 2023 Aug 29;14:1224636. doi: 10.3389/fendo.2023.1224636. eCollection 2023. Front Endocrinol (Lausanne). 2023. PMID: 37705572 Free PMC article.
-
Soy Food Intake Associated with Obesity and Hypertension in Children and Adolescents in Guangzhou, Southern China.Nutrients. 2022 Jan 18;14(3):425. doi: 10.3390/nu14030425. Nutrients. 2022. PMID: 35276781 Free PMC article.
-
Equol: A Bacterial Metabolite from The Daidzein Isoflavone and Its Presumed Beneficial Health Effects.Nutrients. 2019 Sep 16;11(9):2231. doi: 10.3390/nu11092231. Nutrients. 2019. PMID: 31527435 Free PMC article. Review.
-
Metabolic Impact of Flavonoids Consumption in Obesity: From Central to Peripheral.Nutrients. 2020 Aug 10;12(8):2393. doi: 10.3390/nu12082393. Nutrients. 2020. PMID: 32785059 Free PMC article. Review.
References
-
- Xiao CW. Health effects of soy protein and isoflavones in humans. J Nutr 2008;138:1244S–9S. - PubMed
-
- Sacks FM, Lichtenstein A, Van Horn L, Harris W, Kris-Etherton P, Winston M; American Heart Association Nutrition Committee. Soy protein, isoflavones, and cardiovascular health: an American heart Association Science Advisory for professionals from the Nutrition Committee. Circulation 2006;113:1034–44. - PubMed
-
- Zhang YB, Chen WH, Guo JJ, Fu ZH, Yi C, Zhang M, Na XL. Soy isoflavone supplementation could reduce body weight and improve glucose metabolism in non-Asian postmenopausal women–a meta-analysis. Nutrition 2013;29:8–14. - PubMed
Publication types
MeSH terms
Substances
LinkOut - more resources
Full Text Sources
Other Literature Sources
Medical
