. 2017 Nov 1;49(11):618-629.
doi: 10.1152/physiolgenomics.00050.2017. Epub 2017 Sep 15.

Systems genetics identifies a co-regulated module of liver microRNAs associated with plasma LDL cholesterol in murine diet-induced dyslipidemia

Affiliations

Systems genetics identifies a co-regulated module of liver microRNAs associated with plasma LDL cholesterol in murine diet-induced dyslipidemia

Alisha R Coffey et al. Physiol Genomics. .

Abstract

Chronically altered levels of circulating lipids, termed dyslipidemia, is a significant risk factor for a number of metabolic and cardiovascular morbidities. MicroRNAs (miRNAs) have emerged as important regulators of lipid balance, have been implicated in dyslipidemia, and have been proposed as candidate therapeutic targets in lipid-related disorders including atherosclerosis. A major limitation of most murine studies of miRNAs in lipid metabolic disorders is that they have been performed in just one (or very few) inbred strains, such as C57BL/6. Moreover, although individual miRNAs have been associated with lipid phenotypes, it is well understood that miRNAs likely work together in functional modules. To address these limitations, we implemented a systems genetics strategy using the Diversity Outbred (DO) mouse population. Specifically, we performed gene and miRNA expression profiling in the livers from ~300 genetically distinct DO mice after 18 wk on either a high-fat/high-cholesterol diet or a high-protein diet. Large-scale correlative analysis of these data with a wide range of cardio-metabolic end points revealed a co-regulated module of miRNAs significantly associated with circulating low-density lipoprotein cholesterol (LDL-C) levels. The hubs of this module were identified as miR-199a, miR-181b, miR-27a, miR-21_-_1, and miR-24. In sum, we demonstrate that a high-fat/high-cholesterol diet robustly rewires the miRNA regulatory network, and we identify a small group of co-regulated miRNAs that may exert coordinated effects to control circulating LDL-C.

Keywords: LDL-C; co-regulated modules; diversity outbred mice; dyslipidemia; microRNAs.


Figures

Fig. 1.
Fig. 1.
Summary diagram of study design: 288 Diversity Outbred (DO) mice, each having a different composite of the 8 founder mouse strain genomes, were fed either high-protein (HP) or high-fat/cholic acid (HFCA) diet. Cardio-metabolic end points were measured before and after diet intervention. RNA was isolated from the livers of each of the mice and used for microarray analysis to measure gene expression and small RNA sequencing.
Fig. 2.
Fig. 2.
Plasma very-low-density lipoprotein/low-density lipoprotein (VLDL/LDL), aspartate aminotransferase (AST), and alanine aminotransferase (ALT) are dramatically affected by HFCA diet. Box plot of postdiet AST (mg/dl) (A), postdiet ALT (mg/dl) (B), postdiet plasma VLDL/LDL-C (mg/dl) (C), and postdiet plasma high-density lipoprotein cholesterol (HDL-C) (mg/dl) (D) concentration in HP-fed DO mice and HFCA-fed DO mice. Each dot represents 1 mouse in the respective diet. Hinges of boxplots represent the 1st and 3rd quartile of expression.
Fig. 3.
Fig. 3.
Diet alters microRNA (miRNA) expression. Volcano plot of differentially expressed liver miRNAs between HFCA-fed and HP-fed DO mice after those that had low expression were filtered out. Each dot represents 1 miRNA. Red dots are miRNAs that are upregulated in HFCA-fed mice relative to HP-fed mice with a fold-change of 1.5 or more and a false discovery rate (FDR) ≤ 0.05. Blue dots are miRNAs that are downregulated in HFCA-fed mice relative to HP-fed mice with a fold-change of 1.5 or more and an FDR ≤ 0.05. Horizontal dashed line denotes FDR = 0.05. Vertical dashed lines denote fold change of −1.5 (left) and 1.5 (right).
Fig. 4.
Fig. 4.
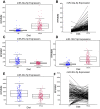
Diet alters expression of specific miRNAs. A: box plot of miR-34a-5p. B: miR-34a-5p expression with lines connecting DO mouse sibling pairs in either diet group. C–E: box plots of miR-874-3p, miR-1247-5p, and miR-30c-2-5p expression in HP-fed and HFCA-fed DO mice. For all box plots, each dot represents 1 mouse in the respective diet. Hinges of boxplots represent the 1st and 3rd quartile of expression. F: miR-30c-2-5p expression with lines connecting DO mouse sibling pairs in either diet group.
Fig. 5.
Fig. 5.
miRNA coexpression analysis identifies module associated with metabolic traits. A: miRNA modules formed by weighted gene coexpression network analysis (WGCNA). Only HFCA mice were used during analysis. Reads per millions mapped to microRNAs (RPMMMs) were converted using log2(x+1) and used to calculate Pearson correlations. Dendrogram was created using the 1-topological overlap measure (TOM), and Ward’s method of hierarchical clustering. Modules were formed with the hybrid tree-cutting function in the WGCNA software package. Heat map of miRNA module eigenmiRs correlated to cardio-metabolic end points measured in the HFCA-fed DO mice (B) and HP-fed DO mice (C). EigenmiRs were calculated using the WGCNA function moduleEigengenes and correlated using the biweight midcorrelation to normalized end point values. The intensity of orange or blue denotes how close the correlation coefficient is to 1 or −1, respectively. Top numbers are biweight midcorrelation coefficients; bottom numbers are P values. D: Cytoscape visualization of brown miRNA co-regulated modules (mCRM). Each node represents 1 miRNA. Each edge represents high cocorrelation. The dashed circle highlights the hub miRNAs in this module as determined by number of connections and weight of connections.
Fig. 6.
Fig. 6.
Differential expression analysis for gene expression. A: volcano plot of differentially expressed liver genes between HFCA-fed and HP-fed DO mice. Each dot represents 1 probe. Red dots are probes that are upregulated (n = 401) in HFCA-fed mice relative to HP-fed mice with a fold-change of 2 or more and a P value ≤ 1.20e-06 (Bonferroni correction). Blue dots are probes that are downregulated (n = 140) in HFCA-fed mice relative to HP-fed mice with a fold-change of 2 or more and an P value ≤ 1.20e-06. Horizontal dashed line denotes –log10(1.20e-06). Vertical dashed lines denote fold change of −2 (left) and 2 (right). B, C: correlation plots illustrating the inverse relationship between miR-27a and Hmgcr, Ldlr, Acly, and Lpin1 expression (correlations calculated with bicor).
Fig. 7.
Fig. 7.
Gene coexpression analysis identifies gene co-regulated modules (gCRMs) that are correlated with the brown mCRM. A: gCRMs formed with WGCNA. Only HFCA mice were used during analysis. The top 3,000 most variable genes and the hybrid tree-cutting function in the WGCNA software package were used to form modules. B: heat map of correlations between mRNA (gene) modules and brown miRNA module, and list of cardio-metabolic end points measured in the DO mice. Eigengenes and eigenmiRs were calculated by the WGCNA function and correlated with the biweight midcorrelation to normalized end point values. The intensity of orange or blue denotes how close the correlation coefficient is to 1 or −1, respectively. Numbers in parentheses are Student P values. C: aggregate correlation values of miRNAs to gene module members. Biweight midcorrelations were calculated between each individual miRNA and each gene. Values were averaged (mean) across gene module members. Dashed lines denote significant correlation values (−0.198, 0.198) as determined by 97.5% quantile of 1,000 permutations.

Similar articles

Cited by

References

    1. Alvarez ML, Khosroheidari M, Eddy E, Done SC. MicroRNA-27a decreases the level and efficiency of the LDL receptor and contributes to the dysregulation of cholesterol homeostasis. Atherosclerosis 242: 595–604, 2015. doi:10.1016/j.atherosclerosis.2015.08.023. - DOI - PMC - PubMed
    1. Baran-Gale J, Kurtz CL, Erdos MR, Sison C, Young A, Fannin EE, Chines PS, Sethupathy P. Addressing bias in small RNA library preparation for sequencing: a new protocol recovers microRNAs that evade capture by current methods. Front Genet 6: 352, 2015. doi:10.3389/fgene.2015.00352. - DOI - PMC - PubMed
    1. Calo N, Ramadori P, Sobolewski C, Romero Y, Maeder C, Fournier M, Rantakari P, Zhang FP, Poutanen M, Dufour JF, Humar B, Nef S, Foti M. Stress-activated miR-21/miR-21* in hepatocytes promotes lipid and glucose metabolic disorders associated with high-fat diet consumption. Gut 65: 1871–1881, 2016. doi:10.1136/gutjnl-2015-310822. - DOI - PubMed
    1. Cermelli S, Guo Y, Gross SP, Welte MA. The lipid-droplet proteome reveals that droplets are a protein-storage depot. Curr Biol 16: 1783–1795, 2006. doi:10.1016/j.cub.2006.07.062. - DOI - PubMed
    1. Chen EY, Tan CM, Kou Y, Duan Q, Wang Z, Meirelles GV, Clark NR, Ma’ayan A. Enrichr: interactive and collaborative HTML5 gene list enrichment analysis tool. BMC Bioinformatics 14: 128, 2013. doi:10.1186/1471-2105-14-128. - DOI - PMC - PubMed