. 2017 Sep 15;7(1):11722.
doi: 10.1038/s41598-017-12119-7.

Hormetic potential of methylglyoxal, a side-product of glycolysis, in switching tumours from growth to death

Affiliations

Hormetic potential of methylglyoxal, a side-product of glycolysis, in switching tumours from growth to death

Marie-Julie Nokin et al. Sci Rep. .

Abstract

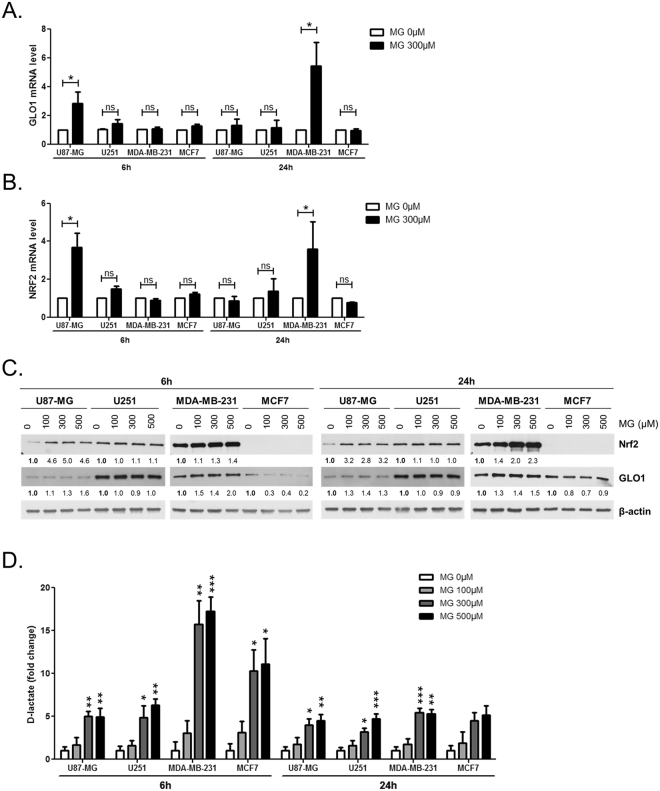
Metabolic reprogramming toward aerobic glycolysis unavoidably favours methylglyoxal (MG) and advanced glycation end products (AGEs) formation in cancer cells. MG was initially considered a highly cytotoxic molecule with potential anti-cancer value. However, we have recently demonstrated that MG enhanced tumour growth and metastasis. In an attempt to understand this dual role, we explored MG-mediated dicarbonyl stress status in four breast and glioblastoma cancer cell lines in relation with their glycolytic phenotype and MG detoxifying capacity. In glycolytic cancer cells cultured in high glucose, we observed a significant increase of the conversion of MG to D-lactate through the glyoxalase system. Moreover, upon exogenous MG challenge, glycolytic cells showed elevated amounts of intracellular MG and induced de novo GLO1 detoxifying enzyme and Nrf2 expression. Thus, supporting the adaptive nature of glycolytic cancer cells to MG dicarbonyl stress when compared to non-glycolytic ones. Finally and consistent with the pro-tumoural role of MG, we showed that low doses of MG induced AGEs formation and tumour growth in vivo, both of which can be reversed using a MG scavenger. Our study represents the first demonstration of a hormetic effect of MG defined by a low-dose stimulation and a high-dose inhibition of tumour growth.


Conflict of interest statement

The authors declare that they have no competing interests.

Figures

Figure 1
Figure 1
Energetic metabolism characterization and dicarbonyl stress status in cancer cells. U87-MG, U251, MDA-MB-231 and MCF7 cancer cells were cultured in low (LG) or high-glucose (HG) medium. (A) Metabolic profiling of the indicated cancer cell lines using Seahorse analyzer showing ECAR (extracellular acidification rate) and OCR (oxygen consumption rate). (B) L-Lactate production in 48 h conditioned-medium. (C) Intracellular MG was assessed by flow cytometry using MBo specific probe. (D) D-Lactate production in 48 h conditioned-medium. (E) Reactive oxygen species (ROS) accumulation was assessed by flow cytometry using DCFDA probe. (F) GSH and GSSG concentrations were assessed in cell pellets and GSH/GSSG ratio are shown. Data are presented as mean values ± SEM of three independent experiments. *p < 0.05, **p < 0.01 and ns = not significant.
Figure 2
Figure 2
Intracellular MG, MG-adducts levels and GLO1 detoxification capacity in response to MG treatment. U87-MG, U251, MDA-MB-231 and MCF7 cancer cells cultured in low glucose medium were treated with the indicated doses MG (A) MG half maximum inhibitory concentration values (IC50) on cancer cell viability. HUVEC normal endothelial cells showed the highest sensitivity to MG compared with cancer cells. (B) Intracellular MG production was assessed by flow cytometry using MBo probe in cells treated with the indicated MG concentrations for 6 and 24 h. (C) MG-adducts were detected by immunoblotting using specific antibodies against MG-H1 and argpyrimidine residues in cells exposed to MG 300 µM for 6 h, with β-actin as a loading control. Immunoblots are representative of three independent experiments. (D) GLO1 maximal activity was measured in cells treated with the indicated MG concentrations for 6 and 24 h, expressed as arbitrary units (A.U.) per mg of proteins. Data are shown as mean values ± SEM three independent experiments. *p < 0.05, **p < 0.01, ***p < 0.001 and ns = not significant, compared with control. Full-length blots are presented in Supplementary Figure 4.
Figure 3
Figure 3
Glycolytic cancer cells expressed increased amounts of GLO1 and Nrf2 upon MG treatment. U87-MG, U251, MDA-MB-231 and MCF7 cells cultured in low glucose medium were treated with the indicated doses of MG. (A) GLO1 and (B) NRF2 mRNA levels were assessed in response to MG treatment by RT-qPCR. (C) GLO1 and Nrf2 protein levels were quantified using immunoblotting, with β-actin as a loading control. Numbers represent fold increase relative to the control condition shown in bold. Immunoblots are representative of three independent experiments. (D) D-lactate production in conditioned-medium was assessed after 6 and 24 h MG treatment. Data are presented as mean values ± SEM of three independent experiments. *p < 0.05, **p < 0.01, ***p < 0.001 and ns = not significant, compared with control. Full-length blots are presented in Supplementary Figure 5.
Figure 4
Figure 4
Aldo-keto reductases (AKRs) detoxifying enzymes are expressed in cancer cells and compensate for the loss of GLO1 activity. (A) U87-MG, U251, MDA-MB-231 and MCF7 cells were cultured in high-glucose medium and their mRNA levels for AKR1B10, AKR1C1 and AKR1C3 were evaluated by RT-qPCR. mRNA levels are shown as relative to MDA-MB-231 cells. (B) Basal AKR activity is shown as mmole of NADPH converted per h per mg of protein in the indicated cancer cells. (C) AKR activity was measured in the indicated cell lines treated with MG 300 µM during 24 h. (D) Intracellular MG was assessed by flow cytometry using MBo probe after 48 h treatment with BBGC at the indicated doses. (E) AKR1B10 mRNA levels were assessed by RT-qPCR in BBGC treated cells. Data are presented as fold change relative to untreated cells. All data are shown as mean values ± SEM of three independent experiments. *p < 0.05, **p < 0.01, ***p < 0.001.
Figure 5
Figure 5
Cancer cells display a biphasic dose response growth curve upon MG treatment. U87-MG cells were grown on the chicken chorioallantoic membrane (CAM) and treated daily with (A) the indicated doses of MG and/or (B) carnosine 10 mM. After 7 days, tumour volumes were calculated. (C) Top and profile views of representative experimental CAM tumours. At least 10 eggs were used for each experimental condition. Data are mean values ± SEM. *p < 0.05 and **p < 0.01.
Figure 6
Figure 6
Proliferative and apoptotic effects of MG and carnosine treatment on CAM tumours. Experimental tumours shown in Fig. 5 were subjected to immunohistochemical staining of Ki67 proliferation marker. A representative picture of Ki67 staining is shown in (A), and the proportion of tumours discriminated in low and high proliferation rate among the different conditions is represented in panel (B). Apoptosis analysis in cells treated with MG at the indicated doses with or without co-treatment with carnosine 10 mM. Representative flow cytometry dot-plots are shown in (C) and annexin V positive cells are quantified in (D). Data are presented as mean values ± SEM of three independent experiments. **p < 0.01, ***p < 0.001.
Figure 7
Figure 7
Accumulation of MG-adducts in CAM tumours. Experimental tumours shown in Fig. 5 were subjected to immunohistochemical staining of MG-H1 and argpyrimidine MG-adducts. Representative pictures (A,C) and immunostaining quantification (B,D) of MG-H1 and argpyrimidine staining are shown, respectively. *p < 0.05, **p < 0.01, ***p < 0.001.

References

    1. Ward PS, Thompson CB. Metabolic reprogramming: a cancer hallmark even warburg did not anticipate. Cancer cell. 2012;21:297–308. doi: 10.1016/j.ccr.2012.02.014. - DOI - PMC - PubMed
    1. Liberti MV, Locasale JW. The Warburg Effect: How Does it Benefit Cancer Cells? Trends in biochemical sciences. 2016;41:211–218. doi: 10.1016/j.tibs.2015.12.001. - DOI - PMC - PubMed
    1. Phillips SA, Thornalley PJ. The formation of methylglyoxal from triose phosphates. Investigation using a specific assay for methylglyoxal. European journal of biochemistry / FEBS. 1993;212:101–105. doi: 10.1111/j.1432-1033.1993.tb17638.x. - DOI - PubMed
    1. Richard JP. Mechanism for the formation of methylglyoxal from triosephosphates. Biochemical Society transactions. 1993;21:549–553. doi: 10.1042/bst0210549. - DOI - PubMed
    1. Maessen DE, Stehouwer CD, Schalkwijk CG. The role of methylglyoxal and the glyoxalase system in diabetes and other age-related diseases. Clin Sci (Lond) 2015;128:839–861. doi: 10.1042/CS20140683. - DOI - PubMed

Publication types