. 2017 Sep 15;8(1):549.
doi: 10.1038/s41467-017-00772-5.

An HDAC3-PROX1 corepressor module acts on HNF4α to control hepatic triglycerides

Affiliations

An HDAC3-PROX1 corepressor module acts on HNF4α to control hepatic triglycerides

Sean M Armour et al. Nat Commun. .

Abstract

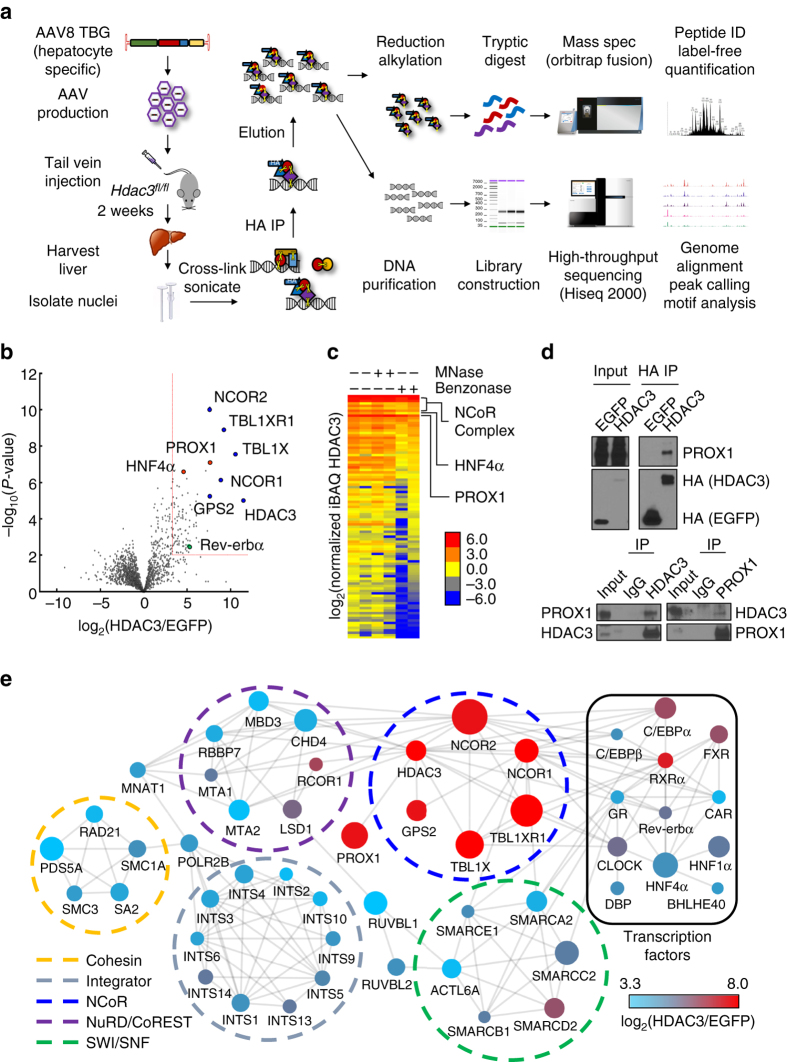
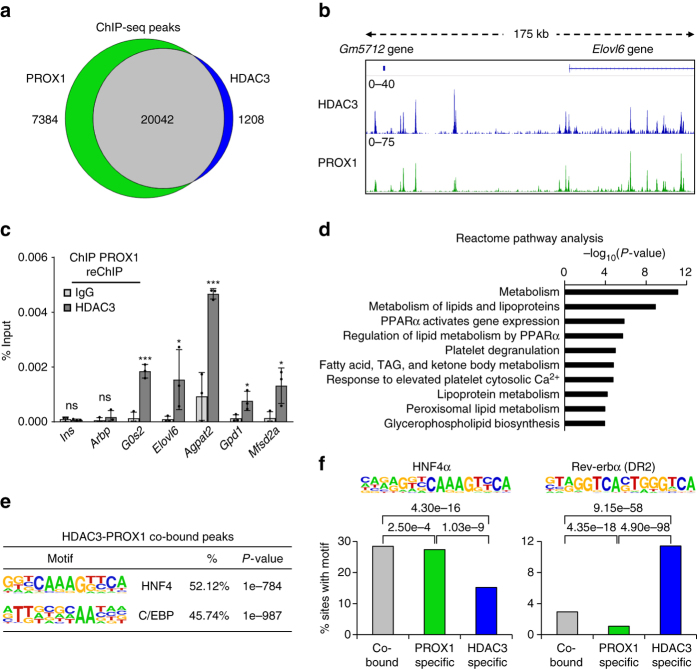
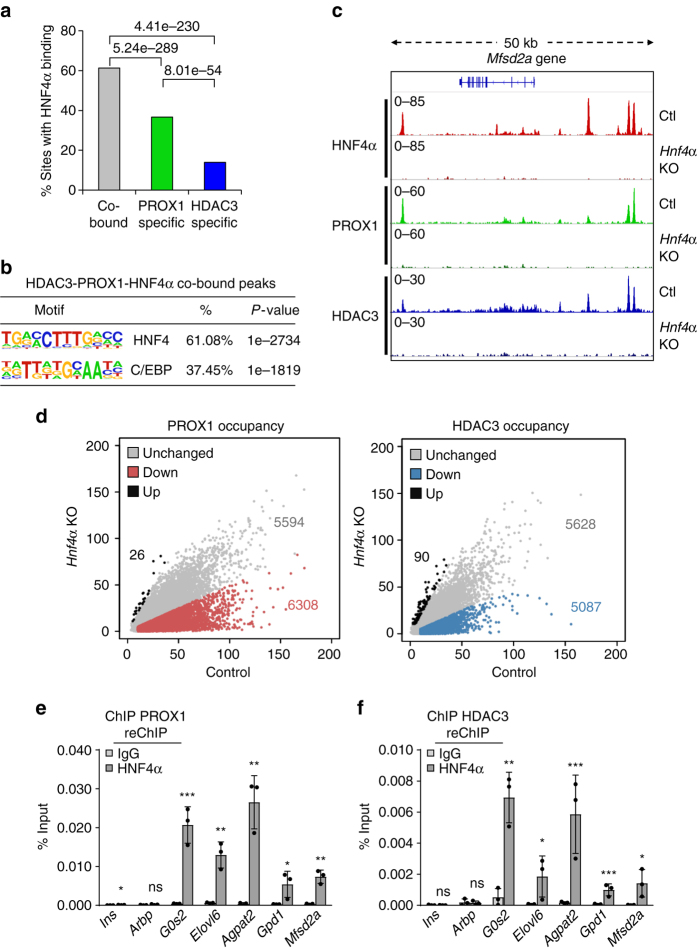
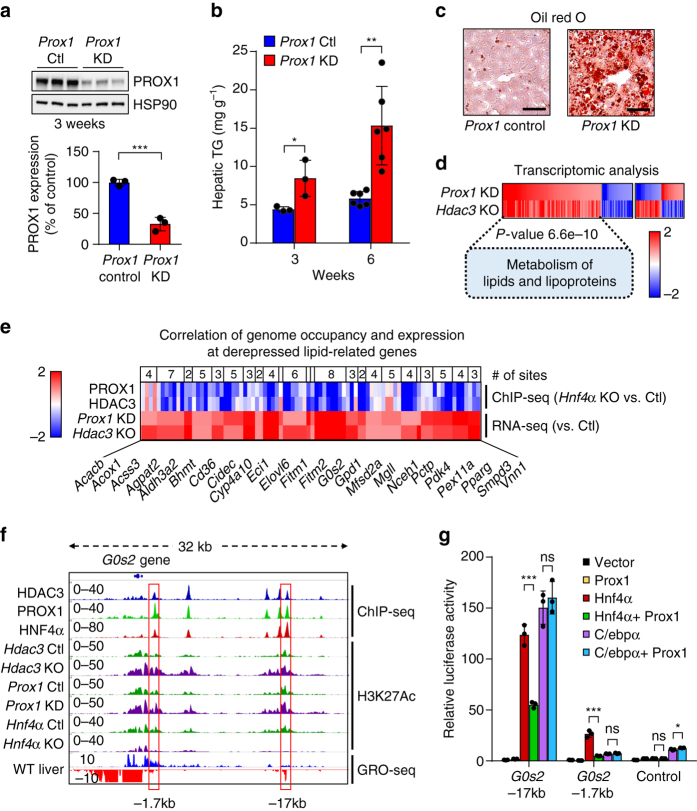
The histone deacetylase HDAC3 is a critical mediator of hepatic lipid metabolism, and liver-specific deletion of HDAC3 leads to fatty liver. To elucidate the underlying mechanism, here we report a method of cross-linking followed by mass spectrometry to define a high-confidence HDAC3 interactome in vivo that includes the canonical NCoR-HDAC3 complex as well as Prospero-related homeobox 1 protein (PROX1). HDAC3 and PROX1 co-localize extensively on the mouse liver genome, and are co-recruited by hepatocyte nuclear factor 4α (HNF4α). The HDAC3-PROX1 module controls the expression of a gene program regulating lipid homeostasis, and hepatic-specific ablation of either component increases triglyceride content in liver. These findings underscore the importance of specific combinations of transcription factors and coregulators in the fine tuning of organismal metabolism.HDAC3 is a critical mediator of hepatic lipid metabolism and its loss leads to fatty liver. Here, the authors characterize the liver HDAC3 interactome in vivo, provide evidence that HDAC3 interacts with PROX1, and show that HDAC3 and PROX1 control expression of genes regulating lipid homeostasis.


Conflict of interest statement

M.A.L. is a member of the Scientific Advisory Boards of KDAC, Eli Lilly and Company, and Pfizer, Inc. The remaining authors declare no competing financial interests.

Figures

Fig. 1
Fig. 1
NEAT ChIP-MS reveals the HDAC3 liver nuclear interactome. a Schematic illustration of the NEAT ChIP-MS protocol. HA-tagged HDAC3 or EGFP was expressed with or without Cre in Hdac3 fl/fl mice specifically in hepatocytes via adeno-associated virus (AAV8 TBG). After isolation of nuclei and cross-linking with formaldehyde, HDAC3 or EGFP control were captured by anti-HA immunoprecipitation. Protein complexes and associated DNA sequences were analyzed by mass spectrometry or high-throughput sequencing, respectively. b Volcano plot of mass spectrometry analysis of HDAC3 interacting proteins (HDAC3 n = 11, EGFP n = 13). The x axis indicates log2 ratio of normalized intensity (iBAQ) of proteins discovered in HDAC3 to EGFP control. Red box indicates fold-change (10-fold) and P-value (0.01) cutoffs for interactors. Core NCoR complex components (blue), selected high scoring interactors (red), and Rev-erbα (green) are indicated. c Heatmap of normalized intensity (iBAQ) of HDAC3 interactors from b in the presence or absence of micrococcal nuclease (MNase) or Benzonase nuclease. Each lane represents an independent experiment. d Co-IP experiments confirming interaction of HDAC3 with PROX1 from liver expressing tagged HDAC3 (top) or endogenous IPs (bottom). e Protein–protein interaction network analysis. Circle color represents enrichment over control and the size of the circle represents −log10(P-value). Nodes displayed met eightfold enrichment cutoff after Benzonase treatment and lines indicate validated interactions (STRING, active interaction sources include experiments and databases, minimum interaction score 0.6). Interactors are grouped by known type and circles indicate known functional complexes
Fig. 2
Fig. 2
HDAC3 and PROX1 exhibit extensive co-binding and reveal a metabolic signature. a Venn diagram displaying overlap of peaks identified in PROX1 (2 rpm cutoff) and HDAC3 (1.5 rpm cutoff) ChIP-seq. Peaks required 50% overlap and have a minimum 1 rpm signal for the other factor. b Representative browser tracks of HDAC3 and PROX1 ChIP-seq. Scale is reads per ten million (RPTM). c Co-occupancy of PROX1 and HDAC3 as indicated by ChIP–reChIP (n = 3) from liver. Legend indicates reChIP antibody following primary PROX1 ChIP elution. Data are presented as mean ± s.d., one-tailed unpaired Student’s t-test, *P < 0.05, **P < 0.01, ***P < 0.001, ns not significant. d Reactome analysis of the nearest genes within 100 kb from the top 1000 overlapping HDAC3 and PROX1 peaks. e HOMER motif analysis of co-bound peaks displaying over-represented sequences. f HOMER motif enrichment analysis of the indicated motifs (HNF4α and Rev-erbα DR2) at overlapping and non-overlapping peaks determined in (a). Numbers above brackets indicate P-values, χ 2 test
Fig. 3
Fig. 3
The HDAC3–PROX1 module is recruited by HNF4α in liver. a Comparison of HNF4α binding (>2 rpm, filtered on the HNF4α KO, 50% minimum overlap) at overlapping and non-overlapping peaks in the HDAC3 and PROX1 cistromes from Fig. 2a. Numbers above brackets indicate P-values, χ 2 test. b HOMER motif analysis of peaks co-bound by HDAC3, PROX1, and HNF4α displaying over-represented sequences. c Representative browser tracks of HNF4α, PROX1, and HDAC3 ChIP-seq in Hnf4α fl/fl livers infected with AAV8 TBG Egfp (Ctl) or Cre (Hnf4α KO). Indicated scales are in RPTM. d Scatter plots of PROX1 (left) and HDAC3 (right) ChIP-seq in control versus Hnf4α KO. Red and blue shaded regions indicate a twofold decrease in peak intensity upon loss of HNF4α. e, f Co-occupancy of HDAC3–PROX1 and HNF4α as indicated by ChIP–reChIP (n = 3) from liver. Legend indicates reChIP antibody following primary HDAC3 or PROX1 ChIP elution. Data are presented as mean ± s.d, one-tailed unpaired Student’s t-test, *P < 0.05, **P < 0.01, ***P < 0.001, ns not significant
Fig. 4
Fig. 4
The HDAC3–PROX1 module suppresses steatosis by controlling a hepatic lipid metabolism gene program. a Western blot of liver samples from mice treated for 3 weeks with AAV8 TBG shLuciferase (Prox1 Ctl) or shPROX1 (Prox1 KD). Densitometry of the western blot shown above (n = 3). Data are presented as mean ± s.d. b Hepatic triglyceride assay of livers infected for 3 weeks (n = 3) or 6 weeks (n = 6) with indicated virus. Data are presented as mean ± s.d. c Oil red O staining of livers infected for 6 weeks as in (b). Scale bar is 50 µm. d RNA-seq analysis of Hdac3 fl/fl mice infected for 2 weeks with AAV8 TBG Egfp (n = 2) or Cre (Hdac3 KO, n = 3) vs. wild-type mice infected with AAV8 TBG shLuciferase (n = 3) or shPROX1 (Prox1 KD, n = 3) for 3 weeks. Heatmap displays coregulated genes (1.7-fold change, P < 0.05) grouped by expression correlation (135 genes) or anti-correlation (50 genes) upon ablation of HDAC3 or PROX1. Scale bar represents log2(fold change). Inset shows the P-value and corresponding gene list for the highest ranking Reactome pathway in the co-upregulated cluster. e Heatmap displays co-upregulated lipid-related genes upon ablation of HDAC3 or PROX1 and the corresponding binding strength of adjacent HDAC3–PROX1 co-bound peaks (−50kb upstream of the transcription start site, TSS through +2 kb from the transcription end site, TES) in the HNF4α KO liver relative to control. Scale bar represents log2(fold change) for RNA-seq and fold-change for ChIP-seq. f Example ChIP-seq and GRO-seq browser tracks at the G0s2 locus. Red boxes indicate location of putative G0s2 enhancers. g Luciferase assay (n = 3) indicating transcriptional response to co-expression of HNF4α, PROX1 and C/EBPα at G0s2 enhancers as identified in (f). Data are presented as mean ± s.d. Two-tailed unpaired Student’s t-test, *P < 0.05, **P < 0.01, ***P < 0.001, ns not significant

References

    1. Browning JD, Horton JD. Molecular mediators of hepatic steatosis and liver injury. J. Clin. Invest. 2004;114:147–152. doi: 10.1172/JCI200422422. - DOI - PMC - PubMed
    1. Tilg H, Moschen AR, Roden M. NAFLD and diabetes mellitus. Nat. Rev. Gastroenterol. Hepatol. 2016;14:32–42. doi: 10.1038/nrgastro.2016.147. - DOI - PubMed
    1. Cohen JC, Horton JD, Hobbs HH. Human fatty liver disease: old questions and new insights. Science. 2011;332:1519–1523. doi: 10.1126/science.1204265. - DOI - PMC - PubMed
    1. Sladek FM, Zhong WM, Lai E, Darnell JE. Liver-enriched transcription factor HNF-4 is a novel member of the steroid hormone receptor superfamily. Genes Dev. 1990;4:2353–2365. doi: 10.1101/gad.4.12b.2353. - DOI - PubMed
    1. Hayhurst GP, Lee YH, Lambert G, Ward JM, Gonzalez FJ. Hepatocyte nuclear factor 4alpha (nuclear receptor 2A1) is essential for maintenance of hepatic gene expression and lipid homeostasis. Mol. Cell Biol. 2001;21:1393–1403. doi: 10.1128/MCB.21.4.1393-1403.2001. - DOI - PMC - PubMed

Publication types

MeSH terms