

An ENU-induced splice site mutation of mouse Col1a1 causing recessive osteogenesis imperfecta and revealing a novel splicing rescue
- PMID: 28916811
- PMCID: PMC5600972
- DOI: 10.1038/s41598-017-10343-9
An ENU-induced splice site mutation of mouse Col1a1 causing recessive osteogenesis imperfecta and revealing a novel splicing rescue
Abstract
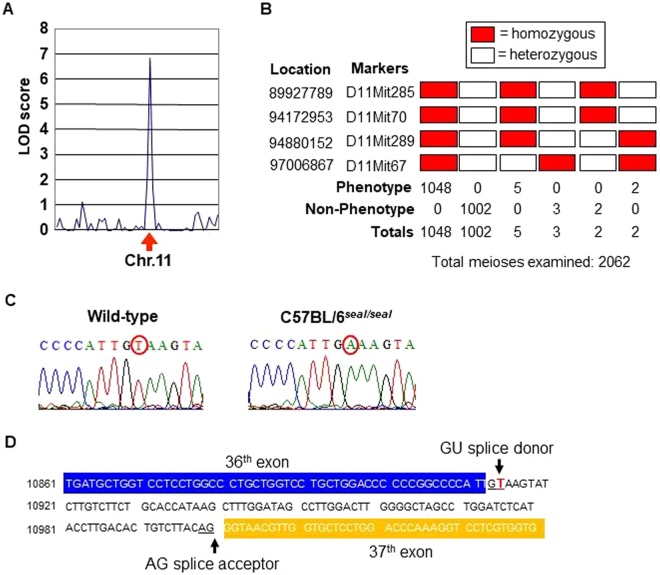
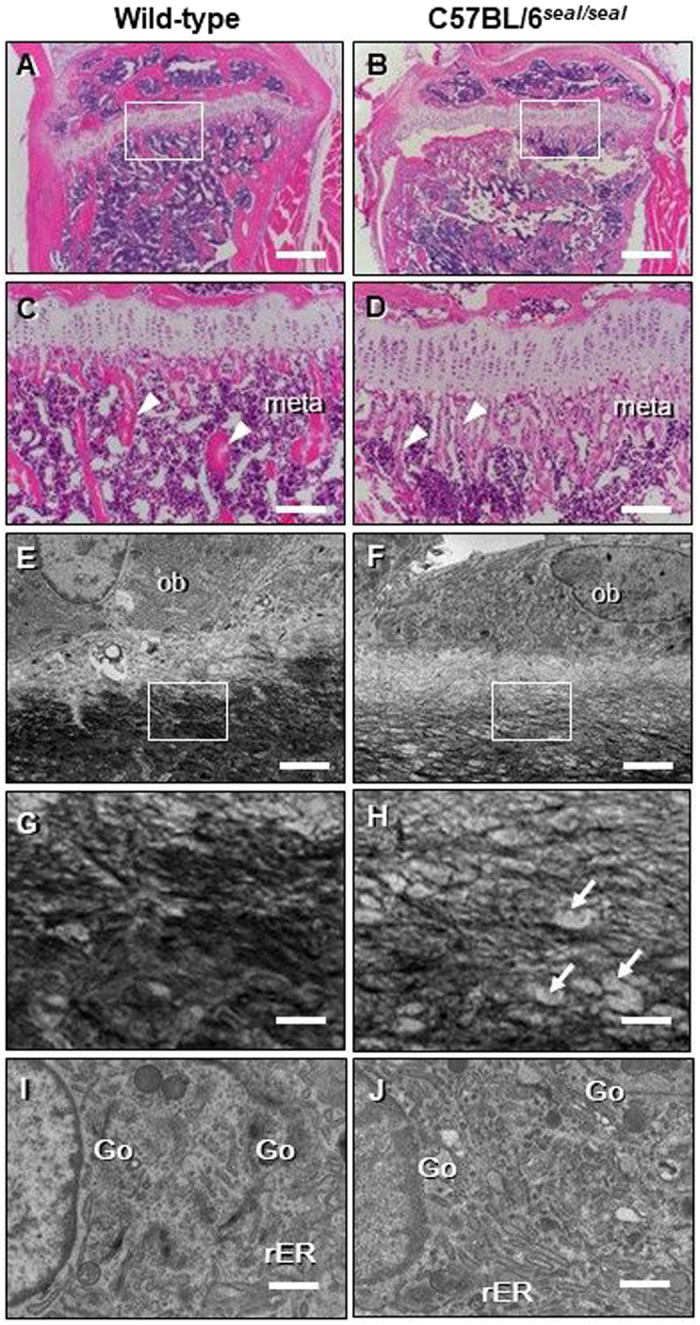
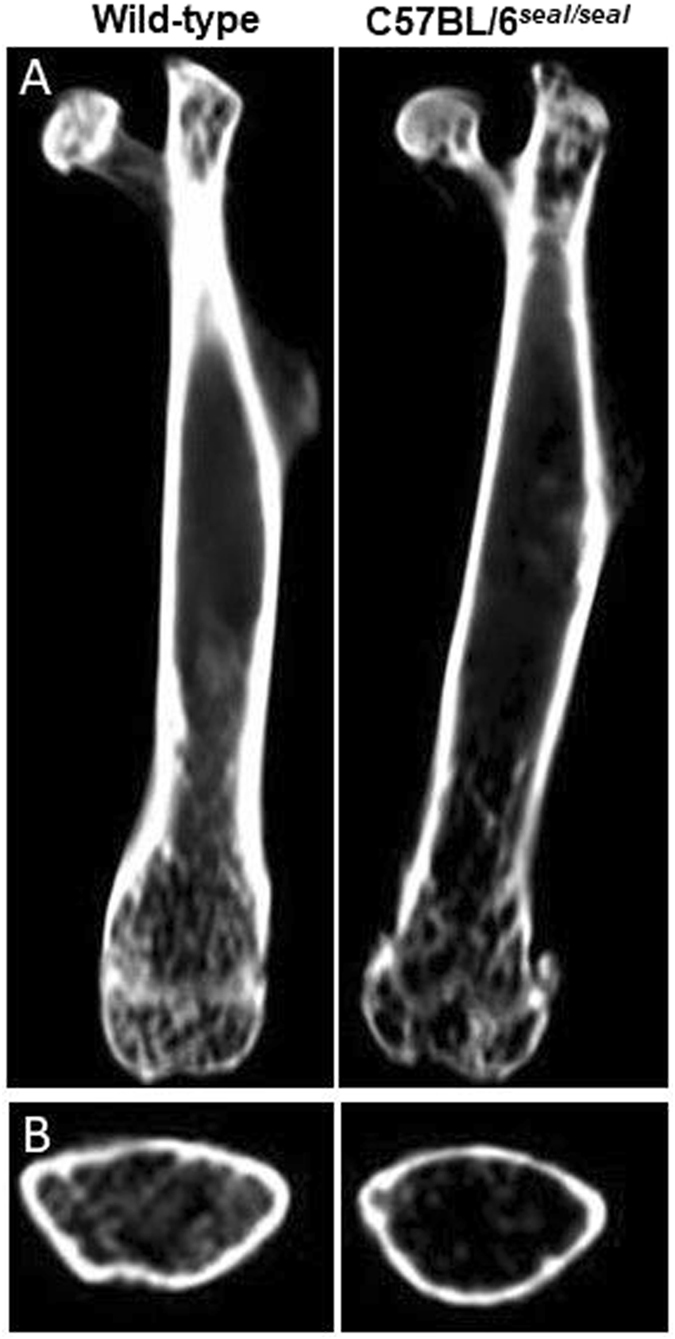
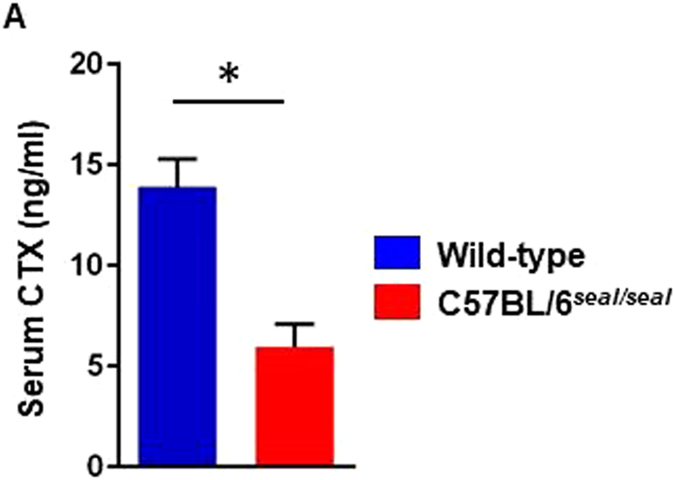
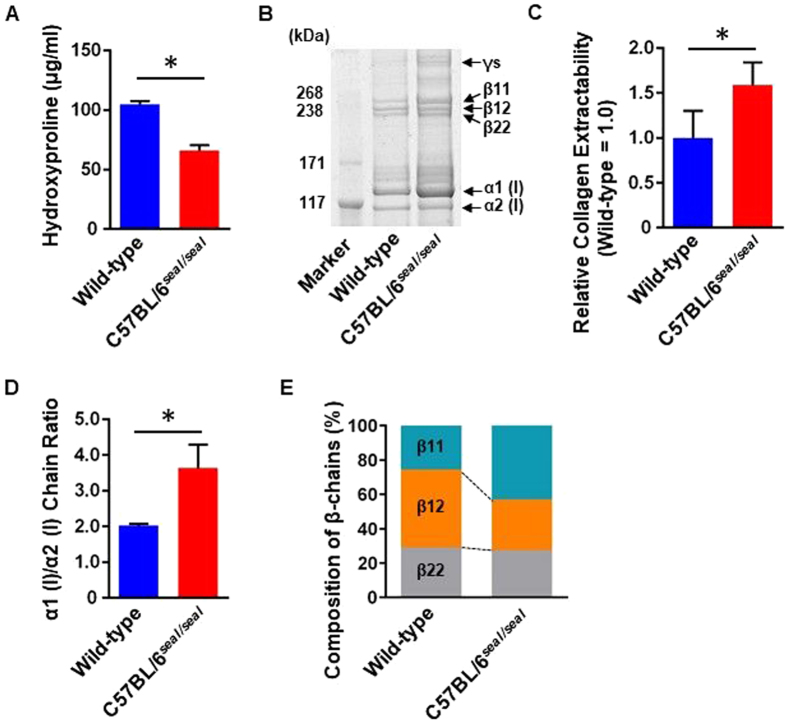
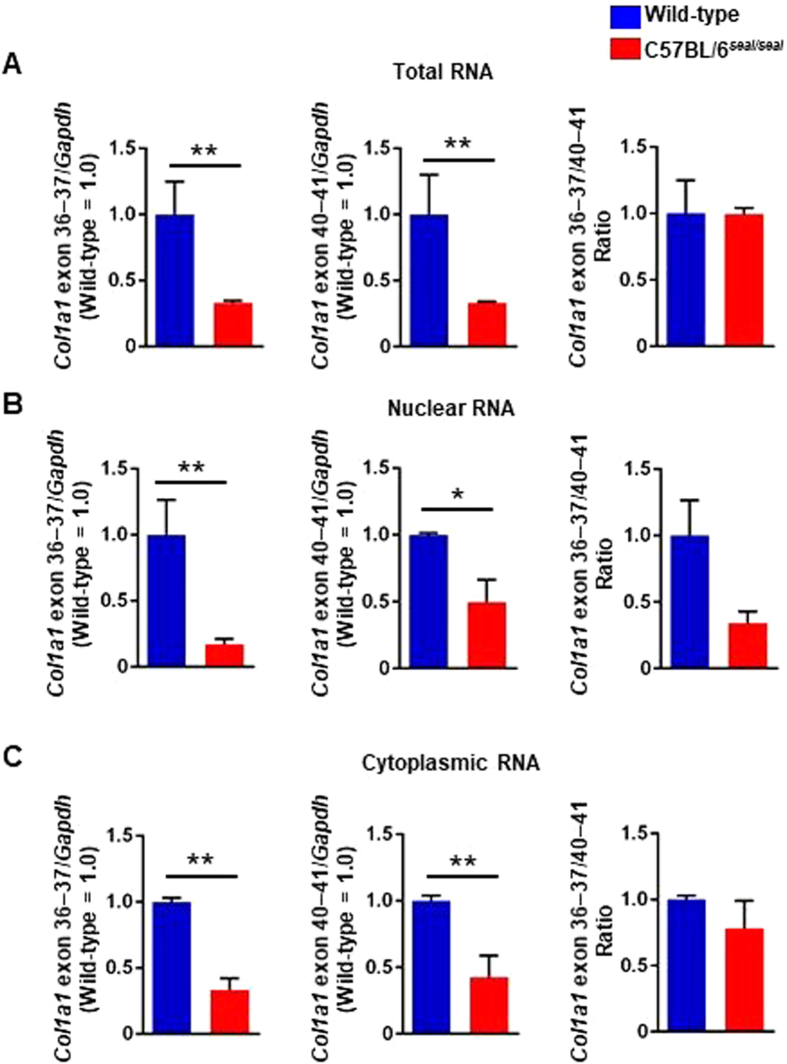
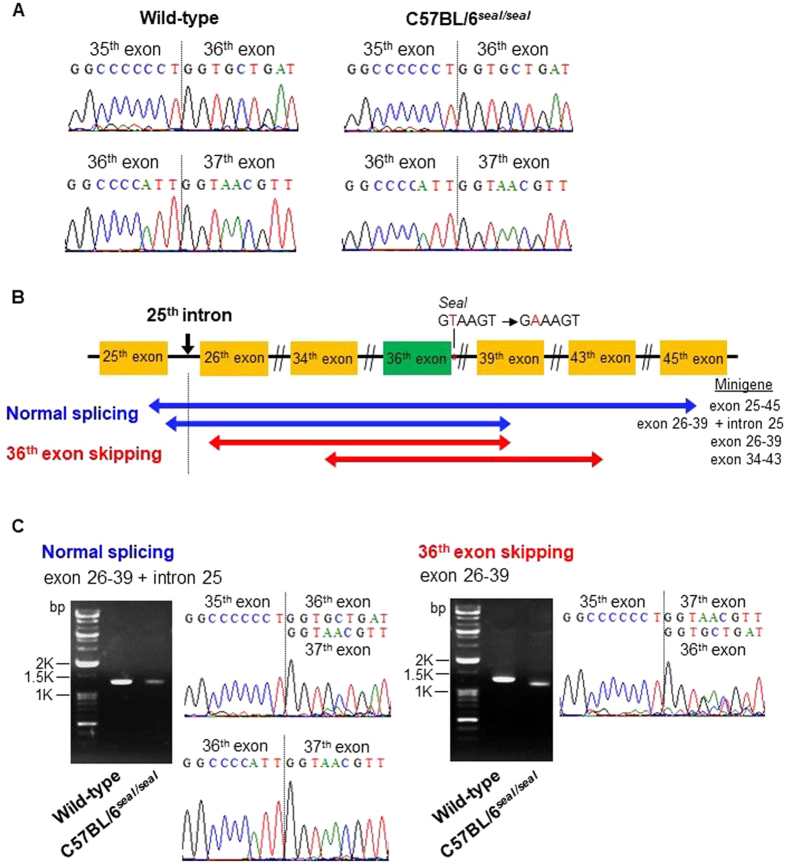
GU-AG consensus sequences are used for intron recognition in the majority of cases of pre-mRNA splicing in eukaryotes. Mutations at splice junctions often cause exon skipping, short deletions, or insertions in the mature mRNA, underlying one common molecular mechanism of genetic diseases. Using N-ethyl-N-nitrosourea, a novel recessive mutation named seal was produced, associated with fragile bones and susceptibility to fractures (spine and limbs). A single nucleotide transversion (T → A) at the second position of intron 36 of the Col1a1 gene, encoding the type I collagen, α1 chain, was responsible for the phenotype. Col1a1 seal mRNA expression occurred at greatly reduced levels compared to the wild-type transcript, resulting in reduced and aberrant collagen fibers in tibiae of seal homozygous mice. Unexpectedly, splicing of Col1a1 seal mRNA followed the normal pattern despite the presence of the donor splice site mutation, likely due to the action of a putative intronic splicing enhancer present in intron 25, which appeared to function redundantly with the splice donor site of intron 36. Seal mice represent a model of human osteogenesis imperfecta, and reveal a previously unknown mechanism for splicing "rescue."
Conflict of interest statement
The authors declare that they have no competing interests.
Figures

Similar articles
-
Redefinition of exon 7 in the COL1A1 gene of type I collagen by an intron 8 splice-donor-site mutation in a form of osteogenesis imperfecta: influence of intron splice order on outcome of splice-site mutation.Am J Hum Genet. 1999 Aug;65(2):336-44. doi: 10.1086/302512. Am J Hum Genet. 1999. PMID: 10417276 Free PMC article.
-
A Deep Intronic Splice Variant in COL1A1 Causing Osteogenesis Imperfecta Type II.Am J Med Genet A. 2025 May;197(5):e63972. doi: 10.1002/ajmg.a.63972. Epub 2024 Dec 22. Am J Med Genet A. 2025. PMID: 39711104
-
A 5' splice site mutation affecting the pre-mRNA splicing of two upstream exons in the collagen COL1A1 gene. Exon 8 skipping and altered definition of exon 7 generates truncated pro alpha 1(I) chains with a non-collagenous insertion destabilizing the triple helix.Biochem J. 1994 Sep 15;302 ( Pt 3)(Pt 3):729-35. doi: 10.1042/bj3020729. Biochem J. 1994. PMID: 7945197 Free PMC article.
-
Splicing mutations in inherited retinal diseases.Prog Retin Eye Res. 2021 Jan;80:100874. doi: 10.1016/j.preteyeres.2020.100874. Epub 2020 Jun 15. Prog Retin Eye Res. 2021. PMID: 32553897 Review.
-
Biomedical impact of splicing mutations revealed through exome sequencing.Mol Med. 2012 Mar 30;18(1):314-9. doi: 10.2119/molmed.2011.00126. Mol Med. 2012. PMID: 22160217 Free PMC article. Review.
Cited by
-
The Transcription Factor HAND1 Is Involved in Cortical Bone Mass through the Regulation of Collagen Expression.Int J Mol Sci. 2020 Nov 16;21(22):8638. doi: 10.3390/ijms21228638. Int J Mol Sci. 2020. PMID: 33207791 Free PMC article.
-
An Update on Animal Models of Osteogenesis Imperfecta.Calcif Tissue Int. 2022 Oct;111(4):345-366. doi: 10.1007/s00223-022-00998-6. Epub 2022 Jun 29. Calcif Tissue Int. 2022. PMID: 35767009 Review.
-
Curative Cell and Gene Therapy for Osteogenesis Imperfecta.J Bone Miner Res. 2022 May;37(5):826-836. doi: 10.1002/jbmr.4549. Epub 2022 Apr 17. J Bone Miner Res. 2022. PMID: 35306687 Free PMC article. Review.
-
Association between the Sp1-binding-site polymorphism in the collagen type I alpha 1 (COLIA1) gene and bone phenotypes: the Dubbo Osteoporosis Epidemiology Study.J Bone Miner Metab. 2025 Mar;43(2):114-122. doi: 10.1007/s00774-024-01558-8. Epub 2024 Nov 6. J Bone Miner Metab. 2025. PMID: 39505754
-
Main and Minor Types of Collagens in the Articular Cartilage: The Role of Collagens in Repair Tissue Evaluation in Chondral Defects.Int J Mol Sci. 2021 Dec 11;22(24):13329. doi: 10.3390/ijms222413329. Int J Mol Sci. 2021. PMID: 34948124 Free PMC article. Review.
References
Publication types
MeSH terms
Substances
Grants and funding
LinkOut - more resources
Full Text Sources
Other Literature Sources
Medical
Molecular Biology Databases
Miscellaneous
