. 2017 Sep 16:6:e28974.
doi: 10.7554/eLife.28974.

Direct modulation of aberrant brain network connectivity through real-time NeuroFeedback

Affiliations

Direct modulation of aberrant brain network connectivity through real-time NeuroFeedback

Michal Ramot et al. Elife. .

Abstract

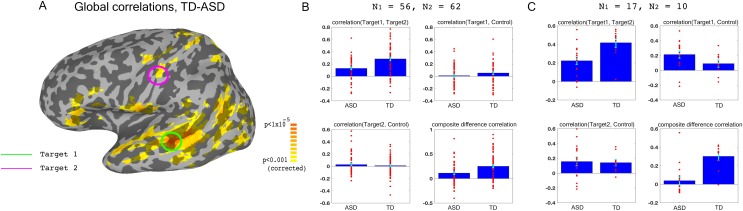
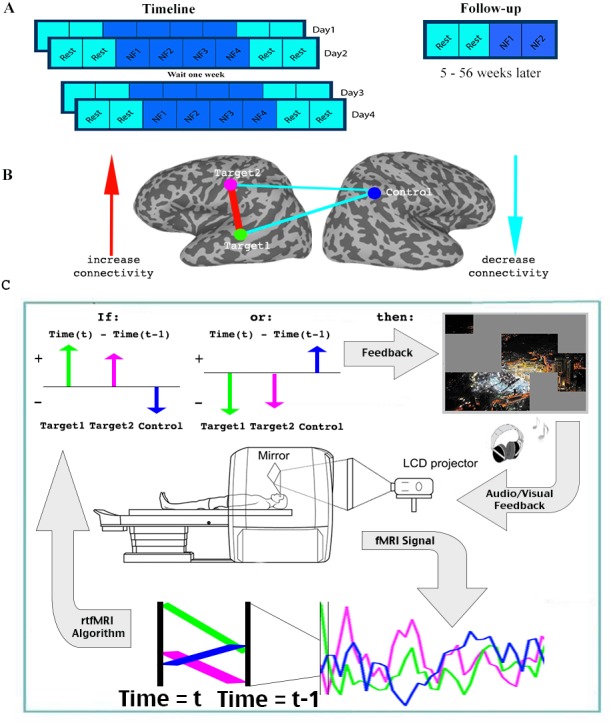
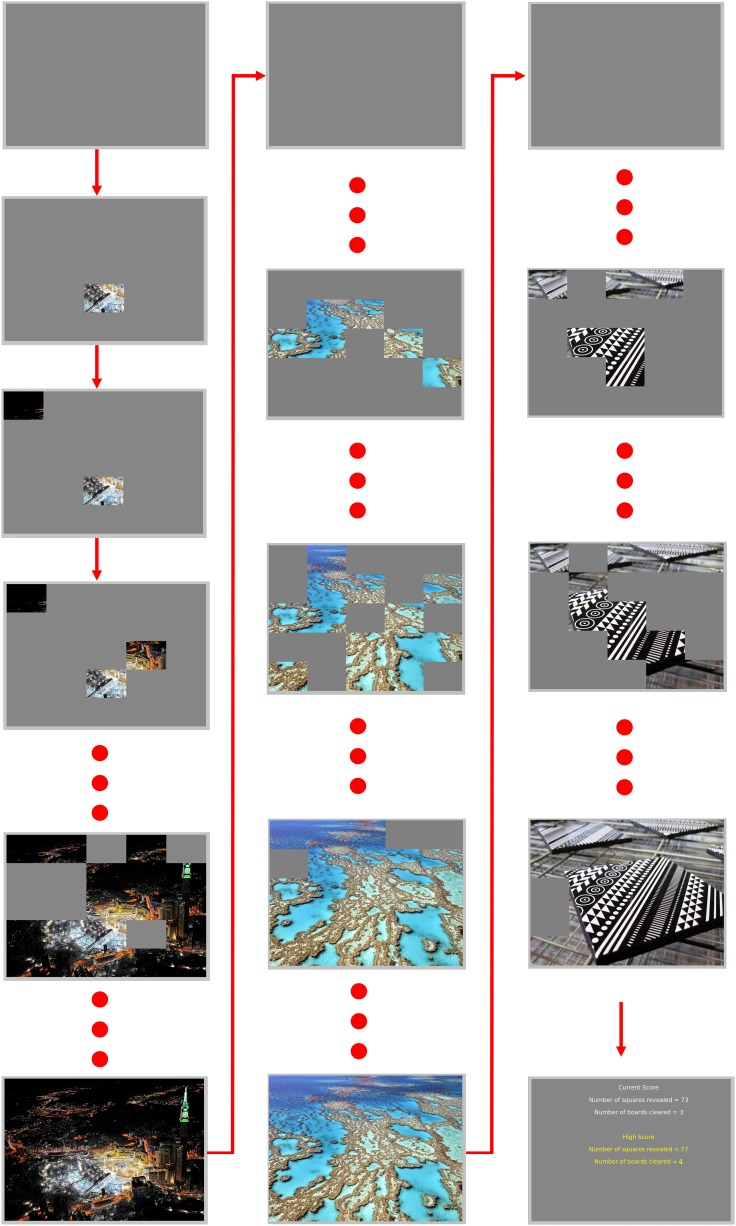
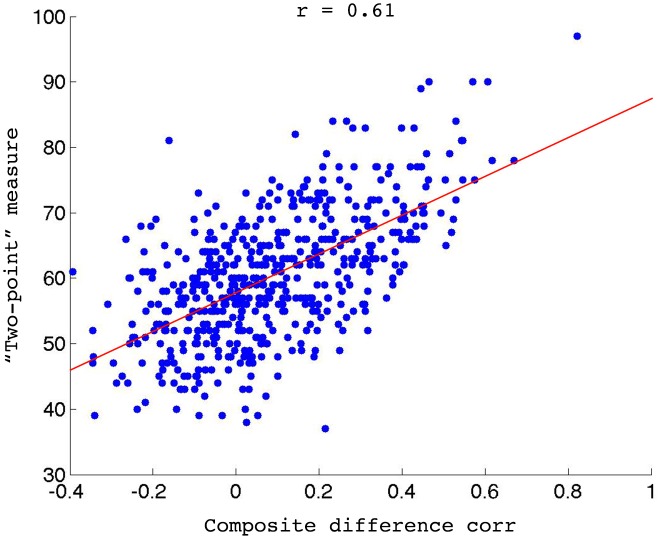
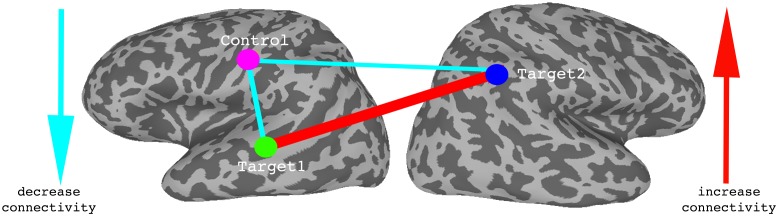
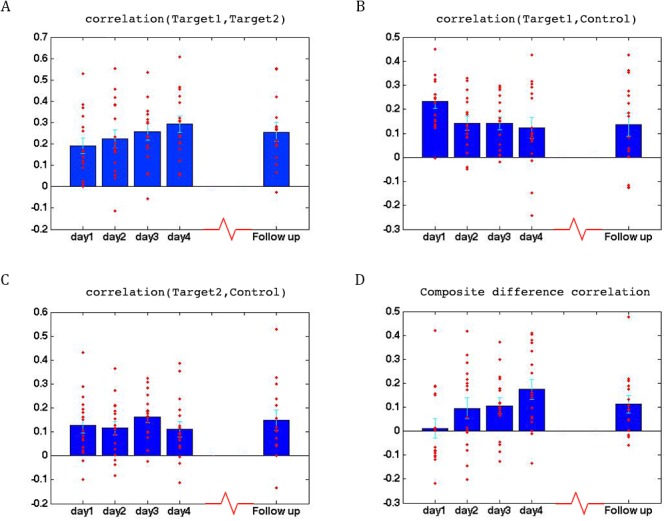
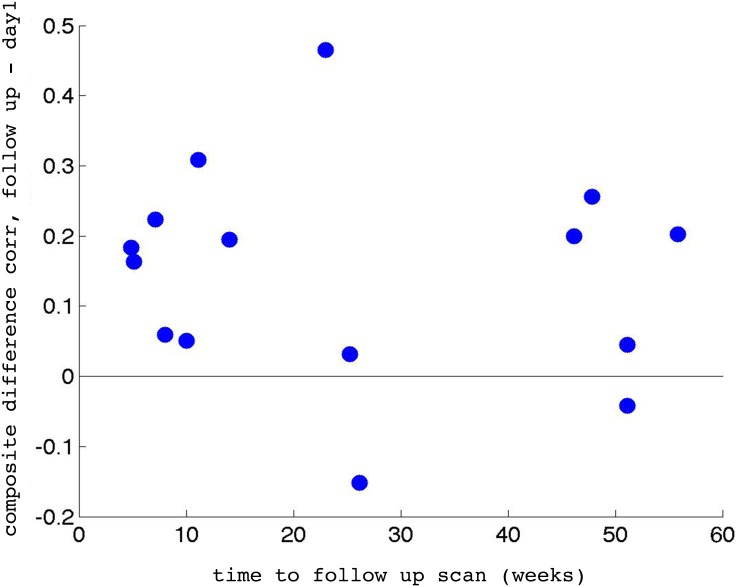
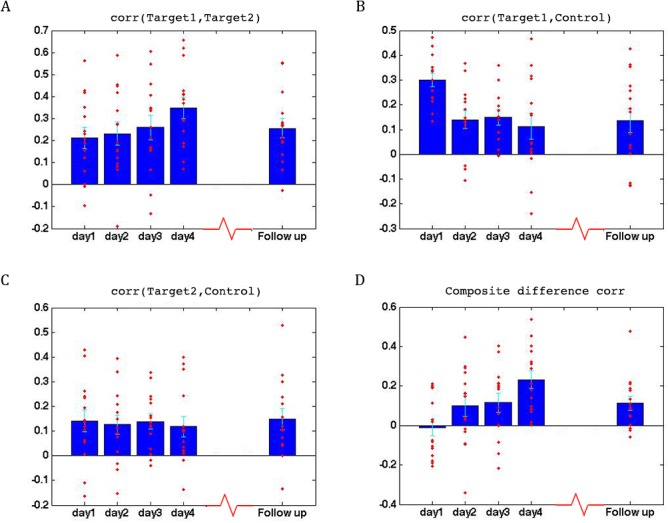
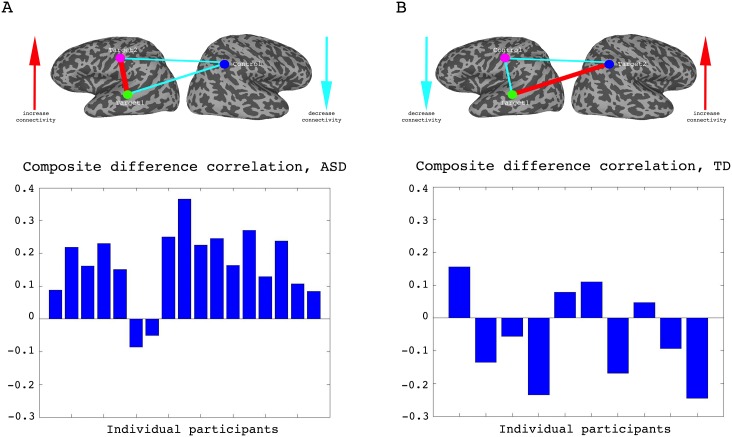
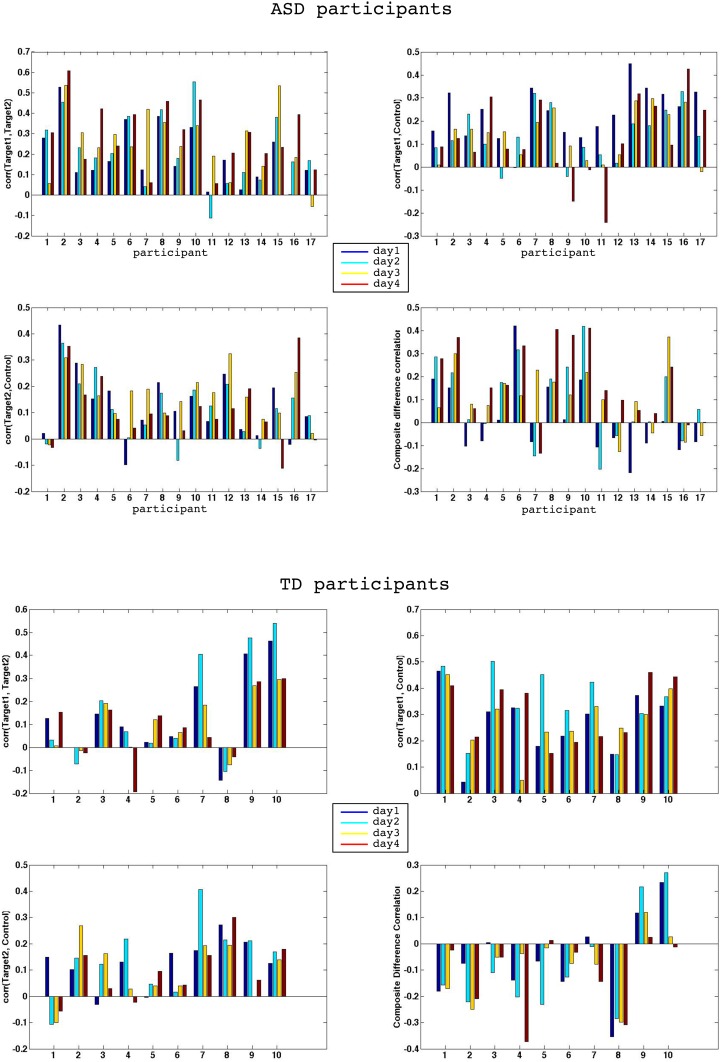
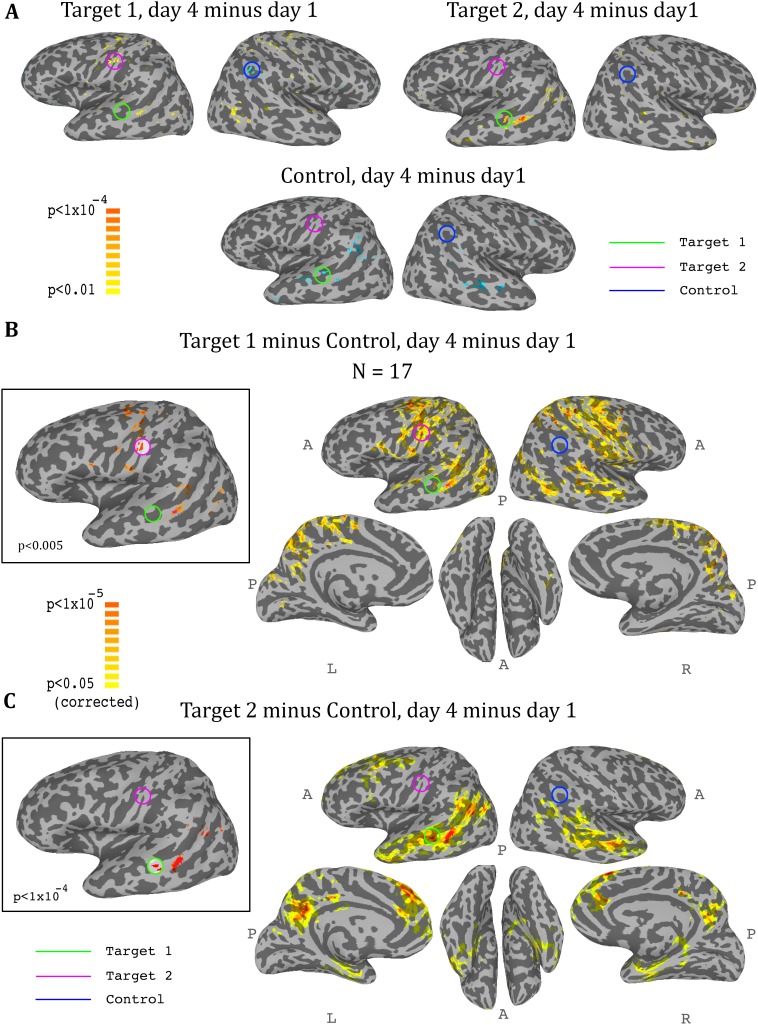
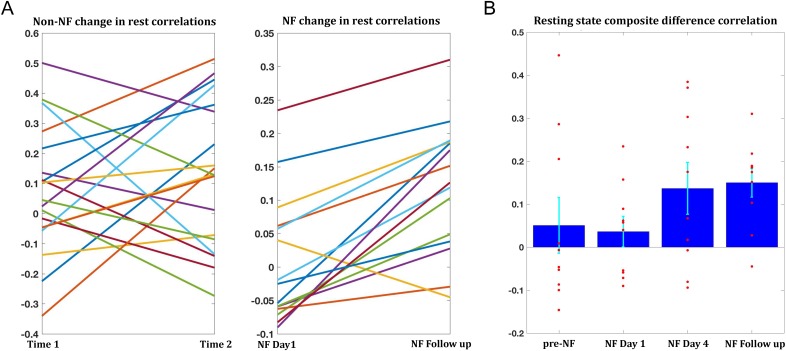
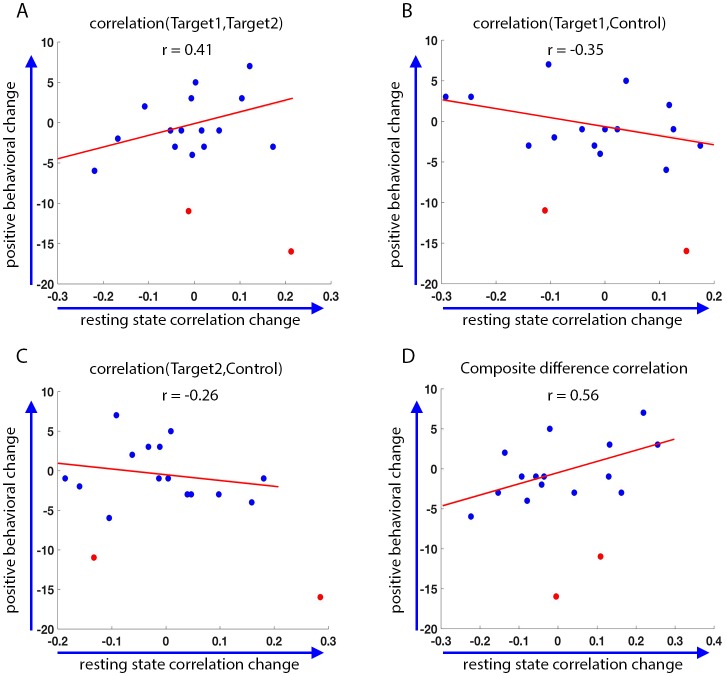
The existence of abnormal connectivity patterns between resting state networks in neuropsychiatric disorders, including Autism Spectrum Disorder (ASD), has been well established. Traditional treatment methods in ASD are limited, and do not address the aberrant network structure. Using real-time fMRI neurofeedback, we directly trained three brain nodes in participants with ASD, in which the aberrant connectivity has been shown to correlate with symptom severity. Desired network connectivity patterns were reinforced in real-time, without participants' awareness of the training taking place. This training regimen produced large, significant long-term changes in correlations at the network level, and whole brain analysis revealed that the greatest changes were focused on the areas being trained. These changes were not found in the control group. Moreover, changes in ASD resting state connectivity following the training were correlated to changes in behavior, suggesting that neurofeedback can be used to directly alter complex, clinically relevant network connectivity patterns.

Keywords: ASD; human; neurofeedback; neuroscience; real-time fMRI.


Conflict of interest statement

No competing interests declared.

Figures

Figure 1.
Figure 1.. Choosing ROIs.
(A) Group differences between TD (N = 62) and ASD participants (N = 56), matched for motion, age and IQ. Difference maps calculated on the average correlation of each voxel with all other grey matter voxels in the brain. Target1 was chosen as the region with the greatest between-group difference, and Target2 was chosen as the region in which the difference in connectivity to Target1 was greatest between groups, while also being in a physically distant, distinct network based on (Gotts et al., 2012). (B) Pairwise correlations for the dataset shown in (A), between the two targets (top left), target1 and control (top right), target2 and control (bottom left), and the composite difference measure, based on the difference in correlations between the two targets and the target-control pairs (see Materials and methods). Difference between the ASD and TD groups is significant for target1-target2 correlations (p=4.3×10⁻⁵), and the composite difference measure (p=0.001). (C) Same as (B), but for the current cohort of participants who took part in the neurofeedback study. Correlations are averaged across the first two rest scans of the first day, before training. Between group difference is significant for target1-target2 correlations (p=0.002), target1-control correlations (p=0.04), and the composite difference measure (p<1×10⁻⁴). Blue bars represent the subject mean, cyan error bars mark ± SEM. Red dots represent each individual subject.
Figure 2.
Figure 2.. Experimental paradigm.
(A) Timeline. (B) Location of ROIs, and network being trained. (C) Feedback session. Data was collected and analyzed in real-time, and a decision whether to present feedback (reveal a square of the picture +positive sound) was made based on the change in signal from one time (t-1) to the next (t) in the three ROIs. Feedback was given if the direction of change in the two targets was the same, and opposite from the direction of change in the control ROI. See.
Figure 2—figure supplement 1.
Figure 2—figure supplement 1.. Puzzle task examples.
Participants were asked to attempt to reveal the picture, and feedback was presented in the form of a picture square becoming visible, coupled with a positive tone. There were 25 squares per ‘puzzle’, and a new puzzle began as soon as the previous one had been completed, until the end of the scan when the current and high score for that day were presented.
Figure 2—figure supplement 2.
Figure 2—figure supplement 2.. Validating the feedback method.
Overall composite difference correlation measure for each scan, plotted against the number of feedback responses when the same data is run through the real-time algorithm.
Figure 2—figure supplement 3.
Figure 2—figure supplement 3.. TD control group training.
The diagram shows the direction of training in the TD control group. As with the ASD group, participants were rewarded for the ‘correct’ network configuration by revelation of a piece of the puzzle, coupled with a short upbeat auditory sound. The three network nodes also remained the same, the only difference was in their designation as ‘targets’ or ‘control’. While the STS node remained a target, the somatosensory node became the control, and the IPL was the second target. Participants were therefore trained to increase connectivity between STS and IPL, while reducing their connectivity with the somatosensory node.
Figure 3.
Figure 3.. Learning across days, ASD group.
(A) Correlations between the two target regions per day, averaged across all four neurofeedback scans per day. Blue bars represent the subject mean, cyan error bars mark ± SEM. Red dots represent each individual subject. The difference in correlations between day1 and days 3 and 4 and the follow up is significant (p=0.05, p=4×10⁻⁴, p=0.05 respectively), as is the difference between day2 and day4 (p=0.016). (B) Correlations between Target1 and Control. There is a significant change between day1 and all other days (p=0.005, p=5×10⁻⁴, p=8×10⁻⁴ for days 2, 3 and 4, p=0.015 for the follow up). (C) Correlations between Target2 and Control. (D) Composite difference measure, showing the difference between target-target and target-control correlation pairs (see Materials and methods). Day1 correlations are significantly different from all other days (p=0.003, p=0.01, and p=2×10⁻⁴, p=0.007 respectively), and day2 is significant different from day4 (p=0.0017). In all panels N = 17 for days 1–4, N = 15 for the follow up. All p-values for differences between days were determined by permutation tests.
Figure 3—figure supplement 1.
Figure 3—figure supplement 1.. Retention of learning.
Change in the composite difference measure averaged across the two neurofeedback runs during the follow up experiment and the same measure on day1 of the training, vs. time from the original experiment to the follow up, in weeks. No significant correlation was found between the two (r = −0.12) suggesting that our neurofeedback procedure induced a stable change that did not dissipate over time. N = 15, the number of participants who returned for the follow up scan.
Figure 3—figure supplement 2.
Figure 3—figure supplement 2.. Data from first two neurofeedback scans only.
As the follow up experiment had only two neurofeedback runs as opposed to the four neurofeedback runs in the original experiment (all 9 min), and only 15/17 participants, we repeated the same analysis shown in Figure 3 using just the first two neurofeedback runs for the original 4 days, and the 15 participants that were included in the follow up. This did not impact the results, and significant changes between days stayed the same as before.
Figure 4.
Figure 4.. Individual participant data.
(A) Difference in the composite difference correlation from day1 to day4, for each of the 17 individual ASD participants averaged across all four neurofeedback scans per day, presented chronologically in order of scanning. (B) Same analysis for each of the 10 TD participants, presented chronologically. Note that the composite difference measure is comprised of target-target correlations minus the target-control pairs, and that the definition of targets and control differed between the two groups.
Figure 4—figure supplement 1.
Figure 4—figure supplement 1.. Individual participants.
Full correlation data for all four days for each individual participant. Top half shows ASD data, bottom half TD control group data. Blue bars denote day1, cyan day2, yellow day3 and red day4. Note that 15/17 ASD participants show an increase in the composite difference score from day1 to day4, 14/17 show an increase in Target1, Target2 correlations, and 14/17 show a decrease in the correlation between Target1 and Control. In contrasts, 5/10 TDs show an increase in Target1, Target2 correlations, 4/10 show a decrease in correlations between Target1 and Control, and 5/10 show a decrease in correlations between Target2 and Control, exactly at chance level.
Figure 5.
Figure 5.. Whole-brain analysis during neurofeedback, ASD group.
(A) Top left: change in correlations to target1, between day1 and day4, t-test across participants. High values represent voxels that showed a consistent change between day1 and day4, such that on day4 they were more correlated to target1 than they were on day1. Note the positive peak in target2, and the negative peak in the control region. Top right: change in correlations to target2, between day1 and day4, t-test across participants. Note the positive peak in target1. Bottom: change in correlations to the control region, between day1 and day4, t-test across participants. Note the negative peak in target1 and bilateral STS. (B) Change in differential correlation to the target1 and control ROIs, between day1 and day4, t-test across participants. High values represent voxels that showed a consistent change between day1 and day4, such that on day4 they were more correlated to target1 and less correlated to control than they were on day1. Inset shows the same analysis at a higher threshold. (C) Same as (B), for target2 and control. Note that for both maps, the other target, which was not included in the analysis, emerges as the area of greatest change across training days. Maps corrected through permutation tests (see Materials and methods).
Figure 6.
Figure 6.. Changes in resting state correlations.
(A) Left panel shows the changes in resting state composite difference correlations for the 19 participants for which two previous data points were available from a previous study, prior to neurofeedback (average time between sessions 13.2 months). The right panel shows the change in resting state composite difference correlations from the very first pre-training rest sessions on the first day of neurofeedback, to the rest sessions collected in the follow up session (also before the neurofeedback training sessions that day), for the 15 participants who took part in the follow up session. Average time between sessions for this group was 6.2 months. (B) Changes in resting state composite difference correlations for the 10 participants who had data from both the previous study, and the follow up session. Change between neurofeedback day1 and neurofeedback day4 as well as neurofeedback follow up, are significant (p=0.019, p=0.003 respectively). All correlations are taken from the resting state scans at the beginning of the relevant session. NF = neurofeedback.
Figure 7.
Figure 7.. Behavioral changes.
Correlation between the change in the behavioral measure (SRS) score before and after training, and the change in resting state connectivity from the post-training rest scans on day4 to the rest scans on day1 (day4 correlations minus day1 correlations, positive change corresponds to higher correlations on day4). Behavioral change on the y-axis calculated as pre-training overall SRS t-score minus post-training SRS t-score. Positive behavioral change corresponds to a reduction in SRS score after training. Statistical outliers marked in red. (A) Behavioral change vs. change in Target1-Target2 correlations. (B) Behavior vs. Target1-Control. (C) Behavior vs. Target2-Control. (D) Behavior vs. composite difference corr. R values represent Pearson’s correlation. Regression lines and R values do not include the outliers. Correlations between Target1-Target2 and Target1-Control changes and behavior are in the expected direction but are not significant (p=0.07, p=0.08). Behavior vs. composite difference change is significant (p=0.016).

Similar articles

Cited by

References

    1. Adolphs R. The social brain: neural basis of social knowledge. Annual Review of Psychology. 2009;60:693–716. doi: 10.1146/annurev.psych.60.110707.163514. - DOI - PMC - PubMed
    1. Allison T, Puce A, McCarthy G. Social perception from visual cues: role of the STS region. Trends in Cognitive Sciences. 2000;4:267–278. doi: 10.1016/S1364-6613(00)01501-1. - DOI - PubMed
    1. Amano K, Shibata K, Kawato M, Sasaki Y, Watanabe T. Learning to associate orientation with color in early visual areas by associative decoded fmri neurofeedback. Current Biology. 2016;26:1861–1866. doi: 10.1016/j.cub.2016.05.014. - DOI - PMC - PubMed
    1. Anderson JS, Nielsen JA, Froehlich AL, DuBray MB, Druzgal TJ, Cariello AN, Cooperrider JR, Zielinski BA, Ravichandran C, Fletcher PT, Alexander AL, Bigler ED, Lange N, Lainhart JE. Functional connectivity magnetic resonance imaging classification of autism. Brain. 2011;134:3742–3754. doi: 10.1093/brain/awr263. - DOI - PMC - PubMed
    1. Anderson V, Jacobs R, Harvey AS. Prefrontal lesions and attentional skills in childhood. Journal of the International Neuropsychological Society. 2005;11:817–831. doi: 10.1017/S1355617705051052. - DOI - PubMed

Publication types