

Emergent behaviors in RBCs flows in micro-channels using digital particle image velocimetry
- PMID: 28918110
- PMCID: PMC7243346
- DOI: 10.1016/j.mvr.2017.09.003
Emergent behaviors in RBCs flows in micro-channels using digital particle image velocimetry
Abstract
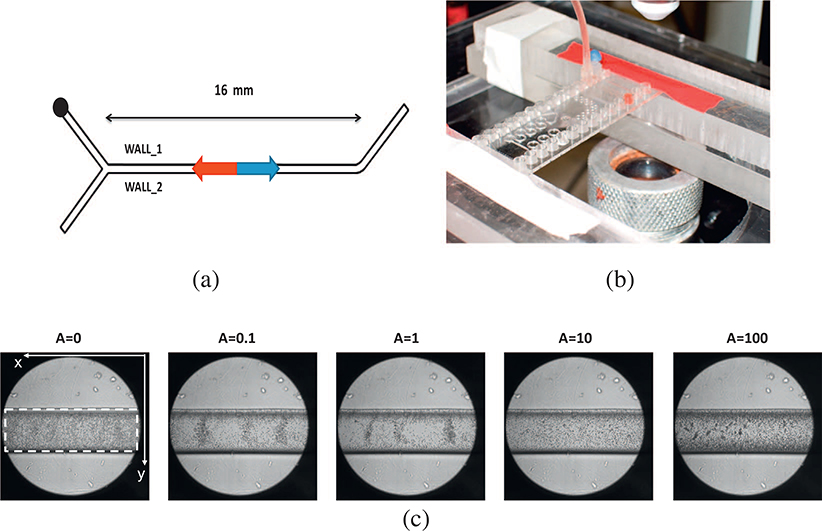
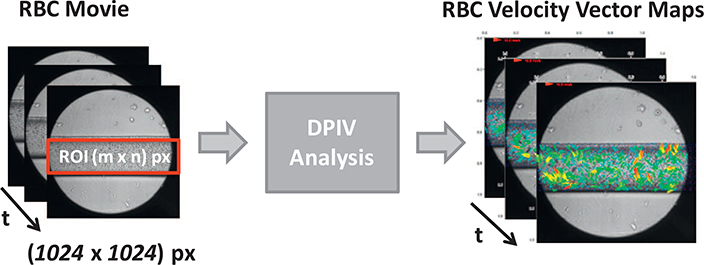
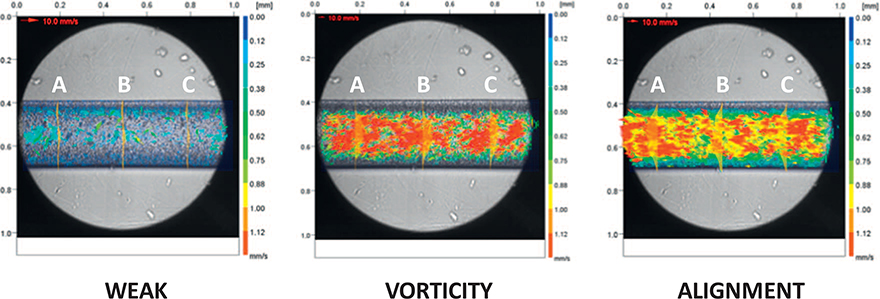
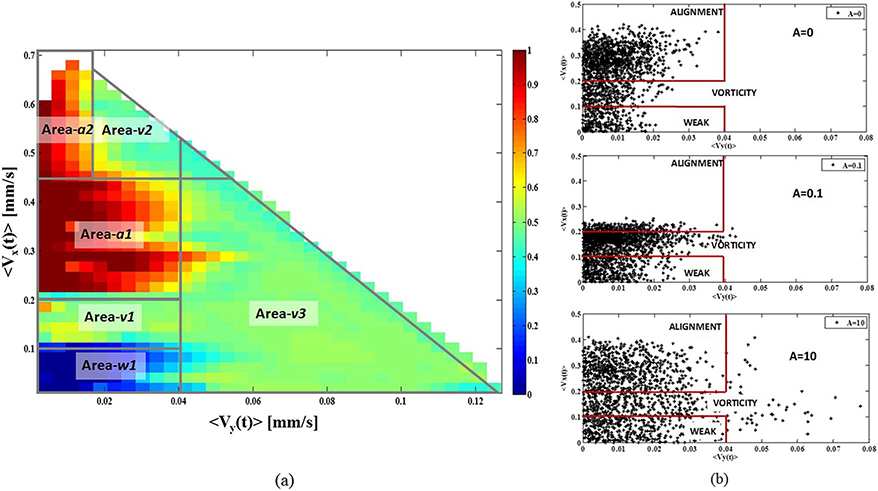
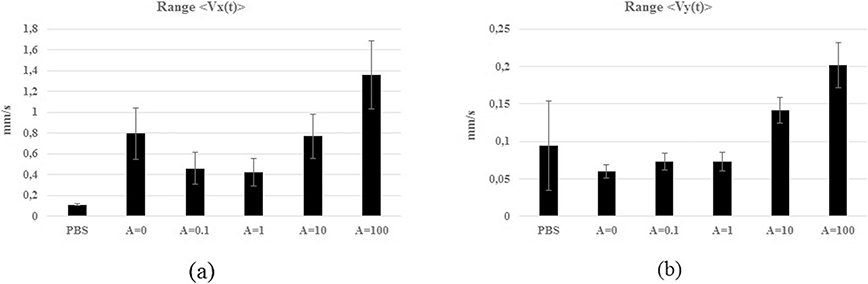
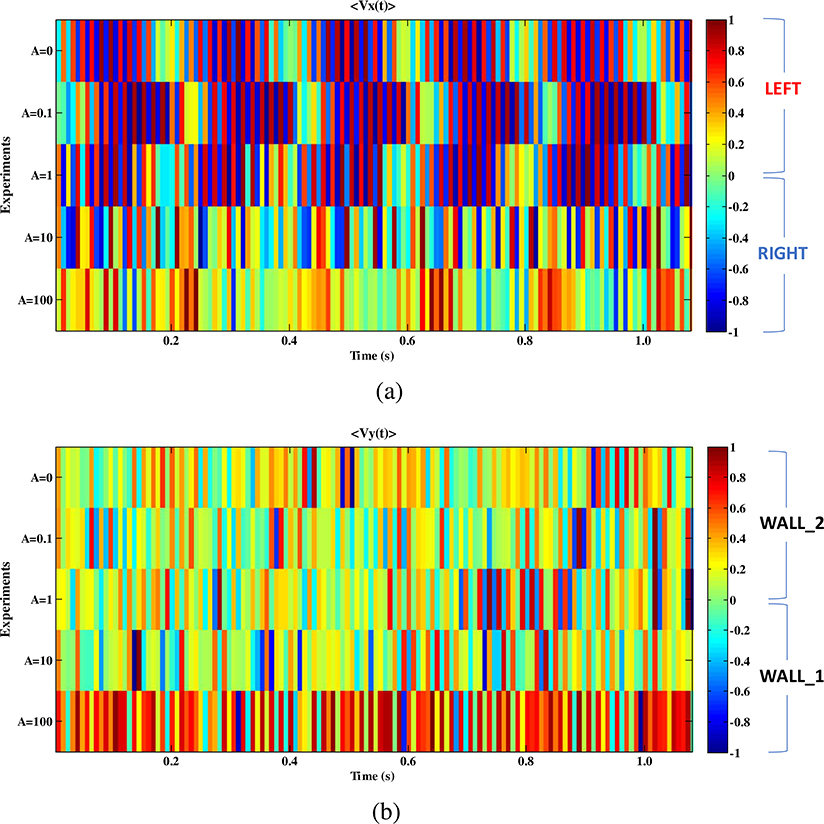
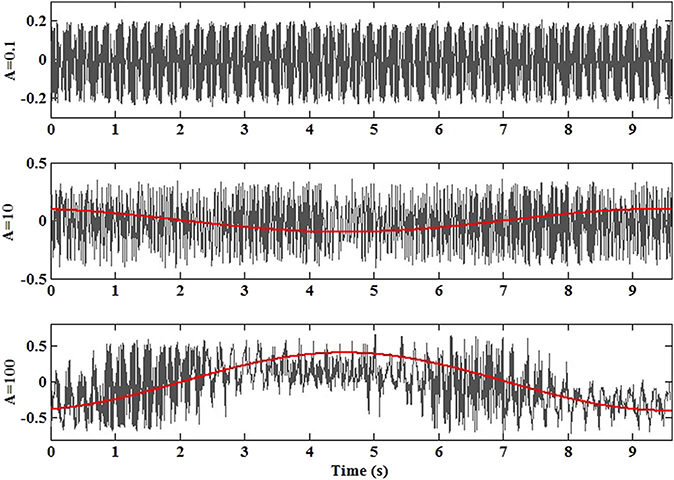
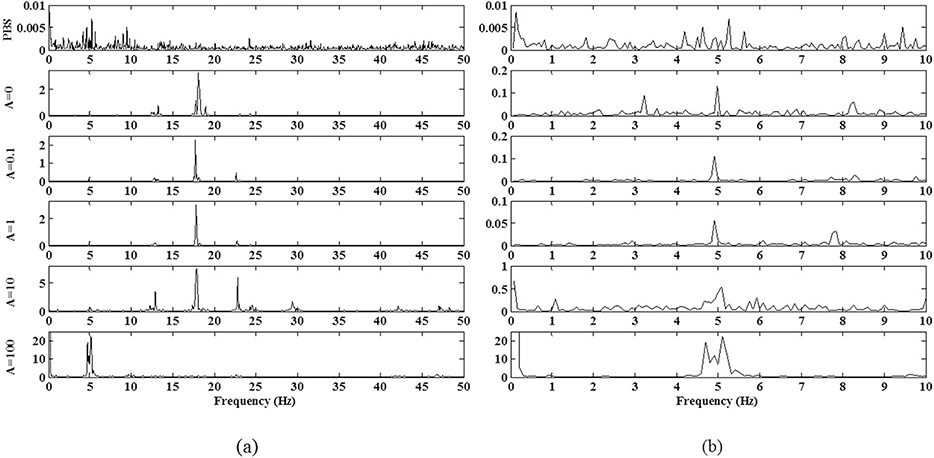
The key points in the design of microfluidic Lab-On-a-Chips for blood tests are the simplicity of the microfluidic chip geometry, the portability of the monitoring system and the ease on-chip integration of the data analysis procedure. The majority of those, recently designed, have been used for blood separation, however their introduction, also, for pathological conditions diagnosis would be important in different biomedical contexts. To overcome this lack is necessary to establish the relation between the RBCs flow and blood viscosity changes in micro-vessels. For that, the development of methods to analyze the dynamics of the RBCs flows in networks of micro-channels becomes essential in the study of RBCs flows in micro-vascular networks. A simplification in the experimental set-up and in the approach for the data collection and analysis could contribute significantly to understand the relation between the blood non-Newtonian properties and the emergent behaviors in collective RBCs flows. In this paper, we have investigated the collective behaviors of RBCs in a micro-channel in unsteady conditions, using a simplified monitoring set-up and implementing a 2D image processing procedure based on the digital particle image velocimetry. Our experimental study consisted in the analysis of RBCs motions freely in the micro-channel and driven by an external pressure. Despite the equipment minimal complexity, the advanced signal processing method implemented has allowed a significant qualitative and quantitative classification of the RBCs behaviors and the dynamical characterization of the particles velocities along both the horizontal and vertical directions. The concurrent causes for the particles displacement as the base solution-particles interaction, particle-particle interaction, and the external force due to pressure gradient were accounted in the results interpretation. The method implemented and the results obtained represent a proof of concept toward the realization of a general-purpose microfluidic LOC device for in-vitro flow analysis of RBCs collective behaviors.
Copyright © 2017 Elsevier Inc. All rights reserved.
Figures
Similar articles
-
Migration velocity of red blood cells in microchannels.Microvasc Res. 2019 Jul;124:30-36. doi: 10.1016/j.mvr.2019.02.003. Epub 2019 Mar 2. Microvasc Res. 2019. PMID: 30831125
-
Experimental estimation of blood flow velocity through simulation of intravital microscopic imaging in micro-vessels by different image processing methods.Microvasc Res. 2010 Dec;80(3):477-83. doi: 10.1016/j.mvr.2010.07.007. Epub 2010 Jul 24. Microvasc Res. 2010. PMID: 20659483
-
Characterization of nanoparticle delivery in microcirculation using a microfluidic device.Microvasc Res. 2014 Jul;94:17-27. doi: 10.1016/j.mvr.2014.04.008. Epub 2014 Apr 29. Microvasc Res. 2014. PMID: 24788074 Free PMC article.
-
Disturbed blood flow structuring as critical factor of hemorheological disorders in microcirculation.Clin Hemorheol Microcirc. 1998 Dec;19(4):315-25. Clin Hemorheol Microcirc. 1998. PMID: 9972669 Review.
-
Hemodynamics in the microcirculation and in microfluidics.Ann Biomed Eng. 2015 Jan;43(1):238-57. doi: 10.1007/s10439-014-1180-8. Epub 2014 Nov 15. Ann Biomed Eng. 2015. PMID: 25398331 Review.
Cited by
-
Biomechanical Assessment of Red Blood Cells in Pulsatile Blood Flows.Micromachines (Basel). 2023 Jan 26;14(2):317. doi: 10.3390/mi14020317. Micromachines (Basel). 2023. PMID: 36838017 Free PMC article.
-
A 3D-Printed Micro-Optofluidic Chamber for Fluid Characterization and Microparticle Velocity Detection.Micromachines (Basel). 2023 Nov 18;14(11):2115. doi: 10.3390/mi14112115. Micromachines (Basel). 2023. PMID: 38004972 Free PMC article.
-
Cell counting and velocity algorithms for hydrodynamic study of unsteady biological flows in micro-channels.Biomicrofluidics. 2023 Jan 23;17(1):014105. doi: 10.1063/5.0138587. eCollection 2023 Jan. Biomicrofluidics. 2023. PMID: 36714795 Free PMC article.
-
Micro-particle image velocimetry for blood flow in thick round glass micro-channels: Channel fabrication and velocity profile characterization.MethodsX. 2023 Mar 12;10:102110. doi: 10.1016/j.mex.2023.102110. eCollection 2023. MethodsX. 2023. PMID: 37007623 Free PMC article.
-
Real-Time Detection of Slug Velocity in Microchannels.Micromachines (Basel). 2020 Feb 26;11(3):241. doi: 10.3390/mi11030241. Micromachines (Basel). 2020. PMID: 32111020 Free PMC article.
References
-
- Baskurt O, et al., 1999. The effect of red blood cell aggregation on blood flow resistance. Biorheology 36, 447–452. - PubMed
-
- Bishop J, et al., 2001. Effect of erythrocyte aggregation on velocity profiles in venules. Am. J. Physiol. Heart Circ. Physiol. 280, H222–H236. - PubMed
-
- Bruus H, 2008. Theoretical Microfluidics. Oxford University Press, New York.
-
- Bucolo M, et al., 2002. Does chaos work better than noise. IEEE Circuits Syst. Mag. 2 (3), 4–19.
-
- Burton AL, et al., 1968. Brief report: quantitative studies on the flicker phenomenon in the erythrocytes. Blood 32, 5. - PubMed
MeSH terms
Grants and funding
LinkOut - more resources
Full Text Sources
Other Literature Sources
Miscellaneous
