Comparative Study
. 2017 Nov 3;292(44):18344-18353.
doi: 10.1074/jbc.M117.813444. Epub 2017 Sep 15.

Apolipoprotein L1 confers pH-switchable ion permeability to phospholipid vesicles

Affiliations
Comparative Study

Apolipoprotein L1 confers pH-switchable ion permeability to phospholipid vesicles

Jonathan Bruno et al. J Biol Chem. .

Abstract

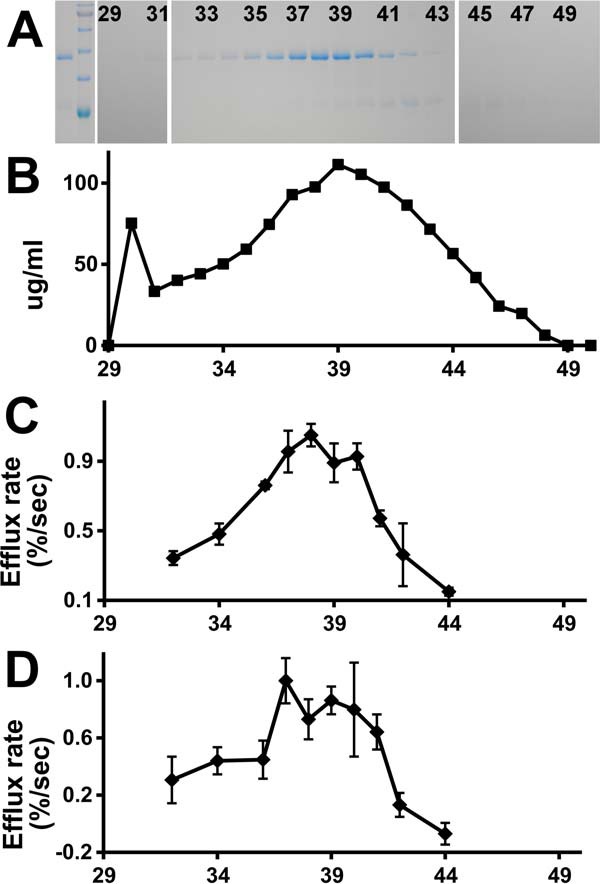
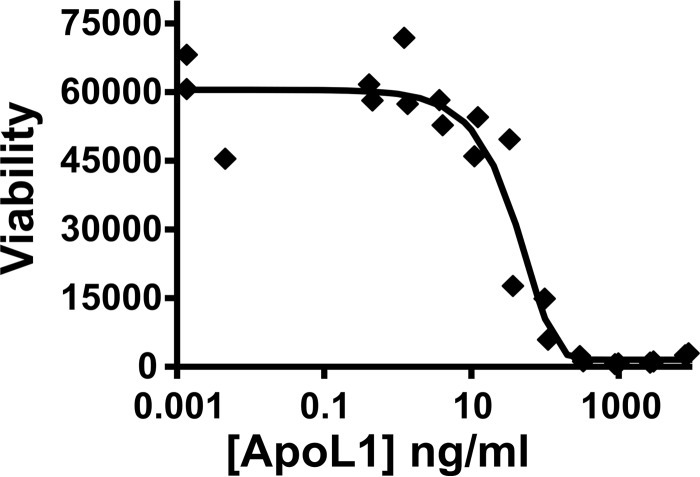
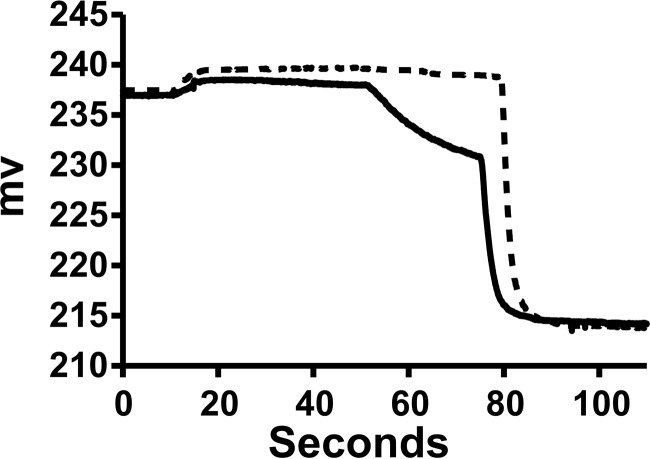
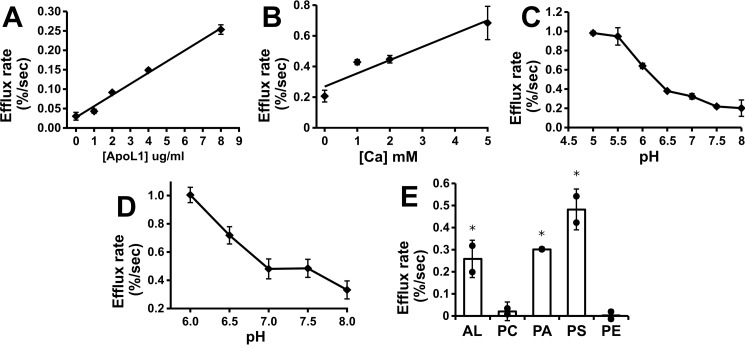
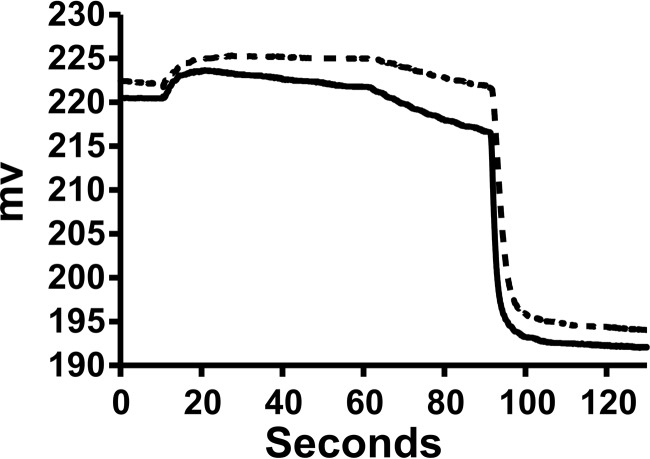
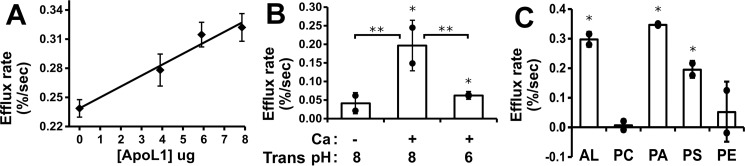
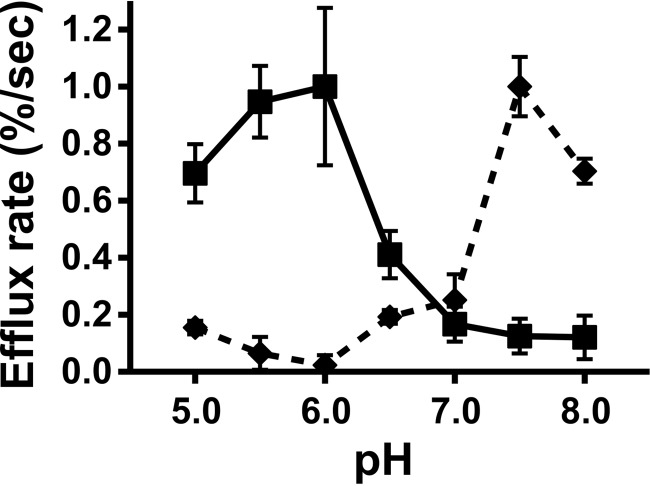
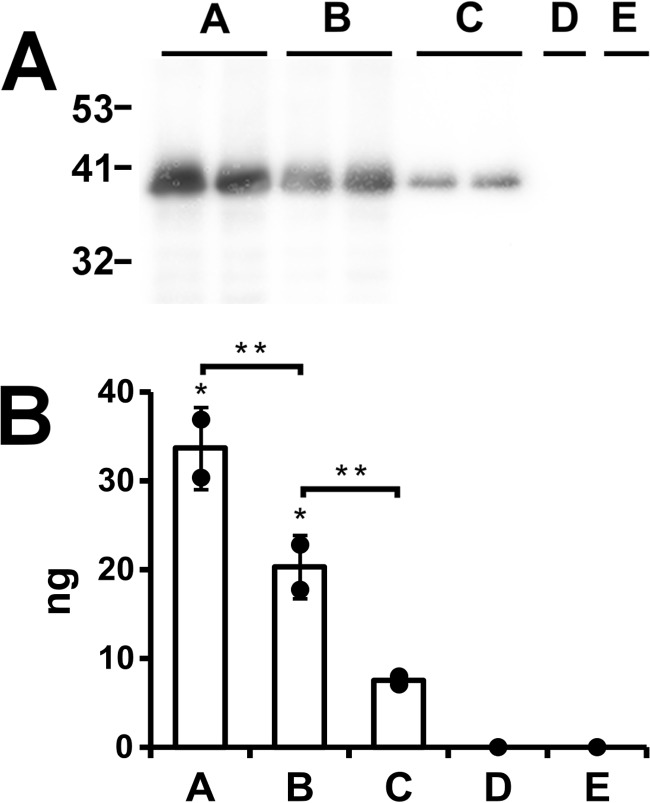
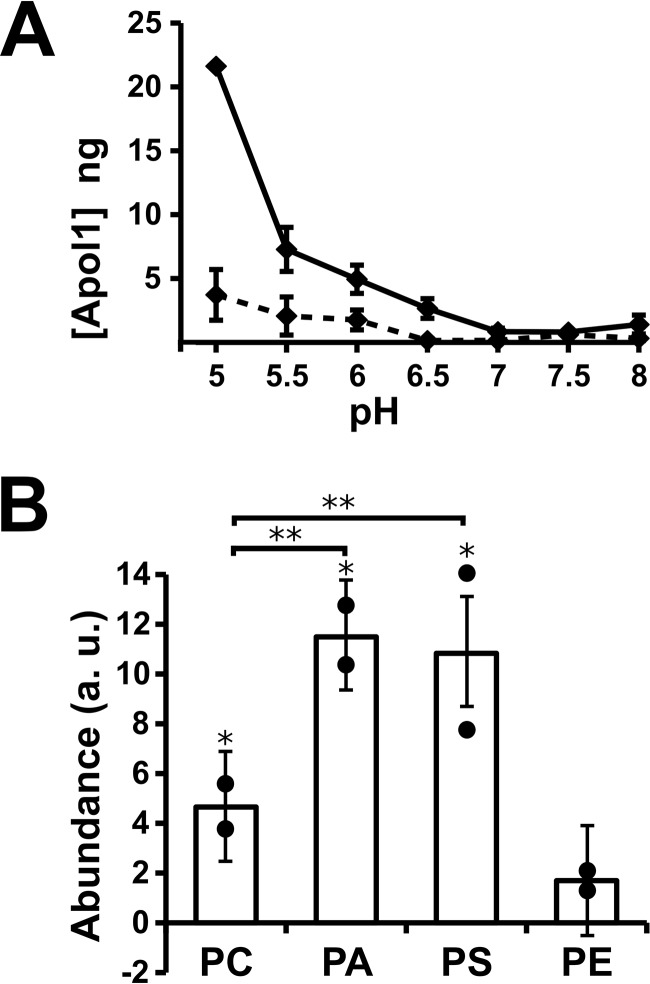
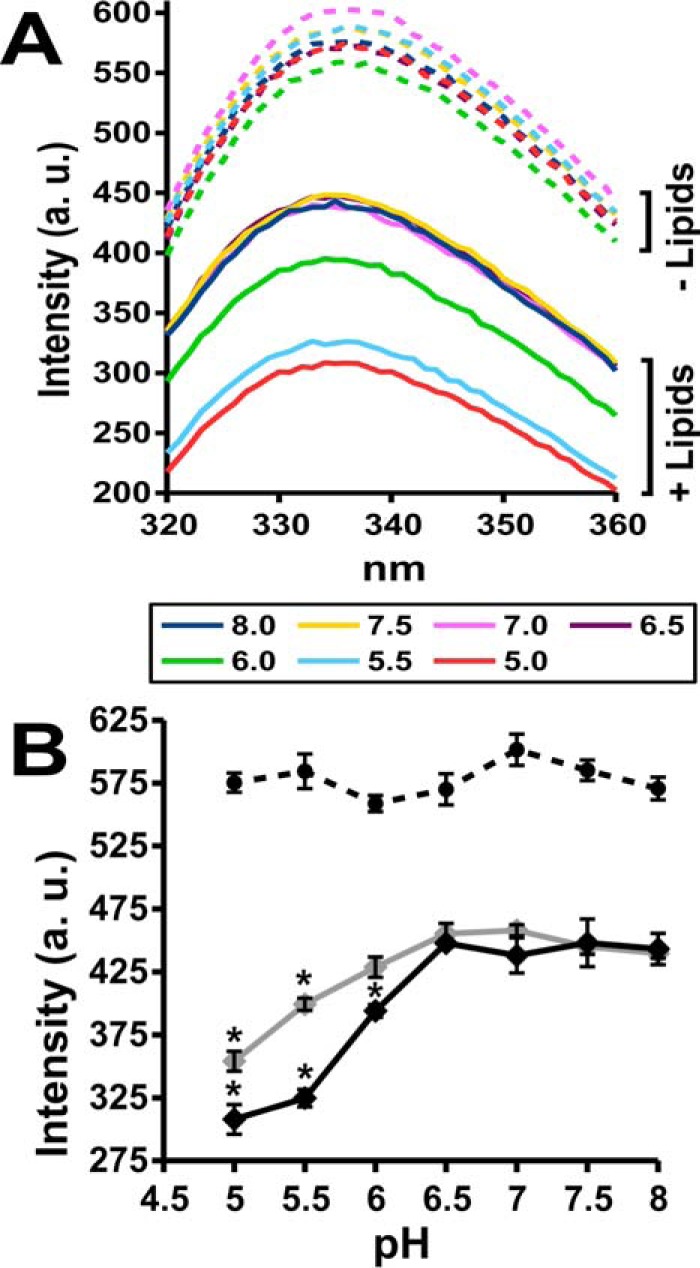
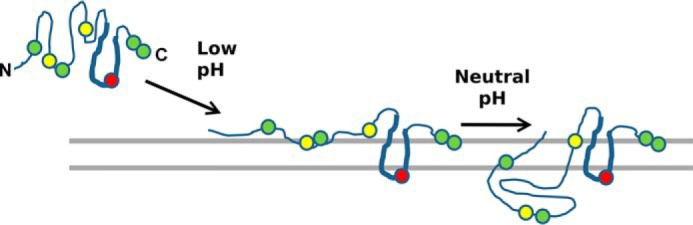
Apolipoprotein L1 (ApoL1) is a human serum protein conferring resistance to African trypanosomes, and certain ApoL1 variants increase susceptibility to some progressive kidney diseases. ApoL1 has been hypothesized to function like a pore-forming colicin and has been reported to have permeability effects on both intracellular and plasma membranes. Here, to gain insight into how ApoL1 may function in vivo, we used vesicle-based ion permeability, direct membrane association, and intrinsic fluorescence to study the activities of purified recombinant ApoL1. We found that ApoL1 confers chloride-selective permeability to preformed phospholipid vesicles and that this selectivity is strongly pH-sensitive, with maximal activity at pH 5 and little activity above pH 7. When ApoL1 and lipid were allowed to interact at low pH and were then brought to neutral pH, chloride permeability was suppressed, and potassium permeability was activated. Both chloride and potassium permeability linearly correlated with the mass of ApoL1 in the reaction mixture, and both exhibited lipid selectivity, requiring the presence of negatively charged lipids for activity. Potassium, but not chloride, permease activity required the presence of calcium ions in both the association and activation steps. Direct assessment of ApoL1-lipid associations confirmed that ApoL1 stably associates with phospholipid vesicles, requiring low pH and the presence of negatively charged phospholipids for maximal binding. Intrinsic fluorescence of ApoL1 supported the presence of a significant structural transition when ApoL1 is mixed with lipids at low pH. This pH-switchable ion-selective permeability may explain the different effects of ApoL1 reported in intracellular and plasma membrane environments.

Keywords: ApoL1; apolipoprotein L1; chloride channel; membrane transporter reconstitution; nephrology; phospholipid vesicle; potassium channel.


Conflict of interest statement

The authors declare that they have no conflicts of interest with the contents of this article. The content is solely the responsibility of the authors and does not necessarily represent the official views of the National Institutes of Health

Figures

Figure 1.
Figure 1.
Purification of recombinant His-tagged ApoL1. A, protein-stained gel of fractions from purification. Lane 1, peak fraction from nickel column elution. Lane 2, molecular mass standards (from the top: 100, 75, 63, 48, 35, and 28 kDa). Lanes 3–23, fractions 29 through 50 from the S200 column (every other lane is labeled with fraction number). ApoL1 peaks in fractions 38–39, running just below the 48-kDa marker. B, protein concentration of S200 fractions. C, chloride permease activity of S200 fractions 32–44. Each data point represents the mean, with error bars indicating S.E.; n = 2 for each. D, potassium permease activity of S200 fractions 32–44. Data are as in C; n = 3 for each data point.
Figure 2.
Figure 2.
Toxicity of purified recombinant ApoL1 to trypanosomes. The viability of T. brucei brucei grown in the presence of ApoL1 is plotted against the ApoL1 concentration on a log scale. The LC50 is 40 ng/ml.
Figure 3.
Figure 3.
Representative raw data from a chloride permease assays. Traces from the ApoL1 fraction (solid line) and control buffer (dotted line) are shown. Both the initial reaction mixture and the efflux step were at pH 5.0. The initial recording is of 10−5 m KCl, 2 mm Ca(gluconate)2, and 10 mm MES (pH 5.0) in 300 mm sucrose in the cup. The upward deflection at about 10 s reflects addition of the Bio-gel P-6DG eluate with the chloride-loaded vesicles that dilutes the chloride in the cup. Val is added at 60 s, initiating voltage-driven KCl efflux. Triton X-100 is added at 90 s, releasing all remaining intravesicular chloride. The minimal chloride release before addition of val in both tracings indicates that the vesicle potassium permeability is low with or without ApoL1. The difference in initial rates of release after addition of val is taken as the ApoL1-dependent chloride permeability.
Figure 4.
Figure 4.
Characterization of the ApoL1-dependent chloride permeability. A, ApoL1 concentration dependence. Efflux assays were performed with a range of ApoL1 concentrations in the initial reaction mix at pH 5.0. To eliminate the possibility of buffer or detergent effects, the total volume of S200 buffer solution added to the reaction was held constant. Data points represent the mean, and error bars represent S.E.; n = 2 for each data point. B, calcium dependence. Assays were carried out with 3.8 μg/ml of ApoL1 in the initial reaction mixture at a range of calcium ion concentrations and buffered at pH 6.0 in both stages of the assay. Data points represent mean efflux rates above no-ApoL1 controls, and error bars represent S.E.; n = 2 for each data point. C, pH dependence. Assays were performed with both stages of the assay held at the indicated pH in the presence of 2.5 mm calcium in the presence and absence of ApoL1. Data points represent the mean ApoL1-dependent efflux rates above control vesicles at each pH, and error bars represent S.E.; n = 2 for each data point. D, two-stage pH dependence assay. Vesicles and protein (or control buffer) were mixed at pH 6.0, passed through the spin column, and then assayed for val-dependent efflux at a range of pH values between 6 and 8. Data points and statistics are as in C. E, lipid dependence. Protein (8 μg/ml final) or control buffer was mixed at pH 5 with vesicles comprised of various combinations of purified lipids and assayed for val-dependent efflux in the absence of calcium. Data points represent individual ApoL1-dependent efflux rates above the control rate for each vesicle mixture. Columns represent the mean, error bars represent standard deviation; n = 2 for each data point. *, p < 0.05 compared with the no-protein control rate, determined with t testing. AL, asolectin.
Figure 5.
Figure 5.
Representative raw data from potassium permease assays. Traces from ApoL1 (solid line) and buffer control (dotted line) reactions are shown. The initial mixture of protein and vesicles was at pH 6, and the efflux was at pH 7.5. As in Fig. 2, the upward deflection at about 10 s reflects the addition of the Bio-gel P-6DG eluate with dilution of the chloride in the cup. CI1 is added at 60 s, initiating voltage-driven KCl efflux. Triton X-100 is added at 90 s, releasing all remaining intravesicular chloride. The noticeable chloride release before addition of CI1 in the ApoL1 sample but not the control indicates the presence of some ApoL1-dependent permeability to both potassium and chloride. The difference in initial rates of release after addition of CI1 is taken as the ApoL1-dependent potassium permeability.
Figure 6.
Figure 6.
Characterization of ApoL1-dependent potassium permeability. A, ApoL1 concentration dependence. Efflux assays were performed with a range of ApoL1 concentration in the initial reaction mix at pH 6, and then efflux was assayed at pH 7.5. To eliminate the possibility of buffer or detergent effects, the total volume of S200 buffer solution added to the reaction was held constant. Data points represent the mean, and error bars represent S.E.; n = 2 for each data point. B, calcium and trans pH dependence of activity. Assays were performed with and without ApoL1, with initial reaction at pH 6 and efflux at pH 7.5, in the absence or presence of 2 mm calcium using vesicles with the internal compartment buffered at 8 (left and center) or in the presence of 2 mm calcium using vesicles with the internal pH buffered at either 8 or 6 (center and right). C, lipid dependence of potassium permease activity. ApoL1 or control buffer was mixed at pH 6.0 with vesicles comprised of various combinations of purified lipids and assayed for CI1 dependent efflux at pH 7.5. Lipid mixtures are labeled as in Fig. 4E. B and C, individual data points show the ApoL1-dependent rate above the no-protein control rates for each condition. Columns represent the mean, and error bars represent standard deviation; n = 2 for each data point. *, p < 0.05 compared with the no-protein control rate; **, p < 0.05 for the pairwise comparisons indicated by brackets; significance was determined using ANOVA.
Figure 7.
Figure 7.
pH Dependence of potassium permease activity. ApoL1 or control buffer was mixed with vesicles at a range of pH values and then assayed for CI1-dependent efflux at pH 7.5 (square markers, solid line) or mixed at pH 6.0 and then assayed for CI1-dependent efflux at a range of pH values (diamond markers, dotted line). Each point represents the ApoL-1 dependent efflux rate above matched buffer controls; error bars represent S.E., n = 2 for each data point. Activity is greatest when protein and vesicle association occurs at pH 6.0 and efflux occurs at pH 7.5.
Figure 8.
Figure 8.
Stable association of ApoL1 with asolectin vesicles. A, 0.2 μg of ApoL1 was mixed with preformed vesicles at pH 5 (lanes A, B, D, and E) or at pH 8 (lane C). Vesicles were then extracted with 100 mm sodium carbonate (pH 11) to remove non-stably bound protein (lanes B–E) or not (lane A). Vesicles were separated from unbound protein by flotation through sucrose, and half of each sample was then separated by SDS-PAGE, blotted, and probed. Digital images were collected and quantitated using ApoL1 standard separated on the same gel. Lanes A–C were performed with independent duplicates. Lanes D and E are negative controls from which either the protein (lane D) or the lipid (lane E) was omitted. Migration positions of molecular mass standards in kilodaltons are marked. B, quantification of the signals shown in A. At pH 8, approximately one-third of the ApoL1 in the reaction bound to the vesicles (lane A). A fraction of the membrane-associated protein was extracted with a carbonate wash, leaving behind about 20% of the total protein in the reaction stably associated with the membranes (lane B). In contrast, only 7.5% of the total protein stably associates with the vesicles when association is carried out at pH 8.0 (lane C). No signal is detected when either protein or lipid is omitted from the reaction. Individual data points are shown. Columns represent the mean, and error bars represent standard deviation; n = 2 for lanes A–C. *, p < 0.05 (signals significantly different from zero); **, p < 0.05 for the pairwise comparisons indicated by brackets; significance was determined by ANOVA.
Figure 9.
Figure 9.
pH and lipid dependence of ApoL1-vesicle association. A, the ApoL1 vesicle association assay was performed at a range of pH values in the presence (solid line) or absence (dashed line) of 5 mm CaCl2. Data points represent the mean, and error bars represent S.E., n = 2 for each data point. B, vesicle association using purified lipid mixtures. Individual data points are shown. Columns represent the mean, and error bars represent standard deviation; n = 2 for each condition. *, p < 0.05 compared with zero; **, p < 0.05 for the pairwise comparisons indicated by brackets; significance was determined by ANOVA.
Figure 10.
Figure 10.
ApoL1 intrinsic fluorescence changes with membrane association. A, average fluorescence intensity (a.u., arbitrary units) emission spectra (λex = 280) for ApoL1 in the absence or presence of lipid vesicles at a range of pH values. Each tracing is the average of three identical samples. The pH of each tracing is indicated by color. B, fluorescence intensity of ApoL1 at λem = 335 through a range of pH values in the presence (solid line) or absence (dashed line) of vesicles. Fluorescence in the presence of lipids was determined in the presence (black line) or absence (gray line) of 5 mm CaCl2. Data points represent the mean value, and error bars represent S.E.; n = 3 for each data point. *, p < 0.05 compared with intensity at pH 6.5 within each data set determined by ANOVA.
Figure 11.
Figure 11.
Working model for membrane insertion of the ApoL1 pore-forming domain. Only the putative pore-forming domain (amino acids 90–235) is shown. At neutral pH, ApoL1 is folded in a soluble conformation (left). With titration of the cis compartment to acidic pH, the hairpin loop formed by helices 8 and 9 (indicated by the thickened line segment) inserts into and spans the membrane, exposing glutamic acid 209 (red circle) to the trans aqueous environment, where it could be titrated, and forcing tryptophans at positions 234 and 235 and/or 94 and/or 139 (green circles) to interact with the lipid polar headgroups on the cis side of the membrane (center). This form confers chloride permeability, perhaps via membrane disruption at the protein–lipid interface. Titration of the cis compartment back to neutral pH, possibly with histidines at positions 130 and 169 serving as the pH sensor, drives the further conformational change and translocation leading to potassium permeability (right) (structures per , , with modifications).

References

    1. Genovese G., Friedman D. J., Ross M. D., Lecordier L., Uzureau P., Freedman B. I., Bowden D. W., Langefeld C. D., Oleksyk T. K., Uscinski Knob A. L., Bernhardy A. J., Hicks P. J., Nelson G. W., Vanhollebeke B., Winkler C. A., et al. (2010) Association of trypanolytic ApoL1 variants with kidney disease in African Americans. Science 329, 841–845 - PMC - PubMed
    1. Parsa A., Kao W. H., Xie D., Astor B. C., Li M., Hsu C. Y., Feldman H. I., Parekh R. S., Kusek J. W., Greene T. H., Fink J. C., Anderson A. H., Choi M. J., Wright J. T. Jr., Lash J. P., et al. (2013) APOL1 risk variants, race, and progression of chronic kidney disease. N. Engl. J. Med. 369, 2183–2196 - PMC - PubMed
    1. Pays E., and Vanhollebeke B. (2008) Mutual self-defence: the trypanolytic factor story. Microbes Infect. 10, 985–989 - PubMed
    1. Vanhamme L., Paturiaux-Hanocq F., Poelvoorde P., Nolan D. P., Lins L., Van Den Abbeele J., Pays A., Tebabi P., Van Xong H., Jacquet A., Moguilevsky N., Dieu M., Kane J. P., De Baetselier P., Brasseur R., and Pays E. (2003) Apolipoprotein L-I is the trypanosome lytic factor of human serum. Nature 422, 83–87 - PubMed
    1. Pérez-Morga D., Vanhollebeke B., Paturiaux-Hanocq F., Nolan D. P., Lins L., Homblé F., Vanhamme L., Tebabi P., Pays A., Poelvoorde P., Jacquet A., Brasseur R., and Pays E. (2005) Apolipoprotein L-I promotes trypanosome lysis by forming pores in lysosomal membranes. Science 309, 469–472 - PubMed

Publication types

MeSH terms