. 2017 Oct 5;68(1):130-143.e5.
doi: 10.1016/j.molcel.2017.08.016. Epub 2017 Sep 14.

SAGA Is a General Cofactor for RNA Polymerase II Transcription

Affiliations

SAGA Is a General Cofactor for RNA Polymerase II Transcription

Tiago Baptista et al. Mol Cell. .

Erratum in

Abstract

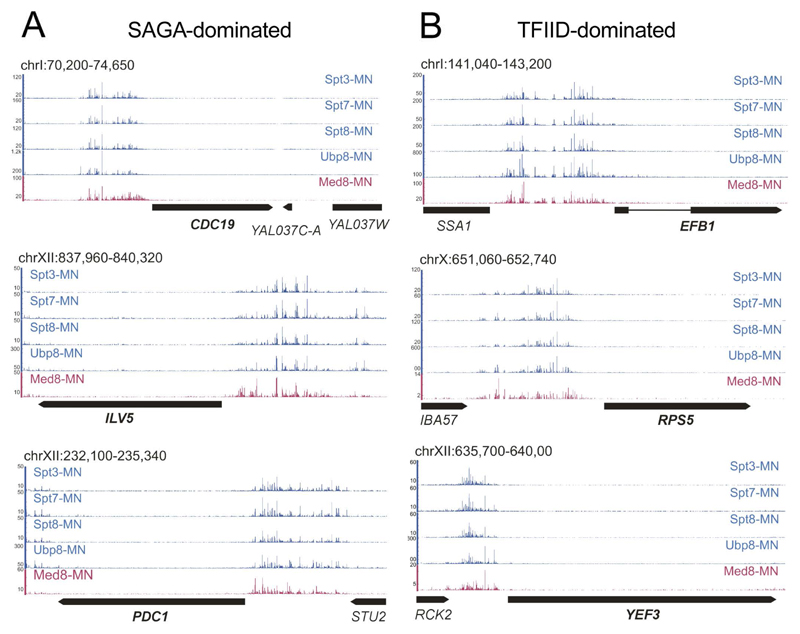
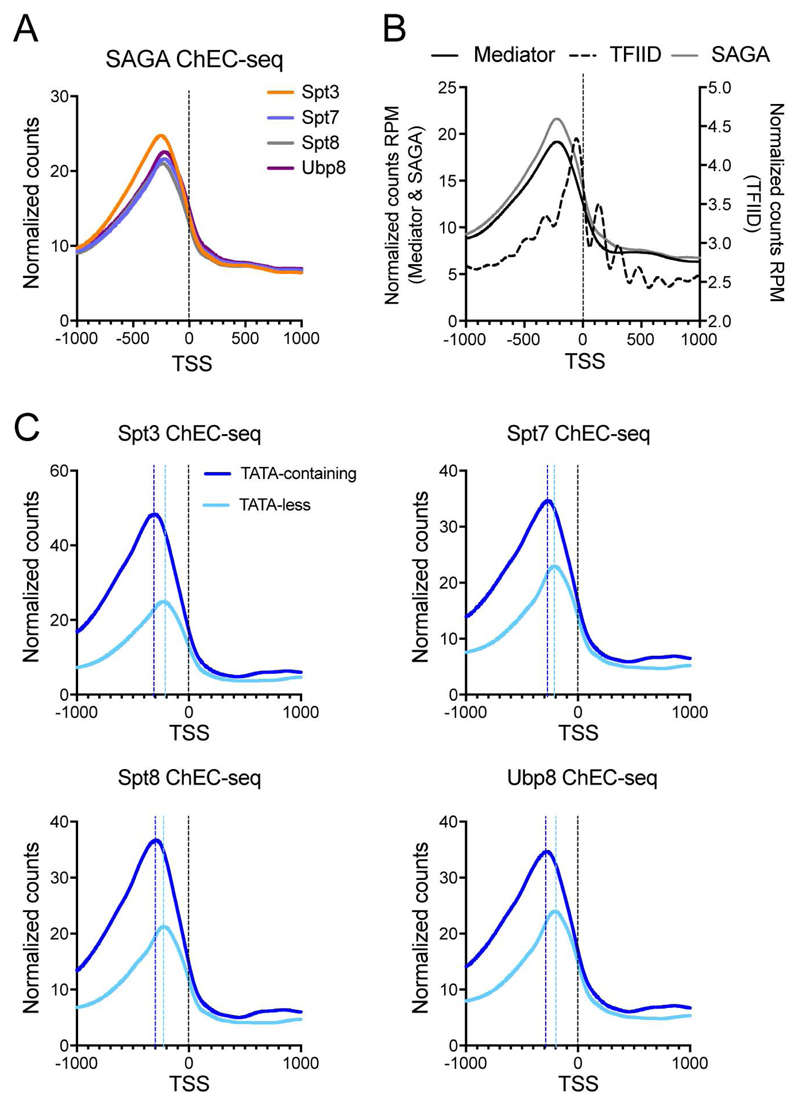
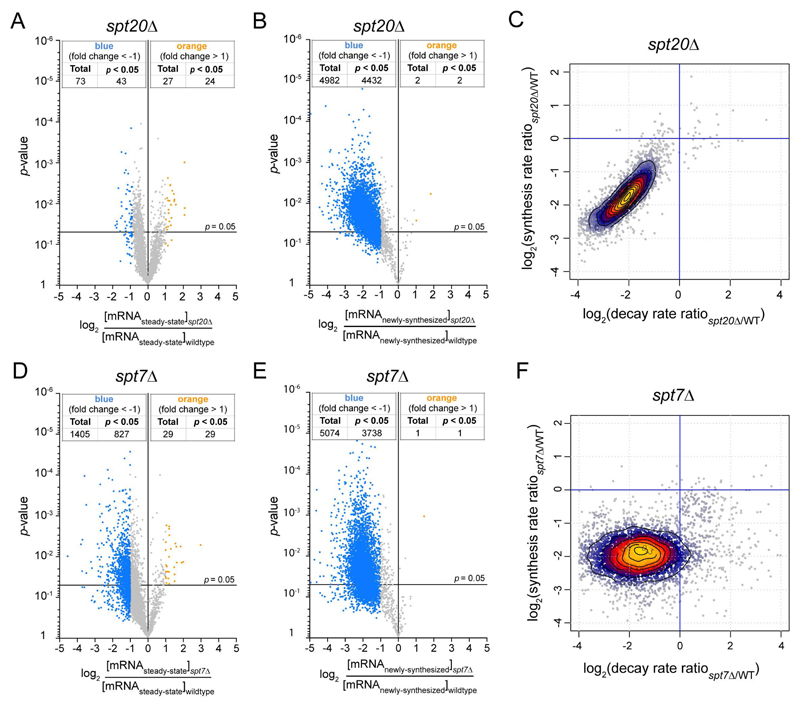
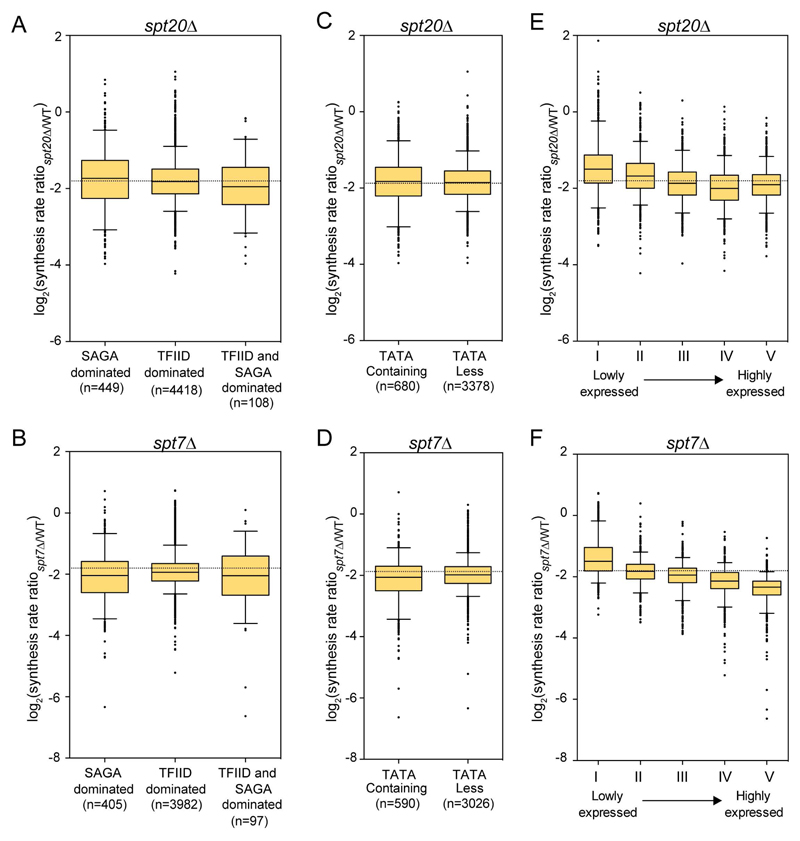
Prior studies suggested that SAGA and TFIID are alternative factors that promote RNA polymerase II transcription, with about 10% of genes in S. cerevisiae dependent on SAGA. We reassessed the role of SAGA by mapping its genome-wide location and role in global transcription in budding yeast. We find that SAGA maps to the UAS elements of most genes, overlapping with Mediator binding and irrespective of previous designations of SAGA- or TFIID-dominated genes. Disruption of SAGA through mutation or rapid subunit depletion reduces transcription from nearly all genes, measured by newly synthesized RNA. We also find that the acetyltransferase Gcn5 synergizes with Spt3 to promote global transcription and that Spt3 functions to stimulate TBP recruitment at all tested genes. Our data demonstrate that SAGA acts as a general cofactor required for essentially all RNA polymerase II transcription and is not consistent with the previous classification of SAGA- and TFIID-dominated genes.

Keywords: RNA polymerase II; SAGA complex; TATA box; TFIID complex; coactivator; transcription initiation.


Figures

Figure 1
Figure 1. ChEC-seq profiling of SAGA specific subunits.
Signal tracks showing cleavages induced by Spt3-MNase, Spt7-MNase, Spt8-MNase and Ubp8-MNase at (A) three representative SAGA-dominated genes (CDC19, ILV5 and PDC1) and (B) three TFID-dominated genes (EFB1, RPS5 and YEF3). Med8-MNase cleavage sites are shown as a reference for the coactivator Mediator binding at UASs (Grunberg et al., 2016). See also Figure S1.
Figure 2
Figure 2. SAGA associates with UASs of SAGA- and TFIID-dominated genes.
(A) Plots of average SAGA subunit cleavages relative to the TSSs of all annotated Pol II genes. (B) Plots of average SAGA (Spt3-MNase, grey line), Mediator (Med8-MNase, black line), and TFIID (Taf1-MNase, dotted line) cleavage at the TSSs of all genes transcribed by Pol II. (C) Plots of average cleavage of the single subunits at TATA-containing (dark blue line) or TATA-less (light blue line) gene promoters. The dotted lines represent the peak summit to TSS distance at TATA-containing (dark blue) or TATA-less (light blue) genes. See also Figure S1.
Figure 3
Figure 3. Compensation of an overall decrease of Pol II transcription by a global change in mRNA decay in SPT20 and SPT7 deletion strains.
Volcano plots showing fold changes in steady-state mRNA levels (A,D) or newly-synthesized mRNA levels (B,E) relative to their significance (p value). Fold changes (FC) were calculated as the Log2 of the ratio of the expression value of each gene after normalization to S. pombe signal in the spt20Δ strain (A,B) or the spt7Δ (D,E) strain versus the expression value of the same gene in wild-type S. cerevisiae. 5385 genes were analyzed and thresholds of 2-fold change (blue dots: more than 2-fold decrease; yellow dots: more than 2-fold increase) and 0.05 p values were considered. cDTA profiles for spt20Δ (C) and spt7Δ (F) strains. For all analyzed genes, changes in synthesis rates were plotted against the changes in mRNA decay rates. Changes were calculated as the Log2 of the ratio between mutant and wild-type. 90% of genes are contained within the outer contour. Yellow and red dots correspond to 60% of genes. For each strain, results were obtained from at least two independent biological replicates. See also Figure S2.
Figure 4
Figure 4. Changes in mRNA synthesis rates for different classes of genes in spt20Δ and spt7Δ.
Box plots showing the distribution of changes in mRNA synthesis rates between spt20Δ (A,C,E) or spt7Δ (B,D,F) and wild-type strains. Very similar changes were seen whether genes were described as SAGA- or TFIID-dominated (A,B) or whether their promoter were TATA-containing or TATA-less (C,D). Genes were divided in quintiles according to their expression levels in wild-type cells and the changes in synthesis rates were plotted for each quintile (E,F). Boxes contain genes between the 25th and the 75th centiles, the line indicates to the median and the whiskers correspond to 5th and 95th centiles.
Figure 5
Figure 5. Conditional nuclear depletion of Spt7 decreased transcription of both SAGA- and TFIID-dominated genes.
(A) Spt7 anchor away strain, untreated or treated with rapamycin for 60 min, were labeled with 4tU. mRNA levels from 6 SAGA- , 6 TFIID-dominated genes and RNA levels from four control genes transcribed by Pol I and Pol III were quantified by RT-qPCR. Expression values (mean ± SD of three independent experiments) were normalized to spiked-in S. pombe signal and set to 1 in the untreated sample. (B-D) Time course analysis of changes in steady-state and newly-synthesized RNA for a SAGA-dominated (B), a TFIID-dominated (C) and a control gene transcribed by Pol III (D) upon Spt7 nuclear depletion. See also Figures S3 and S4.
Figure 6
Figure 6. cDTA analyses of different SAGA subunit deletion strains.
Synthesis rates and decay rates were determined for each S. cerevisiae gene in gcn5Δ (A), spt3Δ (B), ubp8Δgcn5Δ (C) and spt3Δgcn5Δ (D). Changes (calculated as the Log2 of the ratio between mutant and wild-type) in synthesis rates were plotted against changes in decay rates. (E) Box plots summarizing the extent of changes in mRNA synthesis for all the analyzed deletion strains. For each strain, cDTA data were obtained from at least two independent biological replicates. (F) Whole cell extracts from wild-type and the indicated deletion strains were revealed with the antibodies corresponding to histones marks regulated by SAGA (H3K9ac, H2Bub) or associated with active transcription (H3K4me3, H3K36me3) or with antibodies specific to the C-terminal domain of Rpb1 phosphorylated on serine 5 (pSer5 RNA Pol II) or on serine 3 (pSer5 RNA Pol II), as indicated. See also Figure S5, S6 and S7.
Figure 7
Figure 7. Reduced TBP occupancy at promoters of both SAGA- and TFIID-dominated genes in SPT3 deletion strain.
(A,B) Volcano plots showing changes in steady-state (A) and newly-synthesized mRNA levels between spt3Δ and wild type S. cerevisiae. (C,D) Box plots representing the distribution of changes in synthesis rates upon SPT3 deletion for SAGA- versus TFIID-dominated genes (C) and for TATA-containing versus TATA-less genes (D). (E) TBP enrichment at promoters from 5 SAGA- and 6 TFIID-dominated genes as well as at three control regions was determined by HA ChIP in a spt3Δ 3HA-TBP strain and the parental 3HA-TBP strain and quantified by real time PCR. The values (mean ± SD of three independent ChIP experiments) are expressed as percentage of input DNA signal.

Similar articles

Cited by

References

    1. Ansari SA, He Q, Morse RH. Mediator complex association with constitutively transcribed genes in yeast. Proc Natl Acad Sci U S A. 2009;106:16734–16739. - PMC - PubMed
    1. Bahler J, Wu JQ, Longtine MS, Shah NG, McKenzie A, 3rd, Steever AB, Wach A, Philippsen P, Pringle JR. Heterologous modules for efficient and versatile PCR-based gene targeting in Schizosaccharomyces pombe. Yeast. 1998;14:943–951. - PubMed
    1. Basehoar AD, Zanton SJ, Pugh BF. Identification and distinct regulation of yeast TATA box-containing genes. Cell. 2004;116:699–709. - PubMed
    1. Bhaumik SR, Green MR. SAGA is an essential in vivo target of the yeast acidic activator Gal4p. Genes Dev. 2001;15:1935–1945. - PMC - PubMed
    1. Bhaumik SR, Green MR. Differential requirement of SAGA components for recruitment of TATA-box-binding protein to promoters in vivo. Mol Cell Biol. 2002;22:7365–7371. - PMC - PubMed

MeSH terms