. 2018 Jan;154(1):195-210.
doi: 10.1053/j.gastro.2017.09.007. Epub 2017 Sep 15.

Analysis of Genomes and Transcriptomes of Hepatocellular Carcinomas Identifies Mutations and Gene Expression Changes in the Transforming Growth Factor-β Pathway

Affiliations

Analysis of Genomes and Transcriptomes of Hepatocellular Carcinomas Identifies Mutations and Gene Expression Changes in the Transforming Growth Factor-β Pathway

Jian Chen et al. Gastroenterology. 2018 Jan.

Abstract

Background & aims: Development of hepatocellular carcinoma (HCC) is associated with alterations in the transforming growth factor-beta (TGF-β) signaling pathway, which regulates liver inflammation and can have tumor suppressor or promoter activities. Little is known about the roles of specific members of this pathway at specific of HCC development. We took an integrated approach to identify and validate the effects of changes in this pathway in HCC and identify therapeutic targets.

Methods: We performed transcriptome analyses for a total of 488 HCCs that include data from The Cancer Genome Atlas. We also screened 301 HCCs reported in the Catalogue of Somatic Mutations in Cancer and 202 from Cancer Genome Atlas for mutations in genome sequences. We expressed mutant forms of spectrin beta, non-erythrocytic 1 (SPTBN1) in HepG2, SNU398, and SNU475 cells and measured phosphorylation, nuclear translocation, and transcriptional activity of SMAD family member 3 (SMAD3).

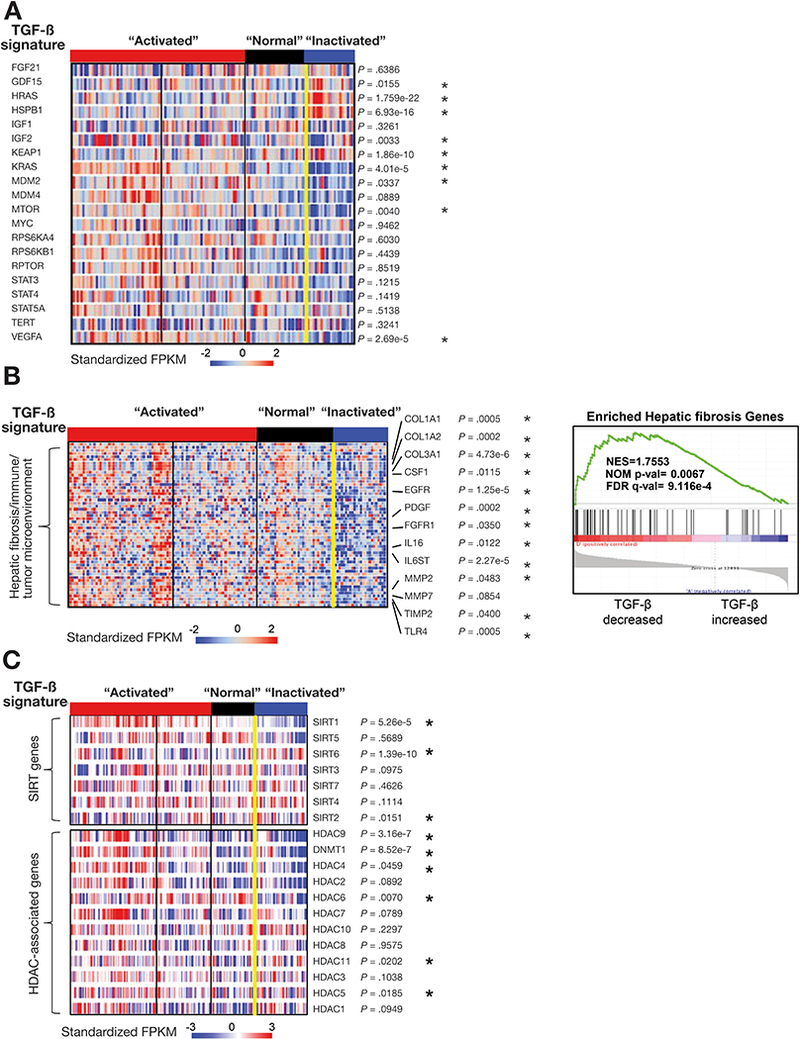
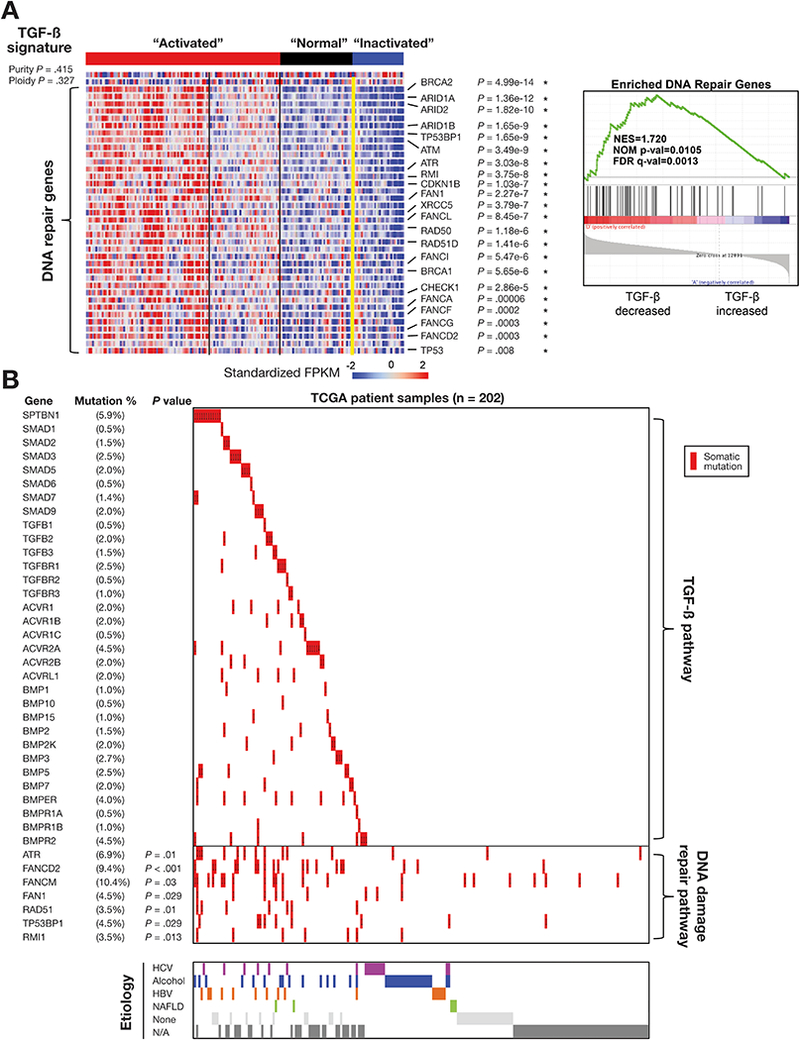
Results: We found somatic mutations in at least 1 gene whose product is a member of TGF-β signaling pathway in 38% of HCC samples. SPTBN1 was mutated in the largest proportion of samples (12 of 202, 6%). Unsupervised clustering of transcriptome data identified a group of HCCs with activation of the TGF-β signaling pathway (increased transcription of genes in the pathway) and a group of HCCs with inactivation of TGF-β signaling (reduced expression of genes in this pathway). Patients with tumors with inactivation of TGF-β signaling had shorter survival times than patients with tumors with activation of TGF-β signaling (P = .0129). Patterns of TGF-β signaling correlated with activation of the DNA damage response and sirtuin signaling pathways. HepG2, SNU398, and SNU475 cells that expressed the D1089Y mutant or with knockdown of SPTBN1 had increased sensitivity to DNA crosslinking agents and reduced survival compared with cells that expressed normal SPTBN1 (controls).

Conclusions: In genome and transcriptome analyses of HCC samples, we found mutations in genes in the TGF-β signaling pathway in almost 40% of samples. These correlated with changes in expression of genes in the pathways; up-regulation of genes in this pathway would contribute to inflammation and fibrosis, whereas down-regulation would indicate loss of TGF-β tumor suppressor activity. Our findings indicate that therapeutic agents for HCCs can be effective, based on genetic features of the TGF-β pathway; agents that block TGF-β should be used only in patients with specific types of HCCs.

Keywords: COSMIC; Gene Regulation; Genetics; Immune Response; Liver Cancer.


Conflict of interest statement

Conflicts of interest

None

Figures

Figure 1.
Figure 1.
Disruption of TGF-β signaling and major signal transduction pathways in HCCs. (A) Clustering of transcriptomic data from 147 HCC samples from TCGA reveals 4 clusters. Clusters A and B demonstrate upregulation of TGF-β pathway genes (activated) to varying extents, whereas cluster D shows downregulations of the pathway genes (inactivated) and cluster C exhibit least disruption of the TGF-β pathway. The percentage of patients in which a gene is elevated or suppressed is given, showing the high frequency with which the TGF-β pathway is disrupted. (B) Box plot showing the TGF-β pathway activity scores for each sample in the four clusters and for normal liver samples. The plot shows that clusters “A”, “B” and “C” have varying extents of activation of the pathway compared to normal, whereas cluster “D” has inactivation of the pathway with a lower than normal score. (C) Kaplan-Meier survival curves for the four clusters indicates the “inactivated” cluster leads to a poor outcome. (D) Assembling the 2 clusters A and B into one group (the “activated” cluster) and comparing against the “inactivated” group (the inactivated cluster D) shows statistically significant survival differences (HR = 2.586, P= 0.0129).
Figure 2.
Figure 2.
Disruption of the TGF-β pathway is associated with other signaling pathways in HCC. (A) Disruption of the TGF-β pathway is associated with potentially targetable genes. (B) TGF-β pathway is associated with hepatic fibrosis/immune/tumor microenvironment-associated genes and DNA repair genes. We applied GSEA to compare enriched expression of hepatic fibrosis/immune/tumor microenvironment-associated genes (53 genes) with TGF-β signatures (right panels). (C) Disruption of the TGF-β pathway is associated with sirtuin and HDAC family genes. “*” represents genes with p values that are significantly altered in the TGF-β inactivated signature versus other clusters, based on t-tests with Banjamini-Hochberg (BH) corrections for multiple hypotheses testing.
Figure 3.
Figure 3.
Association of somatic mutations of TGF-β genes with DNA damage repair genes. (A) Disruption of the TGF-β pathway is associated with DNA repair pathway genes. We applied GSEA to compare enriched expression of DNA repair genes (41 genes) with signatures (right panels). (B) Landscape of somatic mutations and HCC etiologic factors in the TGF-β pathway genes in 202 TCGA HCC samples. The percentages of samples with mutations in a given gene are shown. Purity and ploidy do not show a statistically significant association with the clusters (p value is based on t-tests without BH corrections).
Figure 4.
Figure 4.
Identification of a novel and potential cancer driver mutation of SPTBN1 in HCC. (A) Circos plots of HCC sample 9194-N/T. Circos plot was drawn using the data generated from the paired (normal-tumor) samples. The chromosomes are presented in circular arrangement demarcated by megabase (Mb), scale on the outer ring are in a clockwise direction. The different tracks (from outside to inside): Gene symbols for impacted genes; density plot of somatic variants (blue); the called levels for the copy number variation (CNV) (grey); the lesser allele fraction (LAF) used to determine the CNV (light green); loss of heterozygosity (green dots); density of heterozygous SNPs (orange); density of homozygous SNPs (blue); inter-chromosomal translocation (orange). (B) Identification of a novel somatic mutation of SPTBN1 (c.G3219T; p.D1089Y) in an alcohol- and HCV-associated HCC. (C) All 4 HCC samples demonstrate somatic mutations in TGF-β pathway genes including a mutation in SPTBN1 gene. (D) Plot of all the mutations observed in SPTBN1 gene from TCGA, COSMIC and one of our own samples. Most of the mutations, including D1089Y, occur in the spectrin repeat domain. (E) The aberrations of DNA copy numbers of four of the HCCs. (F) Representative amplified genes and loss of heterozygosity genes in case 9194-N/T, 9128-N/T, 9195-N/T and 9401-N/T. (G-H) Electrostatic based colored molecular surface of the D1089Y mutant (G) and wt (H) of the spectrin repeat 8. Molecular surfaces are color-coded based on the electrostatic potential (red: negative, blue: positive and white: neutral).
Figure 5.
Figure 5.
Disruption of TGF-ß/ SMAD3 signaling in HCC by somatic mutation D1089Y of SPTBN1. (A) TGF-β induced co-localization of SPTBN1 and SMAD3 in the HepG2 cell nucleus. HepG2 cells were treated with or without 200pM TGF-β for 2 hours. Immunofluorescent labeling detects endogenous SPTBN1 and SMAD3. Scale bars, 20 μm. (B-C) SMAD3 interacts with ectopic full-length SPTBN1 (B) and central domain of SPTBN1(C). HepG2 cells were co-transfected with the indicated plasmids. Cell lysates were immunoprecipitated with an anti-Flag antibody and immunoblotted with an anti-V5 antibody. Schematic diagram shows the point mutation D1089Y in SPTBN1(C). (D) Overexpression of wt SPTBN1, but not SPTBN1-D1089Y mutant, rescued TGF-ß-induced SMAD3 nuclear translocation in SNU398 cells. The cells were transfected with Myc-SPTBN1-Mid-wt or Myc-SPTBN1-Mid-D1089Y for 24 hours, then treated with TGF-β for 2 hours. Scale bars, 20 μm. (E) Wt SPTBN1, but not the SPTBN1-D1089Y mutant, activated SMAD3 transcriptional activity in a TGF-β-dependent manner. A luciferase reporter containing SBE (4×SBE) was transfected with indicated plasmids into SNU398 cells (*P < 0.01, one-way ANOVA). (F) SPTBN1 bearing D1089Y mutation does not bind to SMAD3 in HepG2 cells co-transfected with indicated plasmids. (G) The SPTBN1-D1089Y mutation decreased the phosphorylation of SMAD3 upon TGF-β treatment in HepG2. (H) Proposed model of the critical role of SPTBN1 for SMAD3 activity responding to TGF-β.
Figure 6.
Figure 6.
Somatic mutation D1089Y leads to loss of SPTBN1 tumor suppressor function. (A) Overexpression of wt SPTBN1, but not mutant SPTBN1-D1089Y, in SNU398 cells conferred resistance to MMC (left panel) or to Cisplatin (middle panel). Anti-HA antibody was used for the Western blot to check the expression of infected SPTBN1 (right panel). (B) HepG2-shRNA-SPTBN1 cells with SPTBN1 knockdown are significantly more sensitive to MMC (left panel), Cisplatin (middle panel) or IR-induced toxicity (right panel) than HepG2-shRNA-Ctrl cells. (C) Hep3B (left panel), SNU475 (middle panel), or SNU398 (right panel) cells with SPTBN1 knockdown by shRNA are significantly more sensitive to MMC than shRNA-Ctrl cells, representatively. Data presented as “mean ± SD” in A-C were obtained from three independent experiments performed in triplicate (* P < 0.05, one-way ANOVA). (D) Impaired DNA damage response (DDR) in the absence of SPTBN1. Phospho-Chk2 foci (pChk2) were analyzed at different time points in primary MEF cells after exposure to 10 Gy IR. IR induced significantly more pChk2 foci in Sptbnl+/+ cells than Sptbn1+/+ cells. Data presented as “mean ± SD” from 3 independent experiments analyzed by student t-test (*P < 0.01). (E) Overexpression of wt SPTBN1, but not mutant SPTBN1-D1089Y, in SNU398 cells led to altered DDR and decreased p-Chk2 levels. Total Chk2 was used for density normalization. (F) Overexpression of wt SPTBN1but not SPTBN1-D1089Y mutant inhibits colony formation capability of SNU475 cells in soft-agar assay.

Comment in

References

    1. White DL, Thrift AP, Kanwal F, et al. Incidence of Hepatocellular Carcinoma in All 50 United States, From 2000 Through 2012. Gastroenterology 2017;152:812–820 e5. - PMC - PubMed
    1. GLOBOCAN 2012: Liver cancer: Estimated Cancer Incidence, Mortality and Prevalence Worldwide in 2012. International Agency for Research on Cancer: World Health Organization. 2017. (Accessed on Jun 11, 2017 at http://globocan.iarc.fr/old/FactSheets/cancers/liver-new.asp).
    1. Bruix J, Reig M, Sherman M. Evidence-Based Diagnosis, Staging, and Treatment of Patients With Hepatocellular Carcinoma. Gastroenterology 2016;150:835–53. - PubMed
    1. Majumdar A, Curley SA, Wu X, et al. Hepatic stem cells and transforming growth factor beta in hepatocellular carcinoma. Nat Rev Gastroenterol Hepatol 2012;9:530–8. - PMC - PubMed
    1. Totoki Y, Tatsuno K, Covington KR, et al. Trans-ancestry mutational landscape of hepatocellular carcinoma genomes. Nat Genet 2014;46:1267–73. - PubMed

Publication types

Substances