Review
. 2018 Jan 1:368:57-69.
doi: 10.1016/j.neuroscience.2017.09.003. Epub 2017 Sep 14.

Neocortical dynamics during whisker-based sensory discrimination in head-restrained mice

Affiliations
Review

Neocortical dynamics during whisker-based sensory discrimination in head-restrained mice

Fritjof Helmchen et al. Neuroscience. .

Abstract

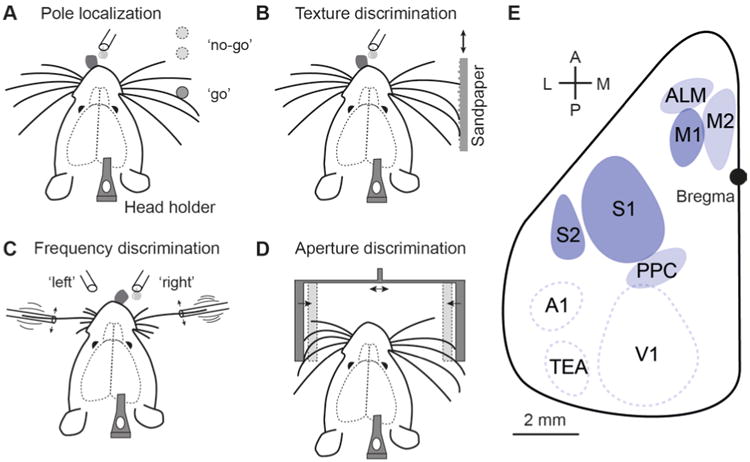
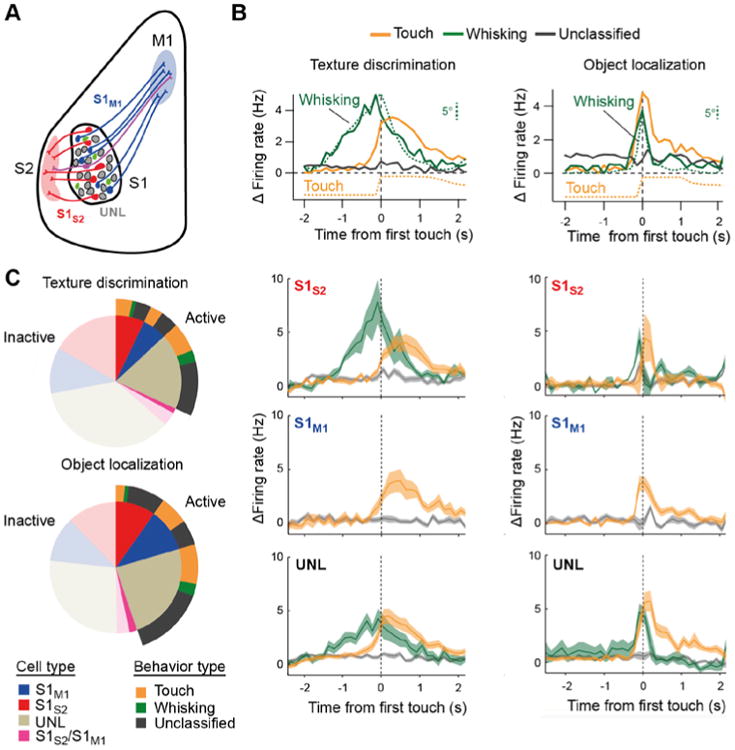
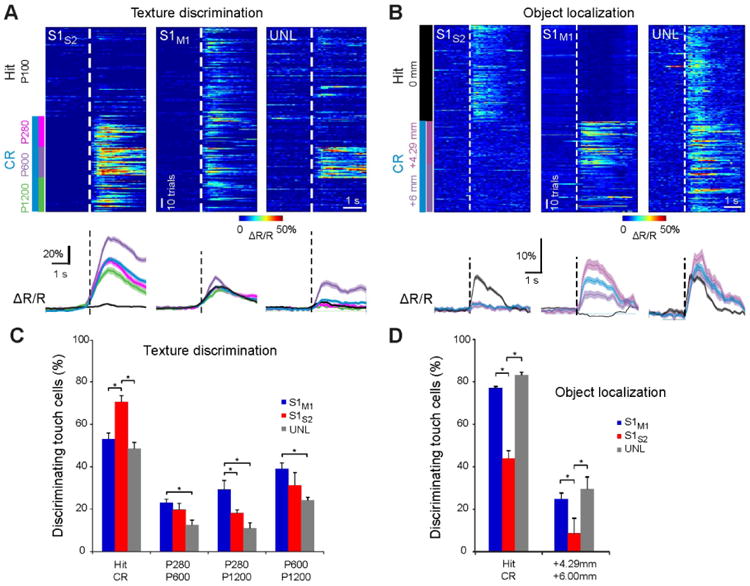
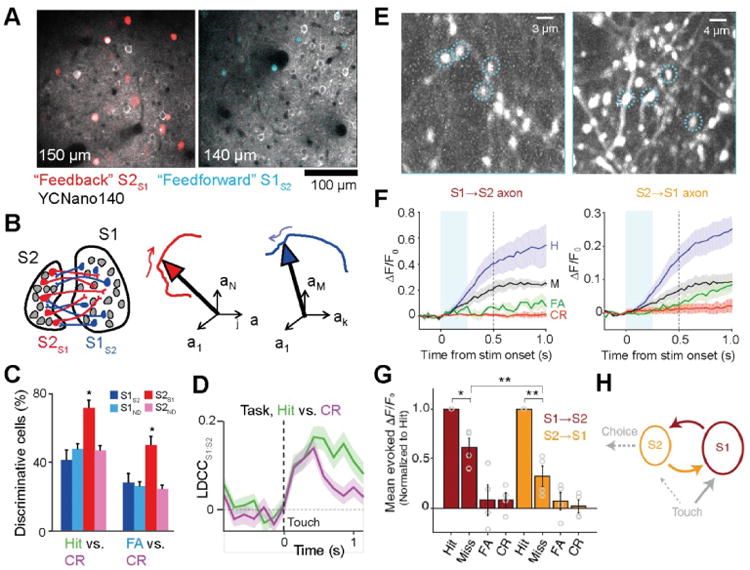
A fundamental task frequently encountered by brains is to rapidly and reliably discriminate between sensory stimuli of the same modality, be it distinct auditory sounds, odors, visual patterns, or tactile textures. A key mammalian brain structure involved in discrimination behavior is the neocortex. Sensory processing not only involves the respective primary sensory area, which is crucial for perceptual detection, but additionally relies on cortico-cortical communication among several regions including higher-order sensory areas as well as frontal cortical areas. It remains elusive how these regions exchange information to process neural representations of distinct stimuli to bring about a decision and initiate appropriate behavioral responses. Likewise, it is poorly understood how these neural computations are conjured during task learning. In this review, we discuss recent studies investigating cortical dynamics during discrimination behaviors that utilize head-fixed behavioral tasks in combination with in vivo electrophysiology, two-photon calcium imaging, and cell-type-specific targeting. We particularly focus on information flow in distinct cortico-cortical pathways when mice use their whiskers to discriminate between different objects or different locations. Within the primary and secondary somatosensory cortices (S1 and S2, respectively) as well as vibrissae motor cortex (M1), intermingled functional representations of touch, whisking, and licking were found, which partially re-organized during discrimination learning. These findings provide first glimpses of cortico-cortical communication but emphasize that for understanding the complete process of discrimination it will be crucial to elucidate the details of how neural processing is coordinated across brain-wide neuronal networks including the S1-S2-M1 triangle and cortical areas beyond.

Keywords: calcium imaging; discrimination; mouse; neocortex; somatosensory.


Figures

Figure 1
Figure 1
Different types of whisker-based tactile discrimination tasks that have been established in head-restrained rodents. (A) Object localization. The animal needs to judge the position of a vertical pole. (B) Texture discrimination. The roughness of sandpaper presented to the whiskers has to be evaluated. (C) Bilateral frequency discrimination task. The animal has to compare the two stimulation frequencies on both sides. (D) Aperture discrimination. The width and centrality of the aperture have to be evaluated. (E) Schematic top view on the left hemisphere of mouse neocortex indicating several key areas for whisker-based discrimination behavior. S1: primary somatosensory cortex (barrel field), S2: secondary somatosensory cortex, M1: primary motor cortex, M2: secondary motor cortex, ALM: anterior lateral motor area, PPC: posterior parietal cortex; also indicated are A1: primary auditory cortex, V1: primary visual cortex, and TEa: temporal association area.
Figure 2
Figure 2
Classification of neuronal responses in S1. (A) Schematic illustration of the retrograde labeling strategies for anatomical segregation of specific projection pathways, here the S2-projecting (S1S2, red) and M1-projecting (S1M1, blue) pathways, respectively. UNL denote ‘unlabeled’ neurons with unspecified projection targets. Green neurons indicate additional local interneurons. Two-photon calcium imaging was performed on L2/3 neurons that expressed YC-Nano140 as sensitive calcium indicator. For each neuron instantaneous firing rate changes were obtained by deconvolution of the YC-Nano140 calcium signals. (B) Top: Relative change in mean firing rate over the trial period aligned to first touch (dashed line) for neurons functionally classified into ‘Whisking’, ‘Touch’, and ‘Unclassified’ neurons (average across all neurons in each class). In addition, whisking is shown as the mean envelope of whisking amplitude, which was calculated as the difference between maximum and minimum whisker angles along a sliding window equal to the imaging frame duration (142 ms). The touch variable indicates the likelihood of the principal whisker to be in contact with the texture, obtained by averaging binary touch vectors across trials. Whisking and touch analyses were performed through visual inspection of high-speed videos. Note the correspondence between the time course of whisking amplitude and firing rate change in whisking neurons and between touch onset and the activation of touch neurons. Lower panels: Same data subdivided into the three anatomically defined subpopulations of S1S2, S1M1, and UNL neurons, respectively. Traces represent averages across all neurons for each class (shaded area, s.e.m.). Panels in the left column refer to texture discrimination behavior, panels in the right column to object localization. (C) Distribution of imaged active neurons according to cell type and behaviour classification for texture discrimination (top) and object localization (bottom) behavior. For completeness ‘inactive’ neurons not showing significant activity during the behavior sessions are also depicted (transparent areas). All panels adapted from (Chen et al., 2013a).
Figure 3
Figure 3
Single-neuron discrimination analysis of decision or sensory-stimulus features in S1. (A) Top: Single-trial responses of individual S1S2, S1M1, or UNL example neurons according to Hit/CR trial-type or sandpaper type in the texture discrimination task. Traces are aligned to first touch (dashed line). Color codes for ΔR/R amplitude. All these neurons were classified as touch neurons. Bottom: Average ΔR/R calcium traces of neurons shown on top according to Hit/CR or sandpaper type (shaded regions, s.e.m.). (B) Equivalent plot to (A) but for individual example neurons during the object localization task. (C) Analysis of discrimination power across the touch-neuron population during texture discrimination. Bars indicate the fraction of touch cells discriminating decision or non-target stimuli as determined by ROC analysis across subtypes (* P < 0.05, permutation test; error bars, s.d. from permutation test). (D) Equivalent plot to (C) but for touch neurons in the object localization task. All panels adapted from (Chen et al., 2013a).
Figure 4
Figure 4
Neuronal communication between S1 and S2. (A) Simultaneous calcium imaging from S1 and S2 during texture discrimination behavior. In addition to general labeling of excitatory neurons with YCNano140, S1S2 neurons (red, left) and S2S1 neurons (blue, right) were specifically labeled using retrograde infecting viral vectors. (B) For analysis of neuronal population dynamics the trajectories of state-space vectors were analyzed (using low-dimensional representations by linear discriminant [LD] analysis). (C) Fraction of active neurons discriminating Hit/CR and FA/CR trials above chance determined by single-cell ROC analysis (error bars: s.d. from bootstrap test; P < 0.05, χ2-test; n = 44 S1S2, 161 S1ND, 59 S2S1, 198 S2ND neurons). (D) The correlation of the LD projection of state-space trajectories in S1:S2 (LDCC) increased following touch events and remained high for prolonged time when the animal started licking (Hit trials). (A-D) adapted from (Chen et al., 2016). (E) In mice performing a tactile detection task axon imaging experiments were performed by injecting AAV-GCaMP6 in one region and imaging superficial axons in the target region. Left, example field-of-view showing labeled S1→S2 axons. Right, example field-of-view showing labeled S2→S1 axons. (F) ΔF/F0 activity (mean ± s.e.m.) of S1→S2 axons (left) and S2→S1 axons (right) for each trial type (averaged across 4 mice each). In both axon types, responses on Hits were larger than on Misses (P < 0.002). Cyan shading indicates first 0.25 s after stimulus onset. (G) Mean evoked ΔF/F0 responses normalized to hits across individual axons (mean ± s.e.m. across mice; circles show individual mice). For both S1→S2 and S2→S1 axons, responses on misses were smaller than on hits. (H) Schematic of feedforward and feedback propagation of task-related activity (dashed: hypothetical functional pathways). (E-H) adapted from (Kwon et al., 2016).
Figure 5
Figure 5
Functional changes in neocortical dynamics during learning. (A) Time course of lick rate (left) and whisking amplitude (right) aligned to first touch within go trials across different training periods (solid line, mean; shaded area, s.e.m.). In ‘Pre’ and ‘Post’ control sessions textures were presented but without reward or punishment. (B) Longitudinal observation of example S1M1 and S1S2 neurons across training phases. Across-trial average calcium transients per session, aligned to first touch (red line), are shown. For each session, two-photon images of the neurons are shown on top with the behavior classification per session indicated by the outline box. Neurons were classified as non-active if their calcium responses were not significantly different from the neuropil signal. (C) Distribution of classified neurons across sessions for S1M1 and S1S2 neurons pooled for all animals. (D) Fraction of trials discriminating relative to naive phase during training across cell types. (A-D) adapted from (Chen et al., 2015). (E) 3D distribution of response types in S1 for the object localization task in one mouse. Blue, touch neurons; green, whisking neurons; cyan, mixed; gray, unclassified; gray dashed line, outline of principal column. Radius indicates Rfit. (F) Example neurons imaged during learning of the object localization task (before volume imaging). Left, touch cell; right, whisking cell. (G) Fraction of L2/3 excitatory neurons classified as touch or whisking during learning. Mean touch, blue; mean whisking, green; gray lines, individual animals (n = 4). (H) Neurometric and psychometric performance over the course of learning. Orange line, task performance of the best ten neuron ensemble; gray lines, individual animals' (n = 4) best ensemble performance; black, cross-animal psychometric performance (the first day of training consisted of a simplified form of the task where the performance metric did not apply and was thus excluded). (E-H) adapted from (Peron et al., 2015).

Similar articles

Cited by

References

    1. Ahrens MB, Li JM, Orger MB, Robson DN, Schier AF, Engert F, Portugues R. Brain-wide neuronal dynamics during motor adaptation in zebrafish. Nature. 2012;485:471–U480. - PMC - PubMed
    1. Arabzadeh E, Zorzin E, Diamond ME. Neuronal encoding of texture in the whisker sensory pathway. PLoS Biol. 2005;3:e17. - PMC - PubMed
    1. Aronoff R, Matyas F, Mateo C, Ciron C, Schneider B, Petersen CC. Long-range connectivity of mouse primary somatosensory barrel cortex. Eur J Neurosci. 2010;31:2221–2233. - PubMed
    1. Bastos AM, Vezoli J, Bosman CA, Schoffelen JM, Oostenveld R, Dowdall JR, De Weerd P, Kennedy H, Fries P. Visual areas exert feedforward and feedback influences through distinct frequency channels. Neuron. 2015;85:390–401. - PubMed
    1. Bethge P, Carta S, Lorenzo DA, Egolf L, Goniotaki D, Madisen L, Voigt FF, Chen JL, Schneider B, Ohkura M, et al. An R-CaMP1.07 reporter mouse for cell-type-specific expression of a sensitive red fluorescent calcium indicator. PLoS One. 2017;12:e0179460. - PMC - PubMed

LinkOut - more resources