

Global, regional, and national comparative risk assessment of 84 behavioural, environmental and occupational, and metabolic risks or clusters of risks, 1990-2016: a systematic analysis for the Global Burden of Disease Study 2016
- PMID: 28919119
- PMCID: PMC5614451
- DOI: 10.1016/S0140-6736(17)32366-8
Global, regional, and national comparative risk assessment of 84 behavioural, environmental and occupational, and metabolic risks or clusters of risks, 1990-2016: a systematic analysis for the Global Burden of Disease Study 2016
Erratum in
-
Department of Error.Lancet. 2017 Oct 14;390(10104):1736. doi: 10.1016/S0140-6736(17)32485-6. Epub 2017 Sep 18. Lancet. 2017. PMID: 28935160 Free PMC article. No abstract available.
-
Department of Error.Lancet. 2017 Oct 28;390(10106):e38. doi: 10.1016/S0140-6736(17)32649-1. Epub 2017 Oct 13. Lancet. 2017. PMID: 29032996 Free PMC article. No abstract available.
Abstract
Background: The Global Burden of Diseases, Injuries, and Risk Factors Study 2016 (GBD 2016) provides a comprehensive assessment of risk factor exposure and attributable burden of disease. By providing estimates over a long time series, this study can monitor risk exposure trends critical to health surveillance and inform policy debates on the importance of addressing risks in context.
Methods: We used the comparative risk assessment framework developed for previous iterations of GBD to estimate levels and trends in exposure, attributable deaths, and attributable disability-adjusted life-years (DALYs), by age group, sex, year, and location for 84 behavioural, environmental and occupational, and metabolic risks or clusters of risks from 1990 to 2016. This study included 481 risk-outcome pairs that met the GBD study criteria for convincing or probable evidence of causation. We extracted relative risk (RR) and exposure estimates from 22 717 randomised controlled trials, cohorts, pooled cohorts, household surveys, census data, satellite data, and other sources, according to the GBD 2016 source counting methods. Using the counterfactual scenario of theoretical minimum risk exposure level (TMREL), we estimated the portion of deaths and DALYs that could be attributed to a given risk. Finally, we explored four drivers of trends in attributable burden: population growth, population ageing, trends in risk exposure, and all other factors combined.
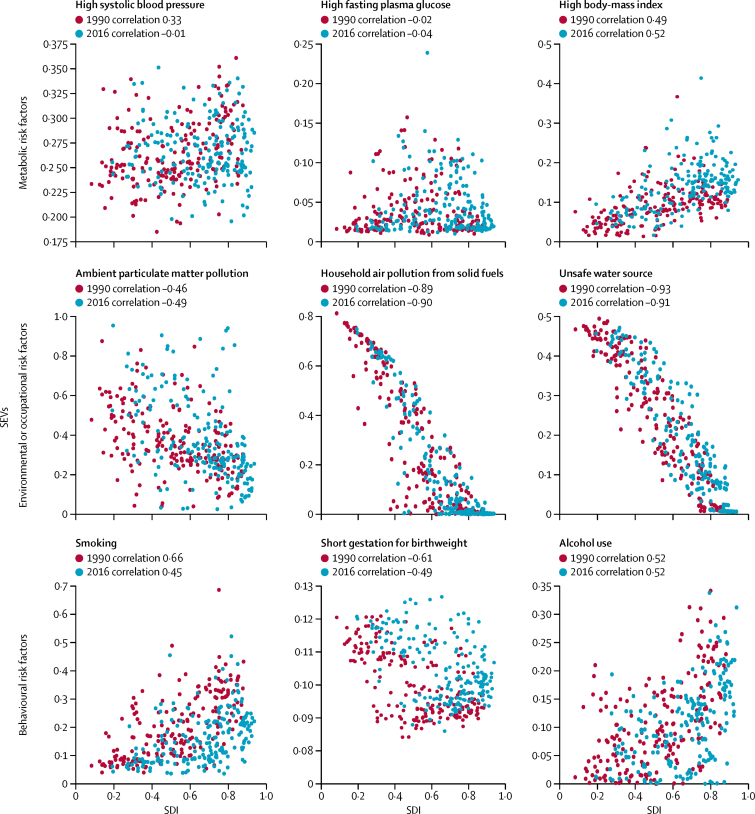
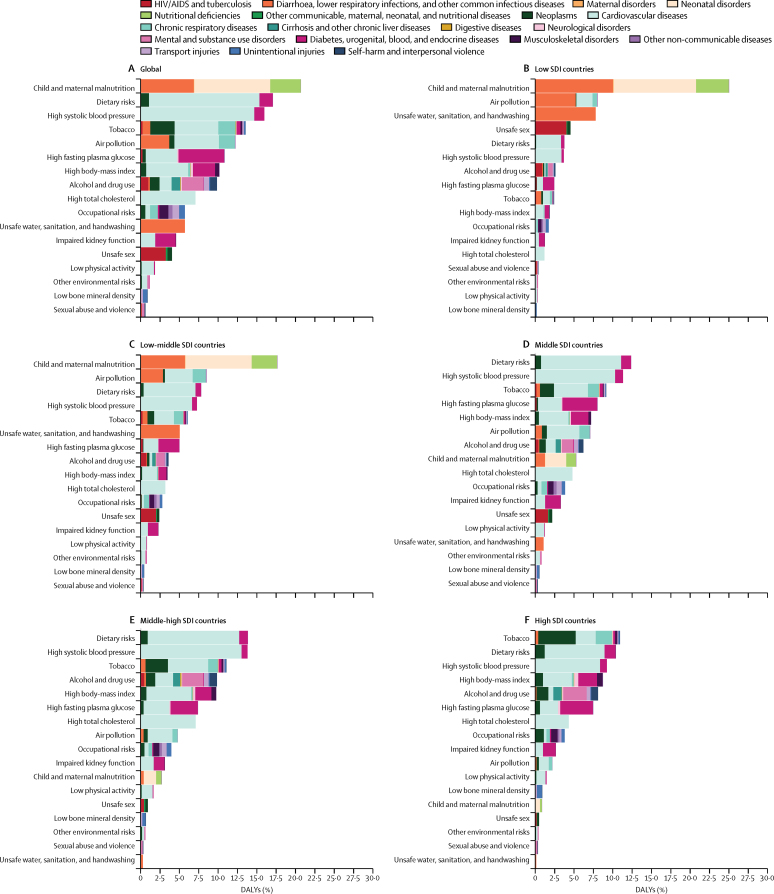
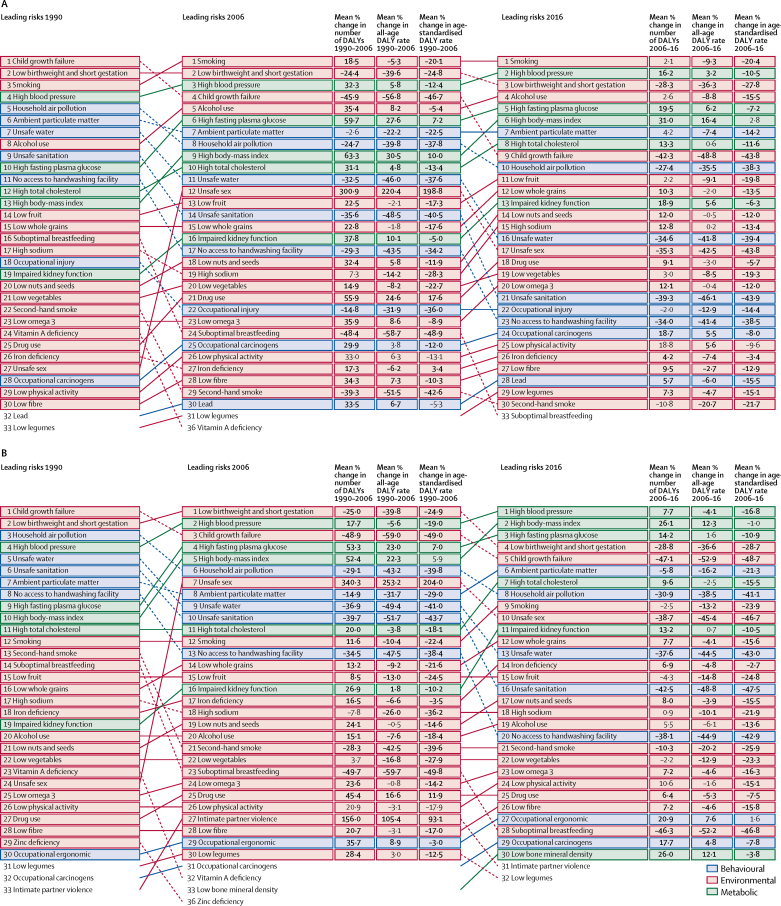
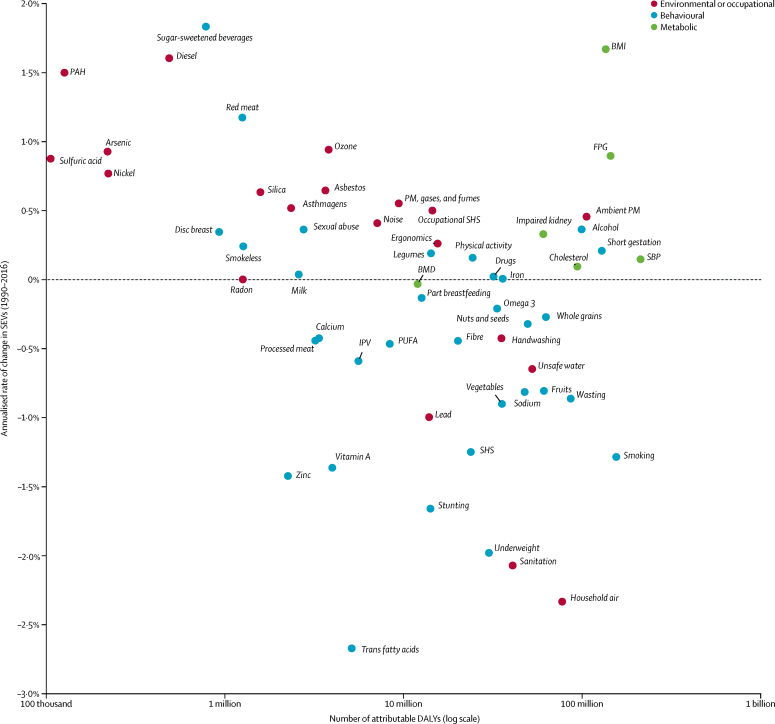
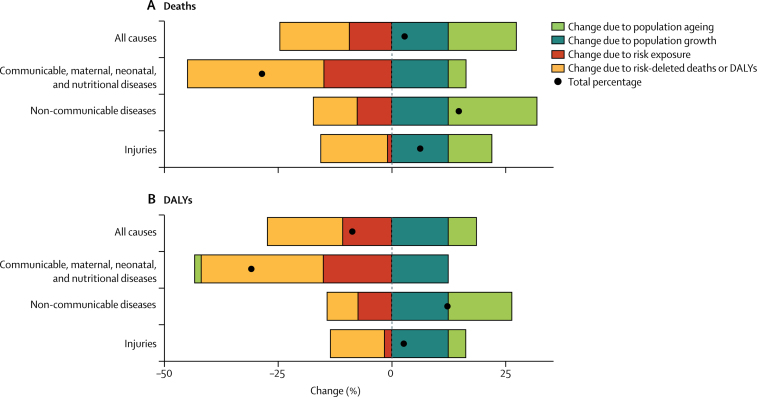
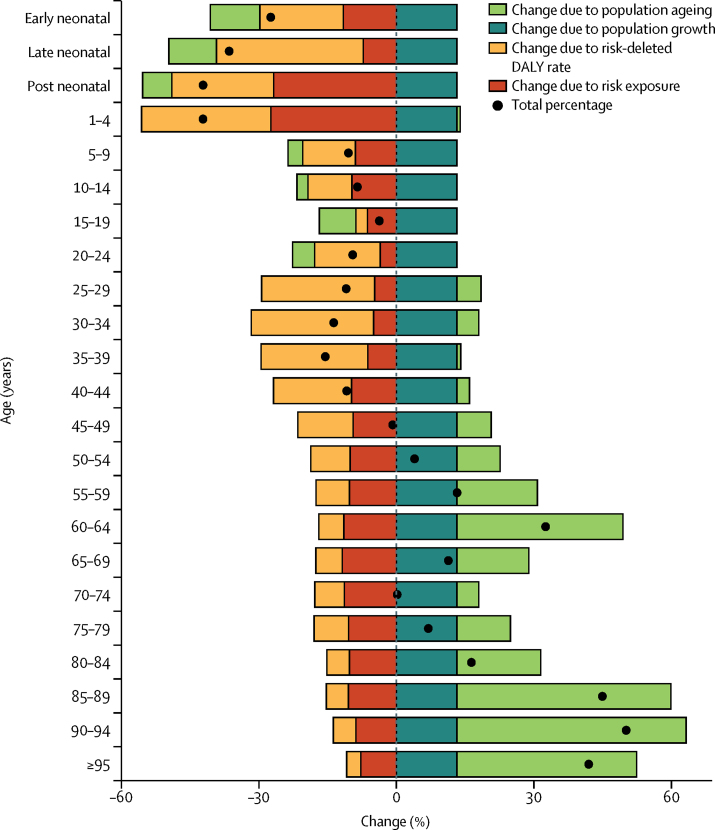
Findings: Since 1990, exposure increased significantly for 30 risks, did not change significantly for four risks, and decreased significantly for 31 risks. Among risks that are leading causes of burden of disease, child growth failure and household air pollution showed the most significant declines, while metabolic risks, such as body-mass index and high fasting plasma glucose, showed significant increases. In 2016, at Level 3 of the hierarchy, the three leading risk factors in terms of attributable DALYs at the global level for men were smoking (124·1 million DALYs [95% UI 111·2 million to 137·0 million]), high systolic blood pressure (122·2 million DALYs [110·3 million to 133·3 million], and low birthweight and short gestation (83·0 million DALYs [78·3 million to 87·7 million]), and for women, were high systolic blood pressure (89·9 million DALYs [80·9 million to 98·2 million]), high body-mass index (64·8 million DALYs [44·4 million to 87·6 million]), and high fasting plasma glucose (63·8 million DALYs [53·2 million to 76·3 million]). In 2016 in 113 countries, the leading risk factor in terms of attributable DALYs was a metabolic risk factor. Smoking remained among the leading five risk factors for DALYs for 109 countries, while low birthweight and short gestation was the leading risk factor for DALYs in 38 countries, particularly in sub-Saharan Africa and South Asia. In terms of important drivers of change in trends of burden attributable to risk factors, between 2006 and 2016 exposure to risks explains an 9·3% (6·9-11·6) decline in deaths and a 10·8% (8·3-13·1) decrease in DALYs at the global level, while population ageing accounts for 14·9% (12·7-17·5) of deaths and 6·2% (3·9-8·7) of DALYs, and population growth for 12·4% (10·1-14·9) of deaths and 12·4% (10·1-14·9) of DALYs. The largest contribution of trends in risk exposure to disease burden is seen between ages 1 year and 4 years, where a decline of 27·3% (24·9-29·7) of the change in DALYs between 2006 and 2016 can be attributed to declines in exposure to risks.
Interpretation: Increasingly detailed understanding of the trends in risk exposure and the RRs for each risk-outcome pair provide insights into both the magnitude of health loss attributable to risks and how modification of risk exposure has contributed to health trends. Metabolic risks warrant particular policy attention, due to their large contribution to global disease burden, increasing trends, and variable patterns across countries at the same level of development. GBD 2016 findings show that, while it has huge potential to improve health, risk modification has played a relatively small part in the past decade.
Funding: The Bill & Melinda Gates Foundation, Bloomberg Philanthropies.
Copyright © 2017 The Author(s). Published by Elsevier Ltd. This is an Open Access article under the CC BY 4.0 license. Published by Elsevier Ltd.. All rights reserved.
Figures
Comment in
-
Air pollution and cardiovascular disease: a window of opportunity.Nat Rev Cardiol. 2018 Apr;15(4):193-194. doi: 10.1038/nrcardio.2017.207. Epub 2018 Jan 3. Nat Rev Cardiol. 2018. PMID: 29297510 Free PMC article.
References
-
- Been JV, Sheikh A. Risk factors for neonatal disorders and the Global Burden of Disease. Lancet. 2016;388:560–561. - PubMed
-
- Britton A, Bell S. The protective effects of moderate drinking: lies, damned lies, and… selection biases? Addict Abingdon Engl. 2017;112:218–219. - PubMed
-
- Steenland K. Excess deaths due to occupation. Occup Env Med. 2016;73:497–498. - PubMed
-
- Forouzanfar M, Afshin A, Alexander LT, Anderson H, Bhutta Z, Murray CJL. Global, regional, and national comparative risk assessment of 79 behavioural, environmental and occupational, and metabolic risks or clusters of risks, 1990-2015: a systematic analysis for the Global Burden of Disease Study 2015. Lancet. 2016;388:1659–1724. - PMC - PubMed
MeSH terms
Grants and funding
- R21 AG032572/AG/NIA NIH HHS/United States
- U01 AG009740/AG/NIA NIH HHS/United States
- MC_UU_12011/2/MRC_/Medical Research Council/United Kingdom
- D43 TW009775/TW/FIC NIH HHS/United States
- MC_U147585819/MRC_/Medical Research Council/United Kingdom
- 201900/WT_/Wellcome Trust/United Kingdom
- SPHSU13/CSO_/Chief Scientist Office/United Kingdom
- MC_UP_A620_1014/MRC_/Medical Research Council/United Kingdom
- R01 HD084233/HD/NICHD NIH HHS/United States
- R01 AG030153/AG/NIA NIH HHS/United States
- R01 HD087993/HD/NICHD NIH HHS/United States
- SCAF/15/02/CSO_/Chief Scientist Office/United Kingdom
- HHSN271201300071C/AG/NIA NIH HHS/United States
- MC_U147585824/MRC_/Medical Research Council/United Kingdom
- 201900/Z/16/Z/WT_/Wellcome Trust/United Kingdom
- MC_UU_12017/13/MRC_/Medical Research Council/United Kingdom
- MC_UP_A620_1015/MRC_/Medical Research Council/United Kingdom
- P01 HD031921/HD/NICHD NIH HHS/United States
- MC_U147585827/MRC_/Medical Research Council/United Kingdom
- U01 AI096299/AI/NIAID NIH HHS/United States
- SPHSU15/CSO_/Chief Scientist Office/United Kingdom
- U54 HG007479/HG/NHGRI NIH HHS/United States
- MR/K013351/1/MRC_/Medical Research Council/United Kingdom
- MC_UU_12011/1/MRC_/Medical Research Council/United Kingdom
- R01 AI124389/AI/NIAID NIH HHS/United States
- MC_UU_12017/15/MRC_/Medical Research Council/United Kingdom
- G0400491/MRC_/Medical Research Council/United Kingdom
- CDF-2011-04-048/DH_/Department of Health/United Kingdom
- R03 AG043052/AG/NIA NIH HHS/United States
- R01 AI112339/AI/NIAID NIH HHS/United States
LinkOut - more resources
Full Text Sources
Other Literature Sources
Medical
Miscellaneous
