. 2017 Oct 9;43(1):60-70.e5.
doi: 10.1016/j.devcel.2017.08.012. Epub 2017 Sep 14.

Adaptive Evolution Leads to Cross-Species Incompatibility in the piRNA Transposon Silencing Machinery

Affiliations

Adaptive Evolution Leads to Cross-Species Incompatibility in the piRNA Transposon Silencing Machinery

Swapnil S Parhad et al. Dev Cell. .

Abstract

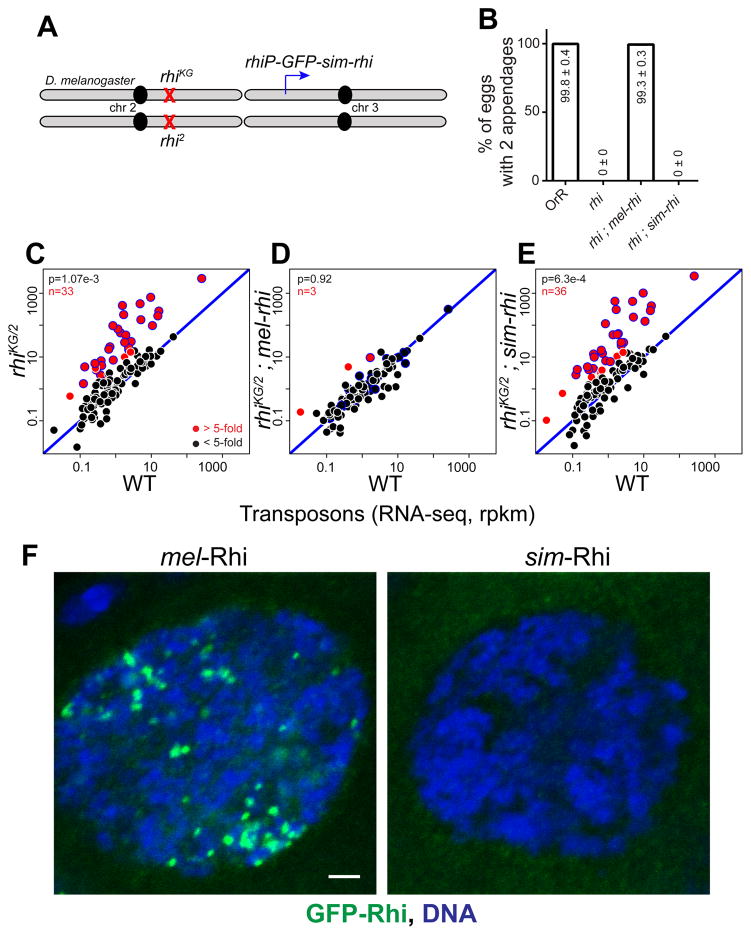
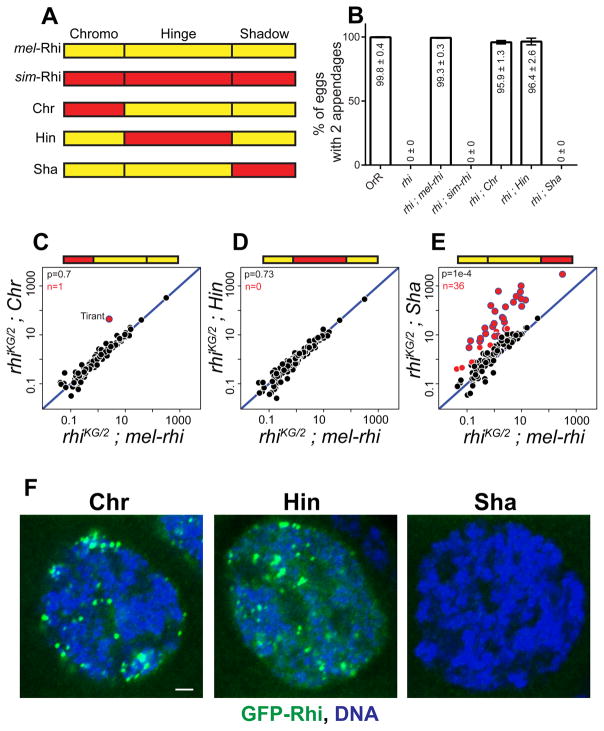
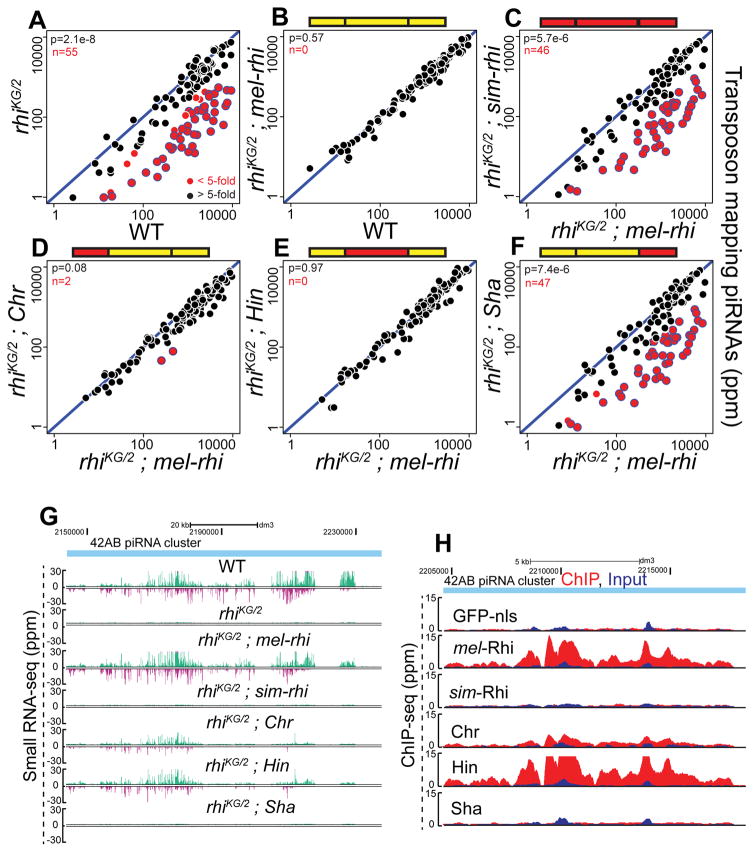
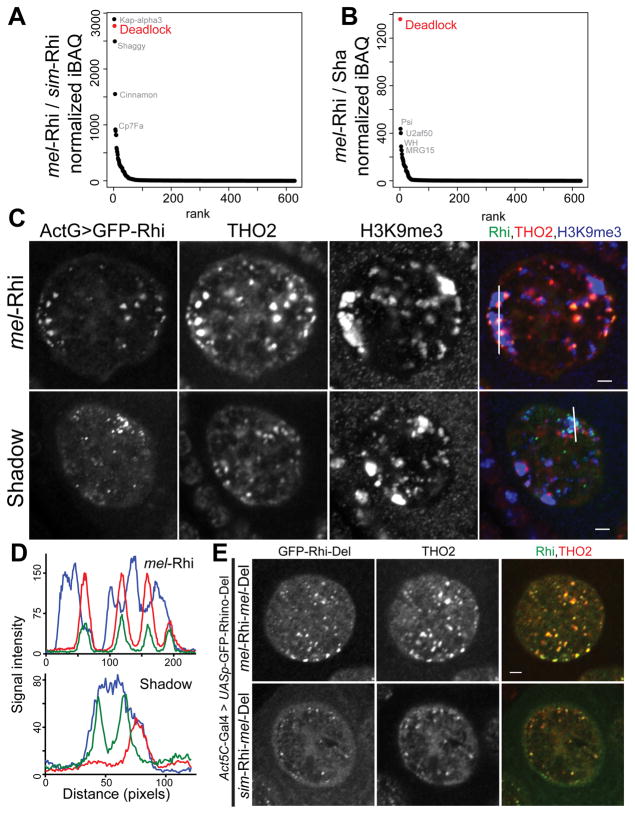
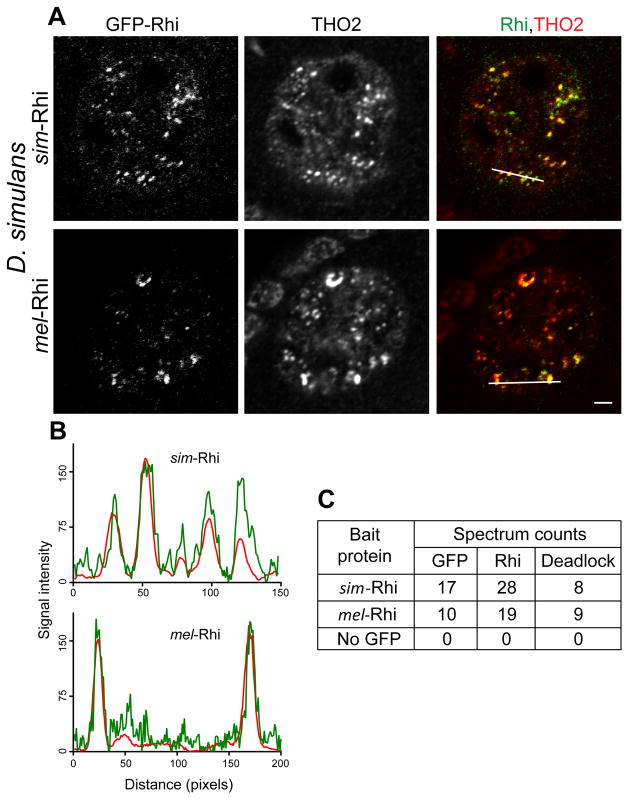
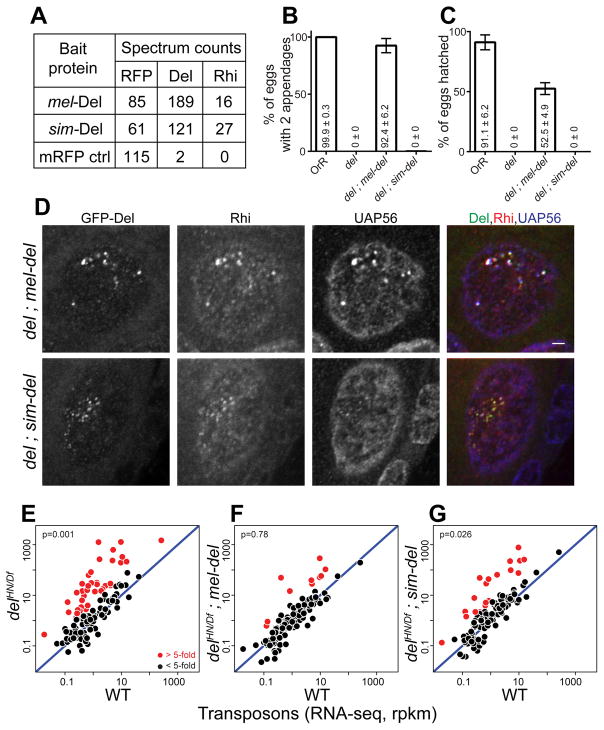
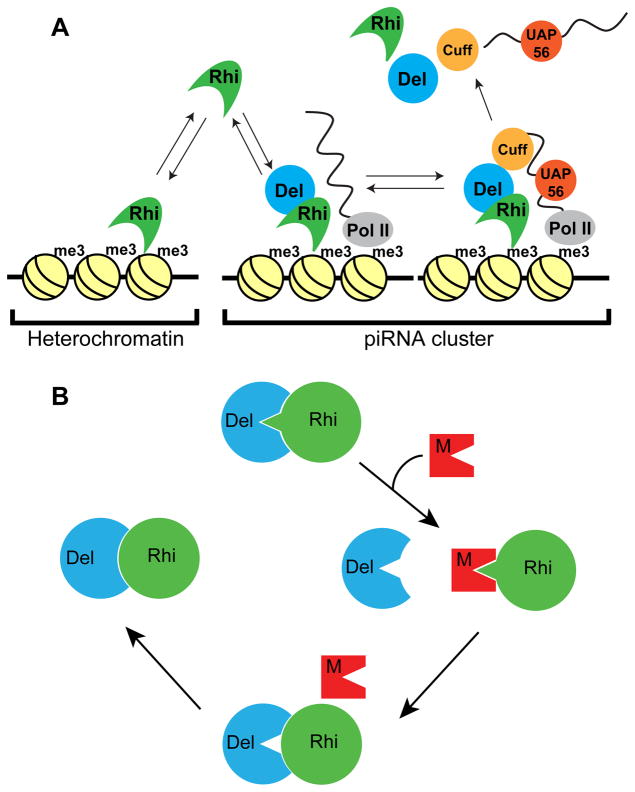
Reproductive isolation defines species divergence and is linked to adaptive evolution of hybrid incompatibility genes. Hybrids between Drosophila melanogaster and Drosophila simulans are sterile, and phenocopy mutations in the PIWI interacting RNA (piRNA) pathway, which silences transposons and shows pervasive adaptive evolution, and Drosophila rhino and deadlock encode rapidly evolving components of a complex that binds to piRNA clusters. We show that Rhino and Deadlock interact and co-localize in simulans and melanogaster, but simulans Rhino does not bind melanogaster Deadlock, due to substitutions in the rapidly evolving Shadow domain. Significantly, a chimera expressing the simulans Shadow domain in a melanogaster Rhino backbone fails to support piRNA production, disrupts binding to piRNA clusters, and leads to ectopic localization to bulk heterochromatin. Fusing melanogaster Deadlock to simulans Rhino, by contrast, restores localization to clusters. Deadlock binding thus directs Rhino to piRNA clusters, and Rhino-Deadlock co-evolution has produced cross-species incompatibilities, which may contribute to reproductive isolation.

Keywords: adaptive evolution; chromatin; piRNA; reproductive isolation; transposon silencing.


Figures

Figure 1
Figure 1. simulans Rhi does not function in melanogaster
(A) Genetic complementation strategy. The sim-rhi gene was expressed under endogenous rhi promoter in a melanogaster rhiKG/2 trans-heterozygous null background. (B) Bar graphs showing percentages of eggs with normal dorsoventral patterning produce by OrR (wild type (WT) control), rhi mutants, and rhi mutants rescued by either mel-rhi or sim-rhi. The numbers in/above the bars show mean ± standard deviation of three biological replicates, with a minimum of 500 embryos scored per replicate, except for rhi mutants and rhi mutants rescued by sim-rhi where average of at least 30 eggs were scored. (C–E) Transposon expression in rhi mutants (C), rhi mutant rescued by mel-rhi (D), and rhi mutants rescued by sim-rhi (E). RNA-seq was performed on ovaries, and each point on the scatterplots shows rpkm values for a transposons family in ovaries of the indicated mutant/transgene combination relative to WT control. Diagonal represents x=y. Points in red show y/x>5 (n is number of these transposons). Blue bordered points are over-expressed by 5 fold or more in rhi mutants and rhi mutants expressing sim-rhi. p value for differences obtained by Wilcoxon test. (F) Localization of rhi promoter driven GFP tagged mel-Rhi and sim-Rhi in melanogaster germline. GFP-Rhi is in green and DNA is in blue. Scale bar: 2 μm See also Figure S1.
Figure 2
Figure 2. The Shadow domain of sim-Rhi does not function in sibling species melanogaster
(A) Design of Rhino chimeras: Chromo (Chr), Hinge (Hin) and Shadow (Sha) domains are shown for mel-Rhi (yellow) and sim-Rhi (red). Each domain from sim-Rhi is placed in the mel-Rhi backbone and expressed as a GFP tagged transgene driven by the rhi promoter. (B) Bar graphs showing percentages of eggs with normal dorsoventral patterning produced by OrR (WT control), rhi mutant, and rhi mutants expressing mel-rhi, sim-rhi or the chimeric Rhi variants. The numbers in/above the bars show mean ± standard deviation of three biological replicates, with a minimum of 500 embryos scored per replicate, except for rhi mutants and rhi mutants rescued by sim-rhi or Shadow chimera where average of at least 30 eggs were scored. (C–E) Scatterplots showing transposon expression, measured by RNA-seq, in ovaries of rhi mutant expressing the chimeras vs. mel-rhi. Each point represents rpkm values for a different transposon family. Diagonal represents x=y. Points in red show y/x>5 (n is number of these transposons). Blue bordered points are over-expressed in rhi mutants, rhi mutants expressing sim-rhi, and rhi mutants expressing the Sha chimera. p value for differences obtained by Wilcoxon test. (F) Localization of rhi promoter driven GFP tagged Rhino variants in melanogaster germline. GFP-Rhi is in green and DNA is in blue. Scale bar: 2 μm. See also Figure S2.
Figure 3
Figure 3. sim-Rhi and Shadow chimera do not bind to piRNA clusters and fail to support piRNA production
(A–F) Scatterplots showing abundance of transposon mapping piRNAs in ovaries of rhi mutant (A), rhi mutant expressing either mel-rhi (B) vs. WT control, sim-rhi (C) or the chimeras (D-F) vs. mel-rhi. Points in red show x/y>5 (n is number of these transposons). Blue bordered points have reduced expression in rhi mutants, rhi mutants expressing sim-Rhi, and rhi mutants expressing the Sha chimera. p value for differences is obtained by Wilcoxon test. (G) Genome browser view showing abundance of piRNAs uniquely mapping to 42AB piRNA cluster in WT, rhi mutant and rhi mutants expressing mel-rhi, sim-rhi or chimeric proteins. The Watson strand is in green, and Crick strand in magenta. (H) Genome browser view of ChIP-seq profiles at 42AB cluster for mel-Rhi, sim-Rhi, chimeras, and GFP-nls control. All ChIP done under identical conditions, using the same anti-GFP antibody. ChIP signal in red, input signal in blue. See also Figure S3.
Figure 4
Figure 4. Cross species incompatibility in Rhi-Del interaction
(A, B) Mass spectrometric analysis of Rhi binding proteins. Graphs showing ratios of GFP normalized iBAQ values for mel-Rhi vs. sim-Rhi (A), and mel-Rhi vs. Sha chimera (B), ranked by ratio values. Transgenes were expressed in melanogaster using the germline specific nanos-Gal4 driver. (C) Localization of THO2 (piRNA cluster marker), H3K9me3 marked chromatin in the germline nuclei expressing Act5C-Gal4 driven Rhi:GFP. Color assignments for merged image shown on top. Scale bar: 2μm. Fluorescence intensities are measured along the line shown in merged image for Rhi:GFP (green), THO2 (red) and H3K9me3 (blue) as depicted in (D). (E) Localization of Act5C-Gal4 driven Rhi-Del fusion proteins with respect to THO2 (piRNA cluster marker) in the female germline nuclei. Scale bar: 2μm. See also Figure S4.
Figure 5
Figure 5. mel-Rhi binds to Del in simulans and localizes to piRNA clusters
(A) Localization of sim-Rhi:GFP and mel-Rhi:GFP in the simulans female germline. Egg chambers were double labeled for the piRNA cluster marker THO2. Both forms of Rhi co-localize to nuclear foci with THO2. Scale bar: 2μm. Fluorescence intensities are measured along the line shown in merged image for Rhi:GFP (green), THO2 (red) as depicted in (B). (C) Total spectrum counts for GFP, Rhi and Del co-precipitating with sim-Rhi and mel-Rhi expressed in simulans. Expression was driven with the rhi promoter. Both sim-Rhi and mel-Rhi coprecipitate with the endogenous simulans Del ortholog.
Figure 6
Figure 6. sim-Del binds to mel-Rhi, but fails to function in melanogaster
(A) Mass spectrometric analysis of Del binding proteins. Table shows total spectrum counts for the mRFP tag, Rhi and Del in immunoprecipitates of mel-Del, sim-Del and mRFP control, expressed in the melanogaster germline under nanos-Gal4 driver. sim-Del co-precipitates with mel-Rhi. (B, C) Bar graphs showing percentages of eggs with normal dorsoventral patterning (B) and percentages of hatched eggs (C) produced by females of the following genotypes: OrR (WT control); del mutant; del mutants expressing either mel-del or sim-del. sim-del fails to rescue embryo patterning and hatching. The numbers in/above the bars show mean ± standard deviation of three biological replicates, with a minimum of 100 embryos scored per replicate, except for del mutants where average of 7.33 eggs were scored. (D) Localization of Rhi and UAP56 in del mutants expressing either mel-Del or sim-Del. Scale bar: 2μm (all images at same scale). (E-G) Scatterplots showing transposon expression levels measured by RNA-seq in ovaries of del mutant (E), del mutant rescued by either mel-del (F) or sim-del (G) vs. WT control. Each point represents rpkm values for a different transposon. Diagonal represents x=y. Points in red show y/x>5. p value for differences is obtained by Wilcoxon test. sim-del fails to rescue transposon silencing. See also Figure S5.
Figure 7
Figure 7. Model for co-evolution of the Rhino-Deadlock interface
(A) Model for Del function in Rhi localization to piRNA clusters. The Rhi Chromo domain interact with H3K9me3 marks throughout the genome, but most of these marks are in transcriptionally silent regions. At clusters, which are transcribed, Del interactions with Cuff, a putative RNA end binding protein, leads to formation of a chromatin bound complex, which recruits additional RNA binding components (i.e. UAP56). Assembly of these complexes leads to Rhi accumulation at clusters. We further propose that release of piRNA precursor complexes is accompanied by release and recycling of Rhi, Del and Cuff, which then re-initiate the cycle. (B) A transposon mutation generates a protein that mimics the Del surface that binds to Rhi. Competition for productive Rhi-Del complex formation disrupts piRNA biogenesis and causes increased transposition. Reduced fertility leads to selection of Rhi mutations that reduce mimic binding, at the expense of Rhi-Del affinity. “Leaky” transposition leads to selection of Del mutations that completely restore Rhi binding. Pathogen mimicry thus leads to rapid evolution of Rhi-Del interface. See also Figure S6.

Comment in

References

    1. Bannister AJ, Zegerman P, Partridge JF, Miska EA, Thomas JO, Allshire RC, Kouzarides T. Selective recognition of methylated lysine 9 on histone H3 by the HP1 chromo domain. Nature. 2001;410:120–124. - PubMed
    1. Bartolome C, Bello X, Maside X. Widespread evidence for horizontal transfer of transposable elements across Drosophila genomes. Genome Biol. 2009;10:R22. - PMC - PubMed
    1. Batista PJ, Ruby JG, Claycomb JM, Chiang R, Fahlgren N, Kasschau KD, Chaves DA, Gu W, Vasale JJ, Duan S, et al. PRG-1 and 21U-RNAs interact to form the piRNA complex required for fertility in C. elegans. Mol Cell. 2008;31:67–78. - PMC - PubMed
    1. Belancio VP, Hedges DJ, Deininger P. Mammalian non-LTR retrotransposons: for better or worse, in sickness and in health. Genome Res. 2008;18:343–358. - PubMed
    1. Belyayev A. Bursts of transposable elements as an evolutionary driving force. J Evol Biol. 2014;27:2573–2584. - PubMed

Publication types

MeSH terms