. 2017 Sep 5:12:6537-6558.
doi: 10.2147/IJN.S125281. eCollection 2017.

Combination of graphene oxide-silver nanoparticle nanocomposites and cisplatin enhances apoptosis and autophagy in human cervical cancer cells

Affiliations

Combination of graphene oxide-silver nanoparticle nanocomposites and cisplatin enhances apoptosis and autophagy in human cervical cancer cells

Yu-Guo Yuan et al. Int J Nanomedicine. .

Abstract

Background: Cisplatin (Cis) is a widely used chemotherapeutic drug for treating a variety of cancers, due to its ability to induce cell death in cancer cells significantly. Recently, graphene and its modified nanocomposites have gained much interest in cancer therapy, due to their unique physicochemical properties. The objective of this study was to investigate the combination effect of Cis and a reduced graphene oxide-silver nanoparticle nanocomposite (rGO-AgNPs) in human cervical cancer (HeLa) cells.

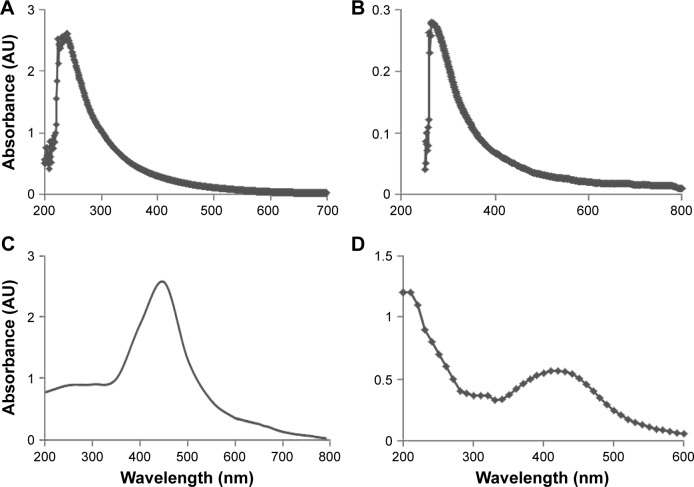
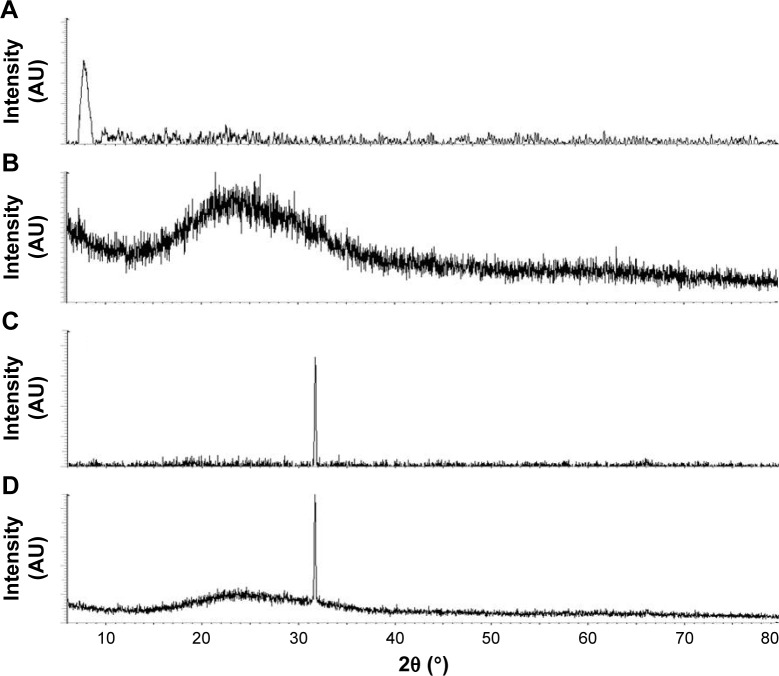
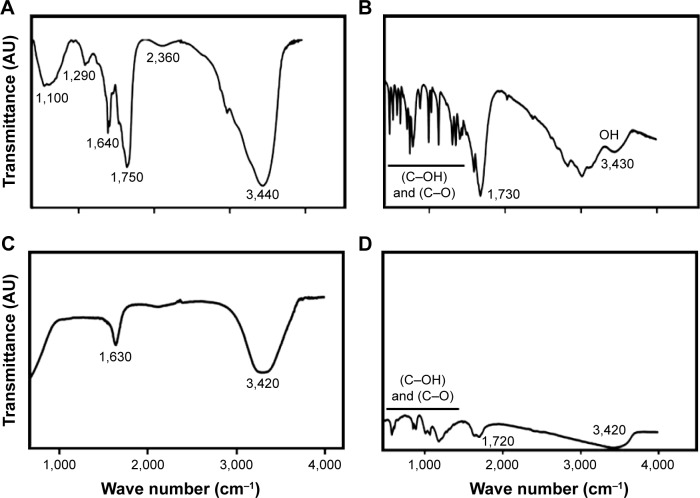
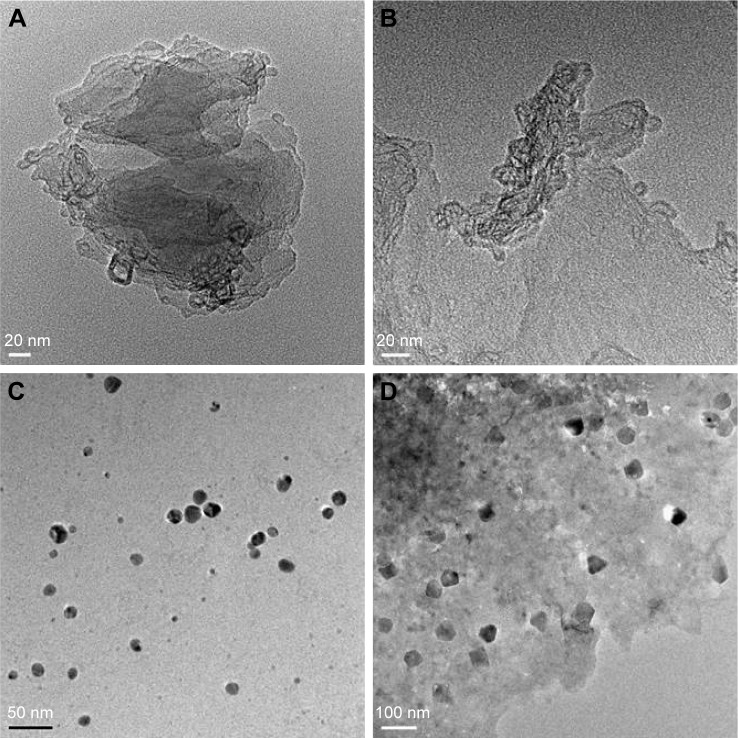
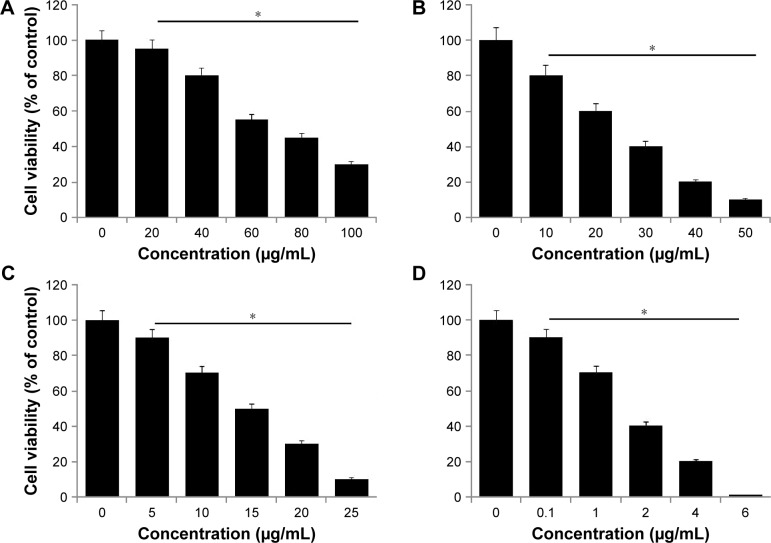
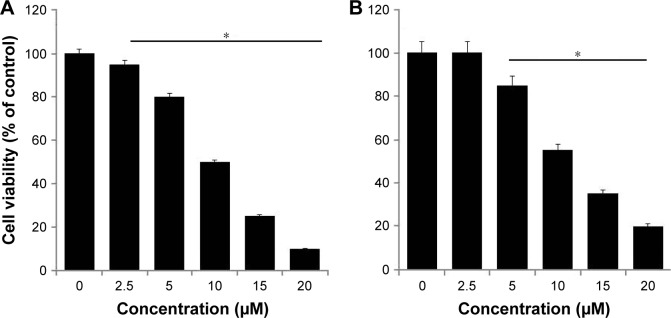
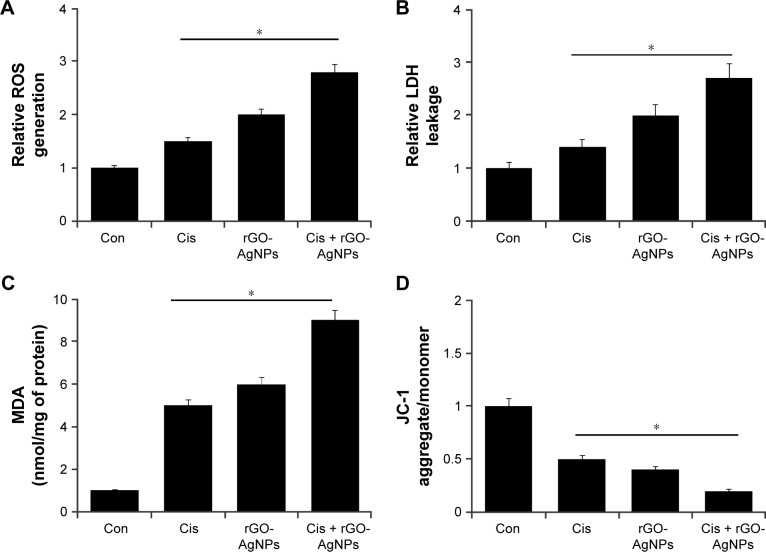
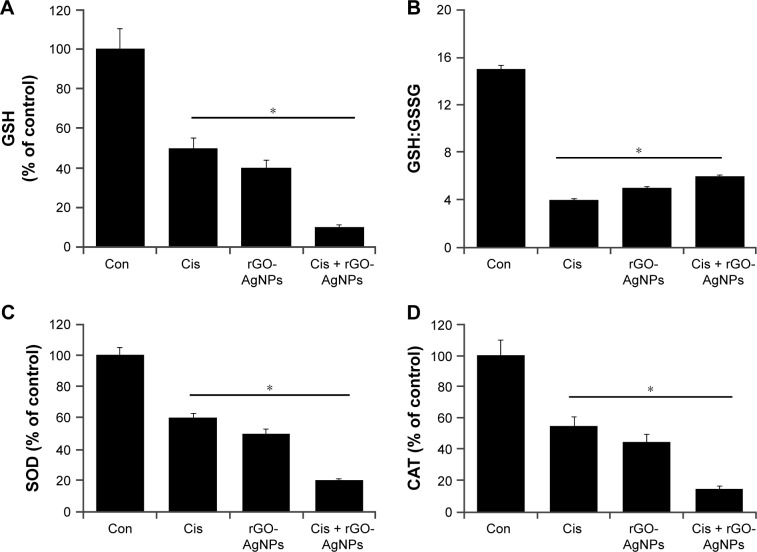
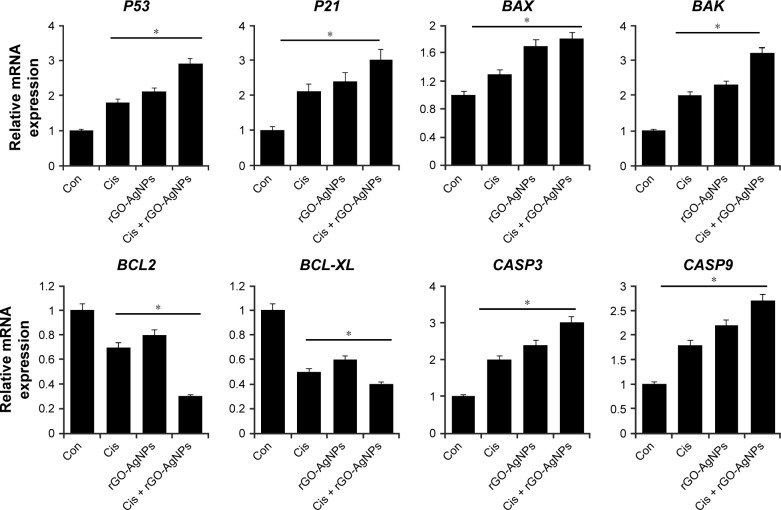
Materials and methods: We synthesized AgNPs, rGO, and rGO-AgNP nanocomposites using C-phycocyanin. The synthesized nanomaterials were characterized using various analytical techniques. The anticancer properties of the Cis, rGO-AgNPs, and combination of Cis and rGO-AgNPs were evaluated using a series of cellular assays, such as cell viability, cell proliferation, LDH leakage, reactive oxygen species generation, and cellular levels of oxidative and antioxidative stress markers such as malondialdehyde, glutathione, SOD, and CAT. The expression of proapoptotic, antiapoptotic, and autophagy genes were measured using real-time reverse-transcription polymerase chain reaction.

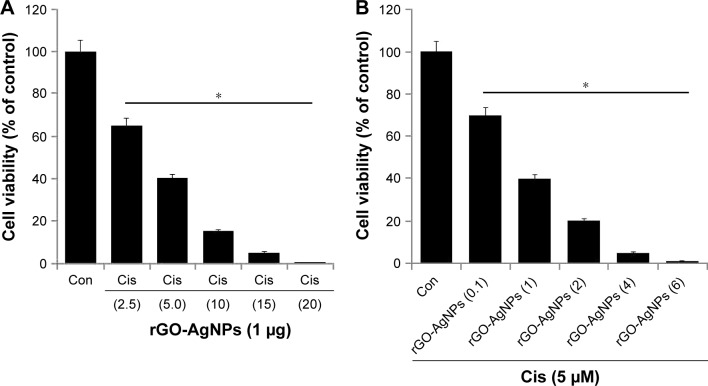
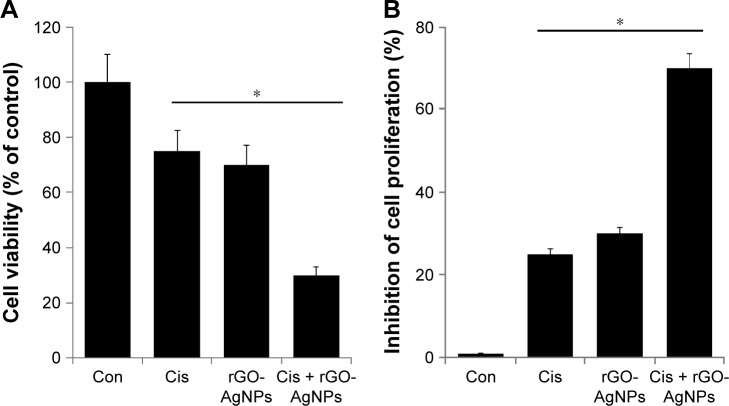
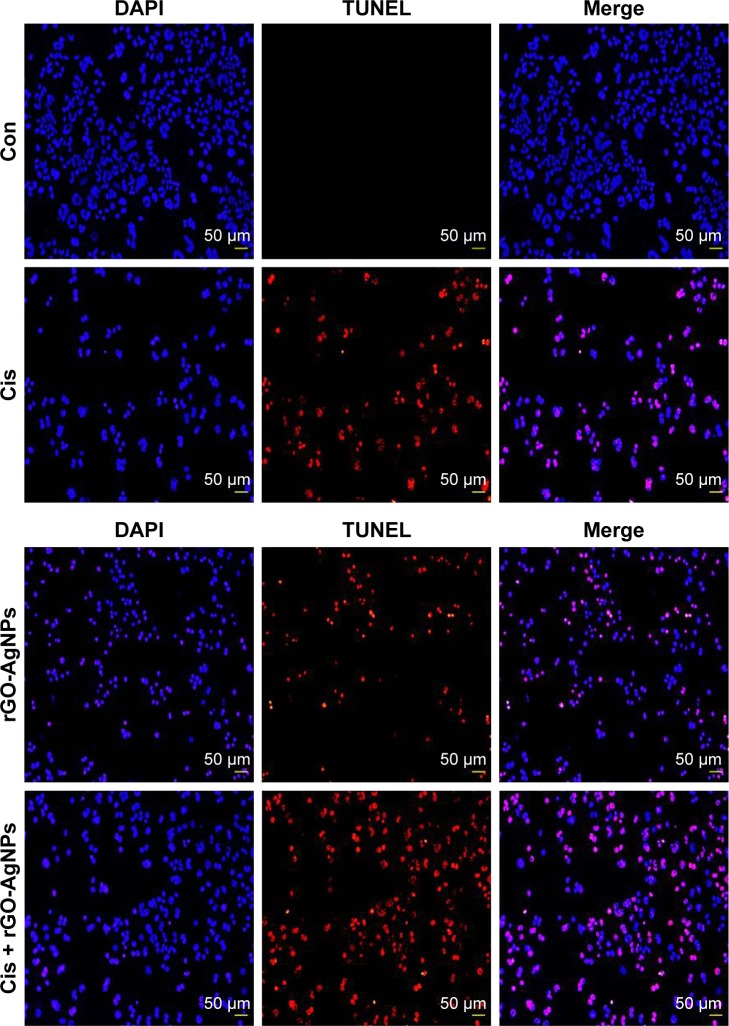
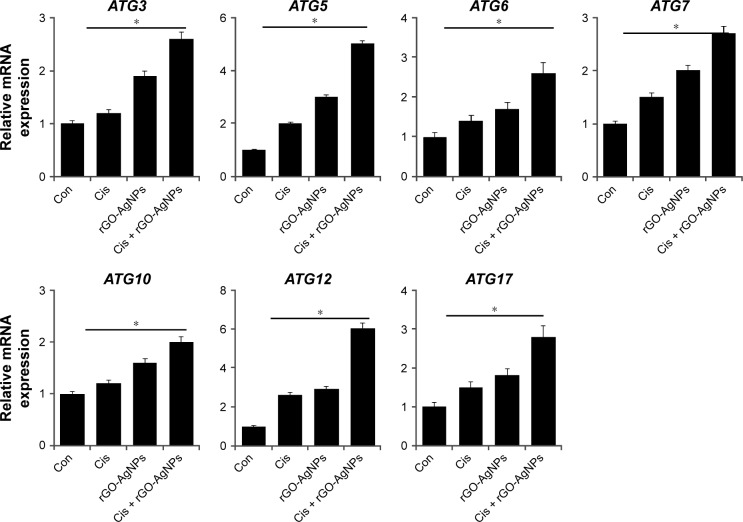
Results: The synthesized AgNPs were well dispersed, homogeneous, and spherical, with an average size of 10 nm and uniformly distributed on graphene sheets. Cis, GO, rGO, AgNPs, and rGO-AgNPs inhibited cell viability in a dose-dependent manner. The combination of Cis and rGO-AgNPs showed significant effects on cell proliferation, cytotoxicity, and apoptosis. The combination of Cis and rGO-AgNPs had more pronounced effects on the expression of apoptotic and autophagy genes, and also significantly induced the accumulation of autophagosomes and autophagolysosomes, which was associated with the generation of reactive oxygen species.

Conclusion: Our findings substantiated rGO-AgNPs strongly potentiating Cis-induced cytotoxicity, apoptosis, and autophagy in HeLa cells, and hence rGO-AgNPs could be potentially applied to cervical cancer treatment as a powerful synergistic agent with Cis or any other chemotherapeutic agents.

Keywords: apoptosis; autophagy; cell viability; cisplatin; graphene oxide–silver nanoparticles nanocomposites; oxidative stress.


Conflict of interest statement

Disclosure The authors report no conflicts of interest in this work.

Figures

Figure 1
Figure 1
Characterization of GO, rGO, AgNPs, and rGO-AgNP nanocomposites using ultraviolet-visible spectroscopy. Notes: (A) Spectra of GO exhibited a maximum absorption peak at ∼231 nm, corresponding to the π–π transitions of aromatic C–C bonds. (B) The absorption peak for rGO was red-shifted to 263 nm. (C) The absorption spectrum of AgNPs synthesized by C-phycocyanin exhibited a strong broad peak at 420 nm, which was assigned to surface plasmon resonance of the NPs. (D) A new peak at 420 nm was observed after deposition of AgNPs on the rGO surface; the band at 420 nm in the absorption spectrum of the rGO-AgNP nanocomposite was attributed to surface plasmons and the presence of AgNPs. At least three independent experiments were performed for each sample, and reproducible results were obtained. The data show the results of a representative experiment. Abbreviations: rGO, reduced graphene oxide; NPs, nanoparticles.
Figure 2
Figure 2
X-ray diffraction (XRD) patterns of GO, rGO, AgNPs, and rGO-AgNP nanocomposites. Notes: (A) In the XRD pattern of GO, a strong sharp peak at 2θ=11.7° corresponded to an interlayer distance of 7.6 Å. (B) rGO had a broad peak centered at 2θ=25.88°, corresponding to an interlayer distance of 3.6 Å. Apart from the characteristic reflections of rGO (2θ=25.88°). (C) AgNPs showed distinct reflections in the diffractogram at 32.8°, corresponding to the (111) planes. (D) rGO-AgNPs showed two different distinct reflections in the diffractogram at 25.88°, corresponding to rGO, and 32.8°, corresponding to the (111) planes of face-centered cubic Ag. At least three independent experiments were performed for each sample, and reproducible results were obtained. The data show the results of a representative experiment. Abbreviations: rGO, reduced graphene oxide; NPs, nanoparticles.
Figure 3
Figure 3
Fourier-transform infrared (FTIR) spectra of GO, rGO, AgNPs, and rGO-AgNP nanocomposites. Notes: Dried powders of (A) GO, (B) rGO, (C) AgNPs, and (D) rGO-AgNPs were diluted with KBr to perform FTIR spectroscopy, and spectra were obtained using GX spectrometry within the range of 500–4,000 cm−1. Abbreviations: rGO, reduced graphene oxide; NPs, nanoparticles.
Figure 4
Figure 4
Transmission electron microscopy (TEM) images of GO, rGO, AgNPs, and rGO-Ag nanocomposites. Notes: TEM studies of the (A) GO, (B) rGO, (C) AgNPs, and (D) rGO-AgNPs were carried out on a Hitachi H-7500, operating at 200 kV. Abbreviations: rGO, reduced graphene oxide; NPs, nanoparticles.
Figure 5
Figure 5
Effects of GO, rGO, AgNPs and rGO-Ag nanocomposites on the viability of HeLa cells. Notes: The viability of HeLa cells was determined after 24-hour exposure to different concentrations of (A) GO, (B) rGO, (C) AgNPs, and (D) rGO-AgNPs using the WST-8 assay. Results are expressed as mean ± standard deviation of three independent experiments. A significant difference was observed in each treated sample. The viability of treated cells was compared to untreated cells with Student’s t-test (*P<0.05). Abbreviations: rGO, reduced graphene oxide; NPs, nanoparticles.
Figure 6
Figure 6
Effect of Cis and OHP on cell viability of HeLa cells. Notes: The viability of HeLa cells was determined after 24-hour exposure to different concentrations of (A) Cis and (B) OHP using the WST-8 assay. Results are expressed as mean ± standard deviation of three independent experiments. A significant difference was observed above 50 μM. The viability of treated cells was compared to untreated cells with Student’s t-test (*P<0.05). Abbreviations: Cis, cisplatin; OHP, oxaliplatin; rGO, reduced graphene oxide; NPs, nanoparticles.
Figure 7
Figure 7
Increasing concentrations of Cis or rGO-AgNPs enhanced the loss of cell viability in HeLa cells. Notes: (A) HeLa cells were coincubated for 24 hours with increasing concentrations of Cis (2.5 to 20 μM) and) rGO-AgNPs (1 μg/mL), (B) increasing concentrations of rGO-AgNPs (0.1–6 μg/mL), and 5 μM Cis. Results are expressed as mean ± standard deviation of three separate experiments. The treated groups showed statistically significant differences from the Con group, as determined by Student’s t-test (*P<0.05). Abbreviations: Cis, cisplatin; rGO, reduced graphene oxide; NPs, nanoparticles; Con, control.
Figure 8
Figure 8
The effect of Cis or rGO-AgNPs alone or the combinatorial effect of Cis plus rGO-AgNPs on cell viability and proliferation in HeLa cells. Notes: HeLa cells were incubated with Cis (5 μM) or rGO-AgNPs (1 μg/mL) or a combination of Cis plus rGO-AgNPs for 24 hours. (A) Cell viability was measured using WST-8. (B) Cell proliferation was measured by trypan blue assay. Treated groups showed statistically significant differences from the Con group, as determined by Student’s t-test (*P<0.05). Abbreviations: Cis, cisplatin; rGO, reduced graphene oxide; NPs, nanoparticles; Con, control.
Figure 9
Figure 9
The effect of Cis or rGO-AgNPs alone or the combinatorial effect of Cis plus rGO-AgNPs on cell cytotoxicity in HeLa cells. Notes: HeLa cells were incubated with Cis (5 μM) or rGO-AgNPs (1 μg/mL) or a combination of Cis plus rGO-AgNPs for 24 hours. (A) ROS were measured, as relative fluorescence of 2′,7′-dichlorofluorescein, with spectrofluorometry. (B) LDH activity was measured at 490 nm, using an LDH-cytotoxicity kit. (C) The concentration of MDA was measured and expressed as nanomoles per milligram of protein. (D) MMP (ratio of JC-1 aggregate to monomer) was determined using JC-1 cationic dye after treatment. Results are expressed as mean ± standard deviation of three independent experiments. Treated groups showed statistically significant differences from the Con group, as determined by Student’s t-test (*P<0.05). Abbreviations: Cis, cisplatin; rGO, reduced graphene oxide; NPs, nanoparticles; ROS, reactive oxygen species; MDA, malondialdehyde; MMP, mitochondrial membrane potential; Con, control.
Figure 10
Figure 10
Effect of Cis or rGO-AgNPs alone or the combinatorial effect of Cis plus rGO-AgNPs on antioxidant markers in HeLa cells. Notes: Cells were treated with Cis (5 μM), rGO-AgNPs (1 μg/mL), or both Cis (5 μM) and rGO-AgNPs (1 μg/mL) for 24 hours. After incubation, the cells were harvested and washed twice with an ice-cold phosphate-buffered saline solution. The cells were collected and disrupted by ultrasonication for 5 minutes on ice. (A) GSH concentration is expressed as mg/g of protein. (B) Ratio of GSH:GSSG. (C) Specific activity of SOD is expressed as units per milligram of protein. (D) Specific activity of CAT is expressed as units per milligram of protein. Results are expressed as mean ± standard deviation of three independent experiments. There was a significant difference in treated cells compared to untreated cells with Student’s t-test (*P<0.05). Abbreviations: Cis, cisplatin; rGO, reduced graphene oxide; NPs, nanoparticles; GSH, glutathione; GSSG, glutathione disulfide; Con, control.
Figure 11
Figure 11
Combination of Cis and rGO-AgNPs increased the expression of proapoptotic genes and decreased the expression of antiapoptotic genes. Notes: The cells were treated with Cis (5 μM), rGO-AgNPs (1 μg/mL), or both Cis (5 μM) and rGO-AgNPs (1 μg/mL) for 24 hours. Relative messenger RNA (mRNA) expression of apoptotic and antiapoptotic genes was analyzed by quantitative reverse-transcription polymerase chain reaction in HeLa cells treated for 24 hours. Results are expressed as mean ± standard deviation of three independent experiments. The treated groups showed statistically significant differences from the Con group by Student’s t-test (*P<0.05). Abbreviations: Cis, cisplatin; rGO, reduced graphene oxide; NPs, nanoparticles; Con, control.
Figure 12
Figure 12
Combination of Cis and rGO-AgNPs enhanced apoptosis. Notes: Cells were treated with Cis (5 μM), rGO-AgNPs (1 μg/mL), or both Cis (5 μM) and rGO-AgNPs (1 μg/mL) for 24 hours. Apoptosis was assessed with a TUNEL assay; the nuclei were counterstained with DAPI. Representative images show apoptotic (fragmented) DNA (red staining) and corresponding cell nuclei (blue staining). Abbreviations: Cis, cisplatin; rGO, reduced graphene oxide; NPs, nanoparticles; Con, control.
Figure 13
Figure 13
Effect of Cis and rGO-AgNPs on expression of autophagy-regulated genes in HeLa cells. Notes: Cells were treated with Cis (5 μM), rGO-AgNPs (1 μg/mL), or both Cis (5 μM) and rGO-AgNPs (1 μg/mL) for 24 hours. Relative messenger RNA (mRNA) expression of autophagy genes was analyzed by quantitative reverse-transcription polymerase chain reaction in HeLa cells treated for 24 hours. Results are expressed as mean ± standard deviation of three independent experiments. The treated groups showed statistically significant differences from the Con group by Student’s t-test (*P<0.05). Abbreviations: Cis, cisplatin; rGO, reduced graphene oxide; NPs, nanoparticles; Con, control.
Figure 14
Figure 14
The combination of Cis and rGO-AgNPs induced accumulation of autophagolysosomes. Notes: Cells were treated with (A) control (B) Cis (5 μM), (C) rGO-AgNPs (1 μg/mL), or (D) both Cis (5 μM) and rGO-AgNPs (1 μg/mL) for 24 hours and processed for electron microscopy. Cis (5 μM)-, rGO-AgNP (1 μg/mL)-, or both Cis (5 μM)- and rGO-AgNP (1 μg/mL)-treated cells showed an increased number of autophagolysosomes formed, along with lysosomes, phagosomes, and autophagosomes. Abbreviations: Cis, cisplatin; rGO, reduced graphene oxide; NPs, nanoparticles; M, mitochondrion; N, nucleus; NE, nuclear envelope; Ap, autophagosome; Apl, autophagolysosome; Ly, lysosome.

Similar articles

Cited by

References

    1. International Agency for Research on Cancer Cervical cancer: estimated incidence, mortality and prevalence worldwide in 2012. [Accessed August 1, 2016]. Available from: http://globocan.iarc.fr/old/FactSheets/cancers/cervix-new.asp.
    1. American Cancer Society Chemotherapy for cervical cancer. 2016. [Accessed August 1, 2016]. Available from: http://www.cancer.org/cancer/cervicalcancer/detailedguide/cervical-cance....
    1. Jemal A, Bray F, Center MM, Ferlay J, Ward E, Forman D. Global cancer statistics. CA Cancer J Clin. 2011;61(2):69–90. - PubMed
    1. Ferlay J, Soerjomataram I, Dikshit R, et al. Cancer incidence and mortality worldwide: Sources, methods and major patterns in GLOBOCAN 2012. Int J Cancer. 2015;136(5):E359–E386. - PubMed
    1. Anton M, Horký M, Kuchtícková S, Vojtĕsek B, Bláha O. Immunohistochemical detection of acetylation and phosphorylation of histone H3 in cervical smears. Ceska Gynekol. 2004;69(1):3–6. - PubMed

MeSH terms