. 2017 Sep 6:10:4355-4367.
doi: 10.2147/OTT.S141239. eCollection 2017.

Biomarker analysis and clinical relevance of TK1 on the cell membrane of Burkitt's lymphoma and acute lymphoblastic leukemia

Affiliations

Biomarker analysis and clinical relevance of TK1 on the cell membrane of Burkitt's lymphoma and acute lymphoblastic leukemia

Evita G Weagel et al. Onco Targets Ther. .

Abstract

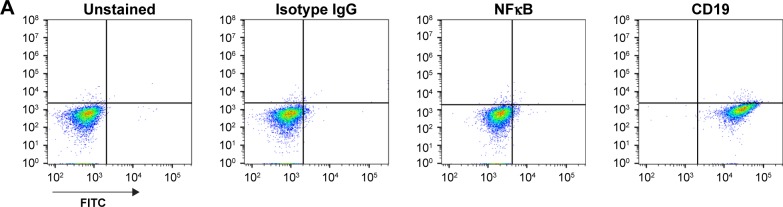
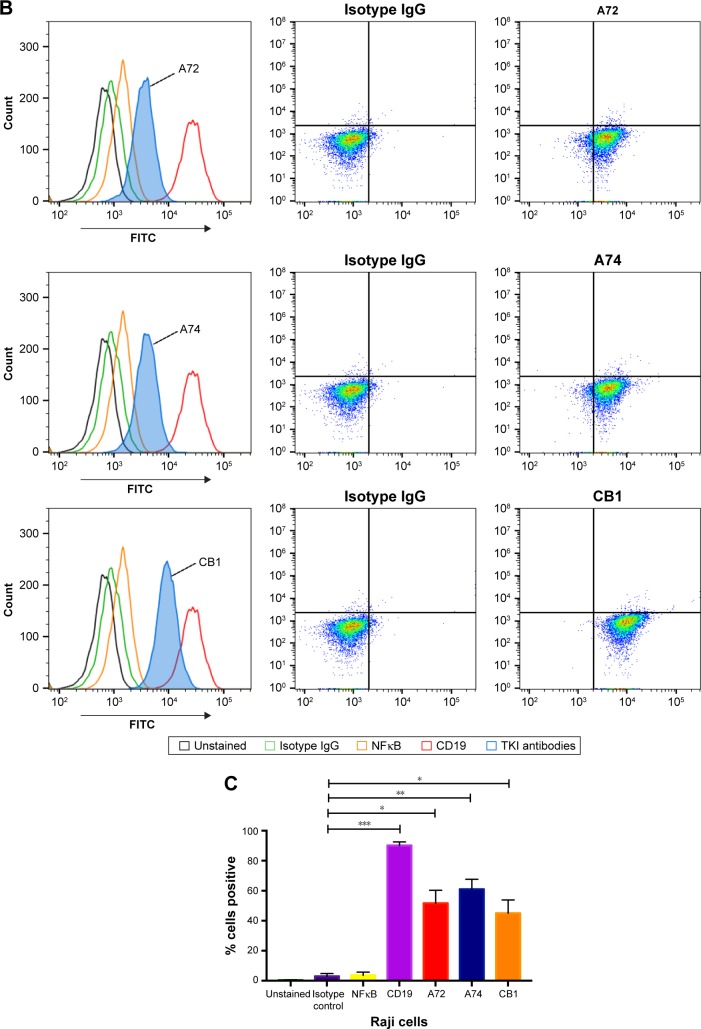
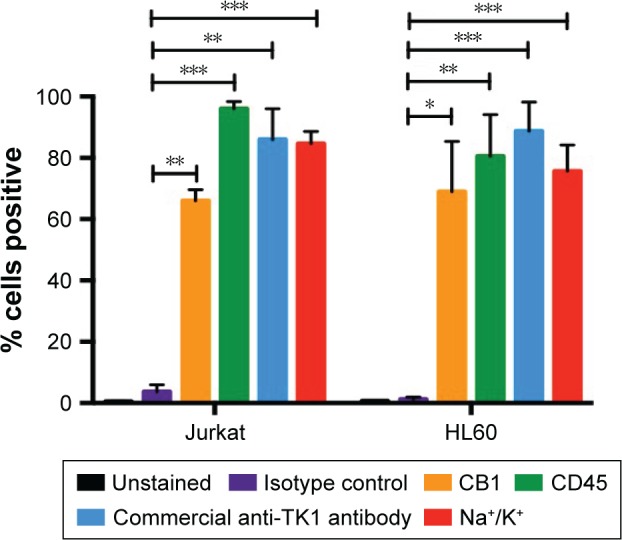
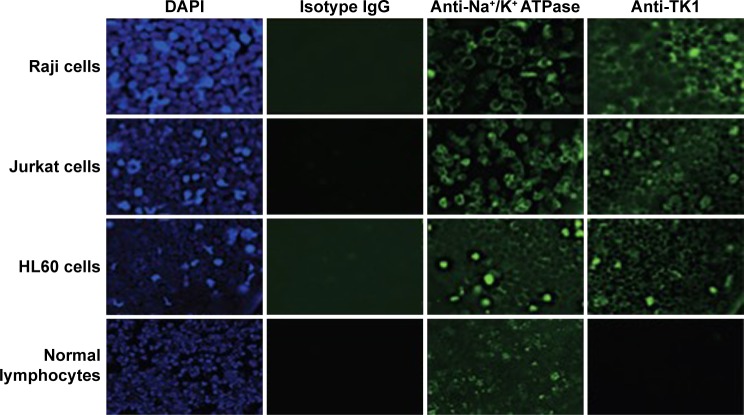
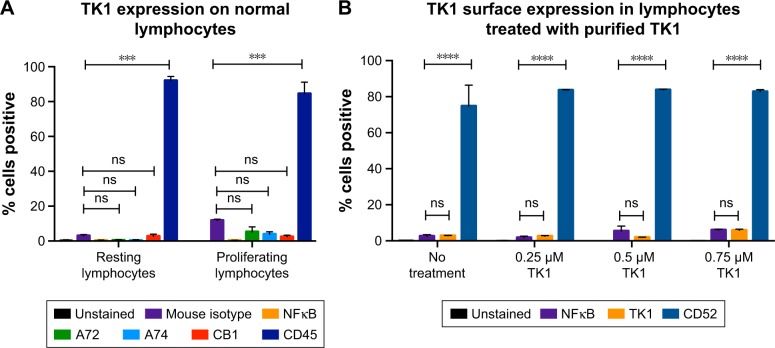
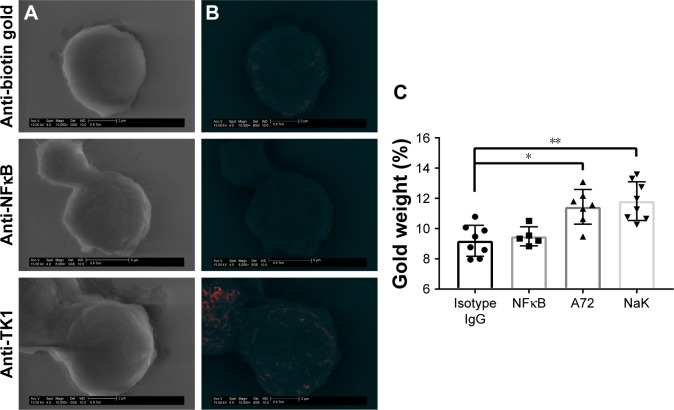
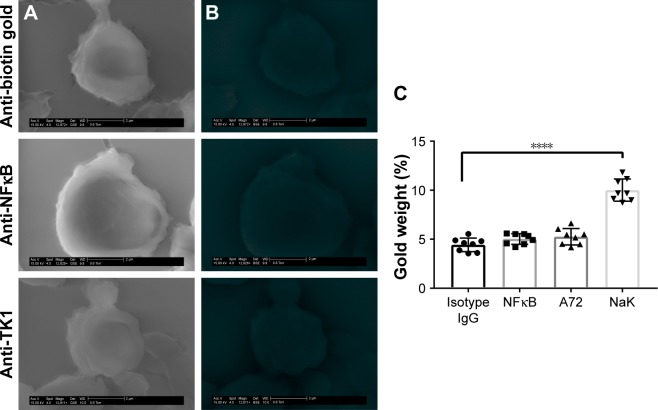
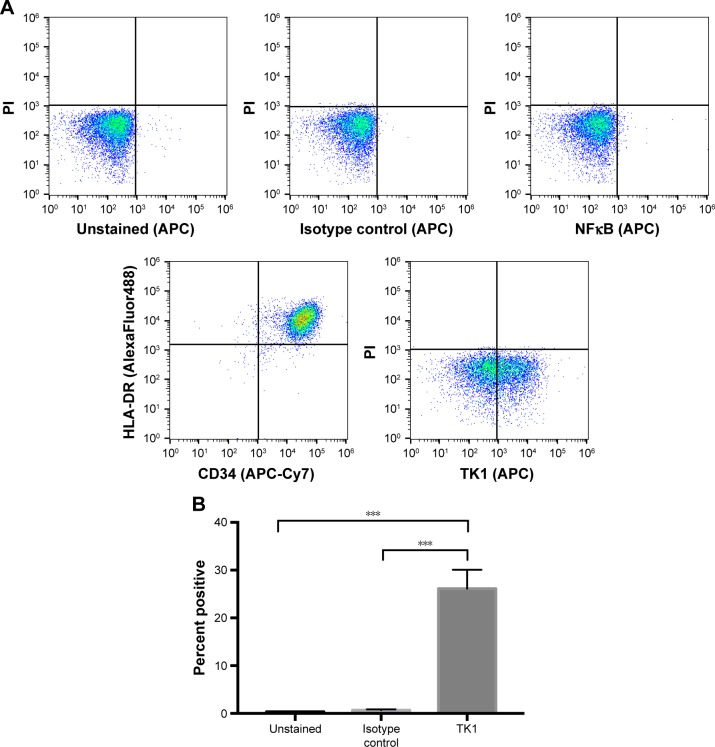
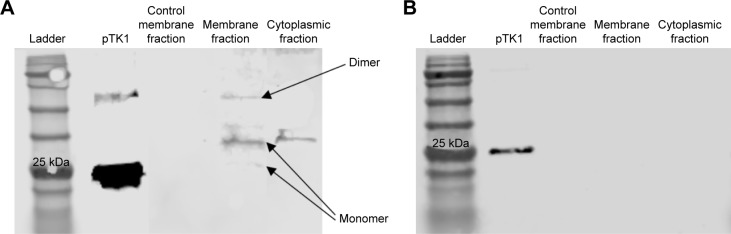
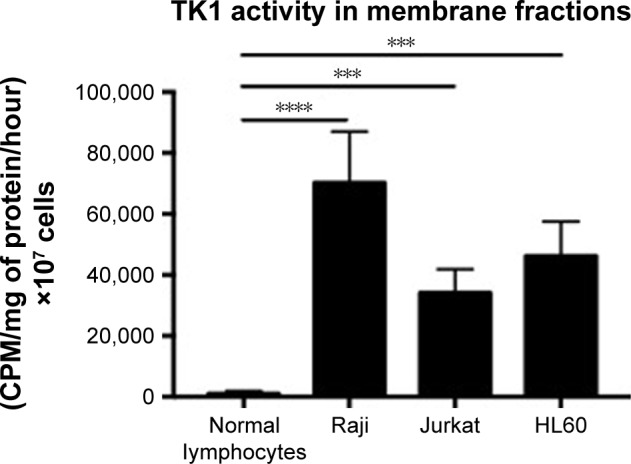
TK1 is an enzyme involved in DNA synthesis and repair. TK1 is usually found elevated in cancer patients' serum, which makes it a useful tumor proliferation biomarker that strongly correlates with cancer stage, metastatic capabilities, and recurrence risk. In this study, we show that TK1 is upregulated and localizes on the plasma membrane of Burkitt's lymphoma, acute promyelocytic leukemia, T cell leukemia, and acute lymphoblastic leukemia (ALL). Using flow cytometry, we confirmed that TK1 localizes on the surface of Raji, HL60, and Jurkat cell lines and on ALL clinical samples. Using fluorescent microscopy, we found a strong association of TK1 with the plasma membrane in Raji, HL60, and Jurkat cell lines. These findings were also confirmed by scanning electron microscopy. Our study also shows that this phenomenon does not occur on normal resting or proliferating lymphocytes. In addition, we show that membrane TK1 is found in all oligomeric forms ranging from monomer to tetramer and exhibits enzymatic activity. These findings suggest TK1 as a possible target for immunotherapy with the potential to be utilized in the treatment of hematological cancers.

Keywords: ALL; Burkitt’s lymphoma; acute lymphoblastic leukemia; surface antigen; thymidine kinase 1.


Conflict of interest statement

Disclosure The authors report no conflicts of interest in this work.

Figures

Figure 1
Figure 1
Flow cytometry analysis of Raji cells. Notes: (A) Controls used for flow cytometry analysis of Raji cells. Cells are NK-κB− and CD19+. (B) Histograms and density plots showing a fluorescence intensity shift in Raji cells stained with anti-TK1 antibodies, A72, A74, and CB1. Cells show a significant fluorescent shift when bound to anti-TK1 antibodies. Isotype control and NFκB fluorescent shifts are nonsignificant, suggesting low nonspecific binding and integrity of the cell membrane. (C) Quantification of the percentage of cells showing a positive fluorescent shift. Raji cells show significant fluorescent shift when bound to anti-CD19 and anti-TK1 antibodies when compared to controls. *P≤0.05; **P≤0.01; ***P≤0.001. Abbreviation: FITC, fluorescein isothiocyanate.
Figure 1
Figure 1
Flow cytometry analysis of Raji cells. Notes: (A) Controls used for flow cytometry analysis of Raji cells. Cells are NK-κB− and CD19+. (B) Histograms and density plots showing a fluorescence intensity shift in Raji cells stained with anti-TK1 antibodies, A72, A74, and CB1. Cells show a significant fluorescent shift when bound to anti-TK1 antibodies. Isotype control and NFκB fluorescent shifts are nonsignificant, suggesting low nonspecific binding and integrity of the cell membrane. (C) Quantification of the percentage of cells showing a positive fluorescent shift. Raji cells show significant fluorescent shift when bound to anti-CD19 and anti-TK1 antibodies when compared to controls. *P≤0.05; **P≤0.01; ***P≤0.001. Abbreviation: FITC, fluorescein isothiocyanate.
Figure 2
Figure 2
Flow cytometry analysis of HL60 and Jurkat cells. Notes: The quantification of the percentage of cells showing a positive fluorescent shift when bound to conjugated antibodies. The percentage of HL60 cells that are positive for TK1 (CB1 and commercially available anti-TK1 antibodies) is similar to that of CD45 and Na+K+ ATPase (positive controls) and significantly higher than the isotype control. Similarly, Jurkat cells show a significantly higher percentage of TK1+ cells than isotype controls with both CB1 and commercially available anti-TK1 antibodies. *P≤0.05; **P≤0.01; ***P≤0.001.
Figure 3
Figure 3
Fluorescent microscopy images of viable Raji, Jurkat, and HL60 cells and normal lymphocytes stained with CB1-FITC (anti-TK1 antibody), isotype control, anti-Na+K+ ATPase antibody, and DAPI at 20×. Notes: Hematological cell lines stain positive for TK1 and Na+K+ ATPase. Normal lymphocytes do not stain positive for TK1. All cells are negative for isotype control. We can observe an association of the fluorescence of FITC with the membrane. These images suggest that TK1 associates and localizes on the cell membrane. Abbreviations: DAPI, 4′,6-diamidino-2-phenylindole; FITC, fluorescein isothiocyanate.
Figure 4
Figure 4
Flow cytometry quantification analysis of normal lymphocytes. Notes: (A) Lymphocytes were isolated from whole blood and stained with anti-TK1 antibodies, A72, A74, and CB1, anti-CD45 (positive control), isotype control, and anti-NFκB antibodies. Lymphocytes were also stimulated to proliferate and then stained with anti-TK1 antibodies, A72, A74, and CB1, anti-CD45 (positive control), isotype control, and anti-NFκB antibodies. Normal resting lymphocytes show the absence of TK1 on their surface even under proliferating conditions. (B) Lymphocytes were treated with supraphysiological levels of purified TK1 (0.25 µM, 0.5 µM, and 0.75 µM TK1). Lymphocytes were stained with anti-TK1 antibody (ab91651) and CD52 (positive control). Lymphocytes show nonsignificant amounts of TK1 on their surface, suggesting that extracellular sources of TK1 do not interact with the membrane. ***P≤0.001; ****P≤0.0001; ns= P>0.05, non significant.
Figure 5
Figure 5
SEM of Raji cells. Notes: (A) Cells were stained with anti-biotin gold, anti-NFκB-biotin + anti-biotin gold, and anti-TK1 (A72)-biotin + anti-biotin gold visualized through a GSE detector. White spots represent gold bound to the membrane of the cells. (B) Images were filtered so the white spots (gold) could be shown in red for better visualization. (C) EDAX quantification of gold weight percentages in Raji cells stained with anti-biotin gold, anti-NFκB-biotin + anti-biotin gold, A72-biotin + anti-biotin gold, and a positive control Na+/K+ ATPase-biotin + anti-biotin gold. The amount of gold particles found on the surface of Raji cells when stained with anti-TK1 A72 antibody is significantly higher than background. *P≤0.05; **P≤0.01. Abbreviations: EDAX, energy-dispersive analysis X-ray; GSE, gaseous secondary electron; SEM, scanning electron microscopy.
Figure 6
Figure 6
SEM of normal lymphocytes. Notes: (A) Cells were stained with anti-biotin gold, anti-NFκB-biotin + anti-biotin gold, and anti-TK1 (A72)-biotin + anti-biotin gold visualized through a GSE detector. White spots represent gold bound to the membrane of the cells. (B) Images were filtered so the white spots (gold) could be represented in red for better visualization. No gold can be visualized in these samples. (C) EDAX quantification of gold weight percentages in normal lymphocytes stained with anti-biotin gold, anti-NFκB-biotin + anti-biotin gold, A72-biotin + anti-biotin gold, and a positive control Na+/K+ ATPase-biotin + anti-biotin gold. The amount of gold particles found on the surface of normal lymphocytes when stained with anti-TK1 A72 antibody is the same as the background indicating the absence of TK1 in these cells. ****P≤0.0001. Abbreviations: EDAX, energy-dispersive analysis X-ray; GSE, gaseous secondary electron; SEM, scanning electron microscopy.
Figure 7
Figure 7
Flow cytometry analysis of ALL clinical samples. Notes: (A) Density plots of flow cytometry controls used in the analysis of ALL samples. Cells are CD45+ and HLA-DR+. Controls indicate an insignificant fluorescent shift in cells stained with isotype IgG control and anti-NFκB antibody. Cells appear to shift in fluorescence when bound to anti-TK1 antibody. (B) Quantification of cells shifting toward a greater fluorescence in ALL samples. ALL samples have a significant percentage of cells with a greater fluorescent shift compared to controls. ***P≤0.01. Abbreviations: ALL, acute lymphoblastic leukemia; PI, propidium iodide.
Figure 8
Figure 8
Western blot of membrane and cytosolic fractions in Raji cells and normal lymphocytes and probed with anti-TK1 antibody. Notes: (A) Membrane proteins on viable Raji cell membranes were biotinylated or not (control) and then bound to streptavidin beads. Membrane proteins bound to the beads were eluted and used as samples in a Western blot. Samples were probed against TK1. We observe that TK1 found on Raji cell membranes adopts many oligomeric forms as pointed to by the arrows. (B) Membrane proteins on viable normal lymphocytes were biotinylated or not (control) and then bound to streptavidin beads. Membrane proteins bound to the beads were eluted and used as samples in a Western blot. Samples were probed against TK1. We observe that normal lymphocytes do not show any detectable TK1 on their membrane fraction.
Figure 9
Figure 9
TK1 activity in membrane fractions. Notes: Membrane fractions were isolated from normal lymphocytes, Raji, Jurkat, and HL60 cells and then used as samples in the TK1 radioassay. Normal lymphocytes show minimal TK1 activity. However, Raji, Jurkat, and HL60 membrane fractions show significantly higher TK1 activity than normal lymphocytes. ***P≤0.001; ****P≤0.0001. Abbreviation: CMP, counts per minute.

Similar articles

Cited by

References

    1. Chen Y-L, Eriksson S, Chang Z-F. Regulation and functional contribution of thymidine kinase 1 in repair of DNA damage. J Biol Chem. 2010;285(35):27327–27335. - PMC - PubMed
    1. Sherley JL, Kelly TJ. Regulation of human thymidine kinase during the cell cycle. J Biol Chem. 1988;263(17):8350–8358. - PubMed
    1. Alegre Melissa M, Robison Richard A, O’Neill Kim L. Oncology: Theory & Practice. iConcept Press; 2014. The Clinical Significance and Biology of Thymidine Kinase 1.
    1. Zhou J, He E, Skog S. The proliferation marker thymidine kinase 1 in clinical use. Mol Clin Oncol. 2013;1(1):18–28. - PMC - PubMed
    1. Munch-Petersen B. Reversible tetramerization of human TK1 to the high catalytic efficient form is induced by pyrophosphate, in addition to tripolyphosphates, or high enzyme concentration. FEBS J. 2009;276(2):571–580. - PubMed

LinkOut - more resources