. 2017 May 11;6(8):e1318234.
doi: 10.1080/2162402X.2017.1318234. eCollection 2017.

Cyclophosphamide treatment regulates the balance of functional/exhausted tumor-specific CD8+ T cells

Affiliations

Cyclophosphamide treatment regulates the balance of functional/exhausted tumor-specific CD8+ T cells

Aurélie Hanoteau et al. Oncoimmunology. .

Abstract

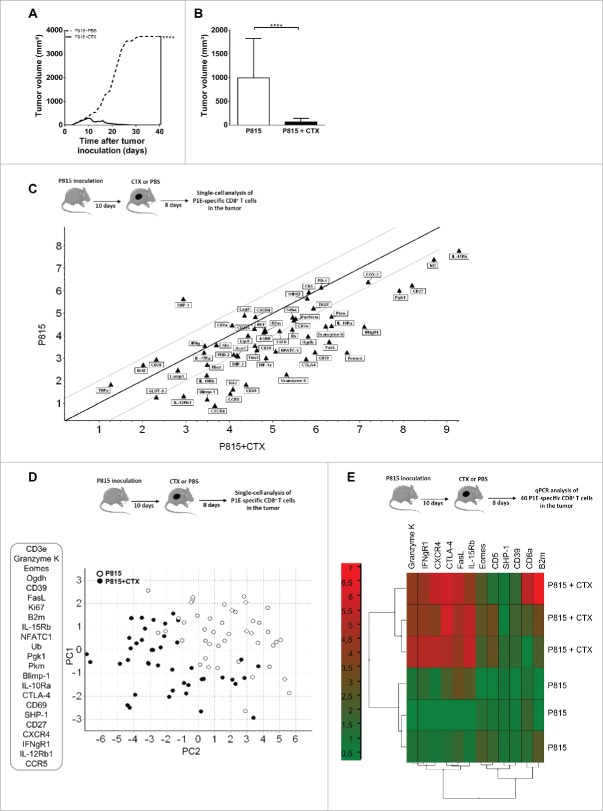
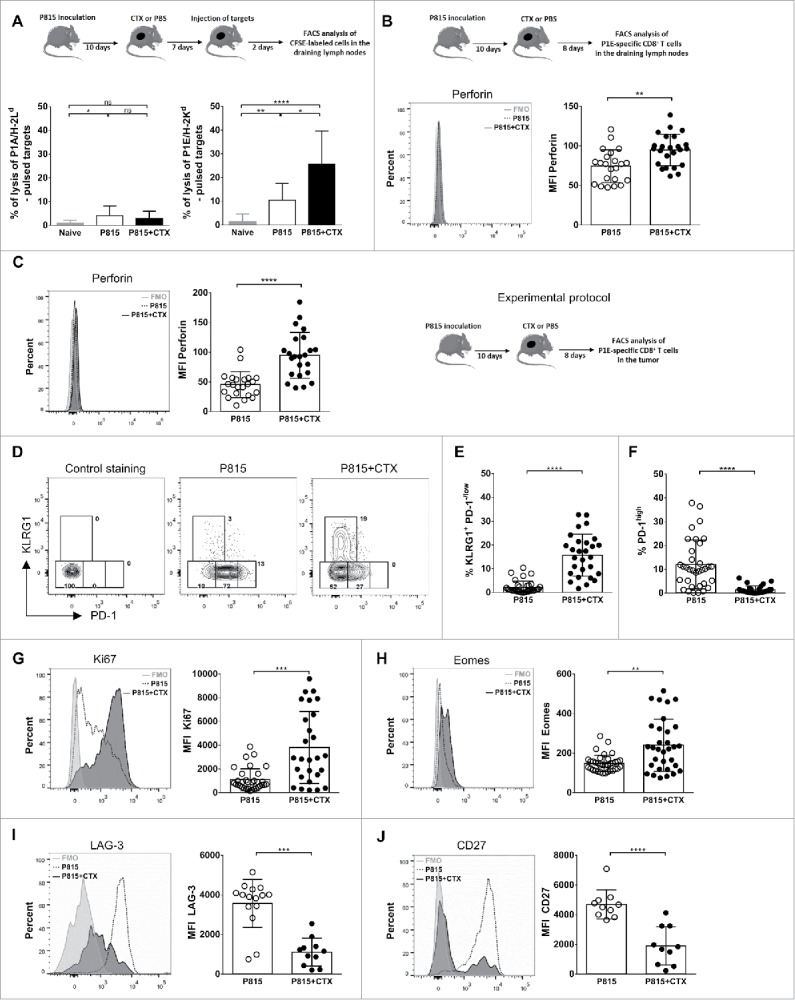
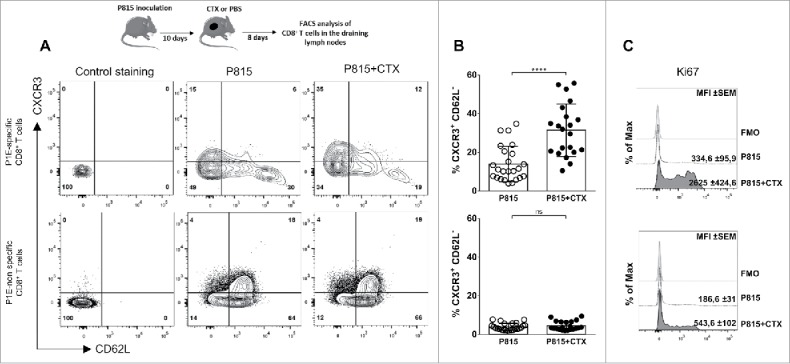
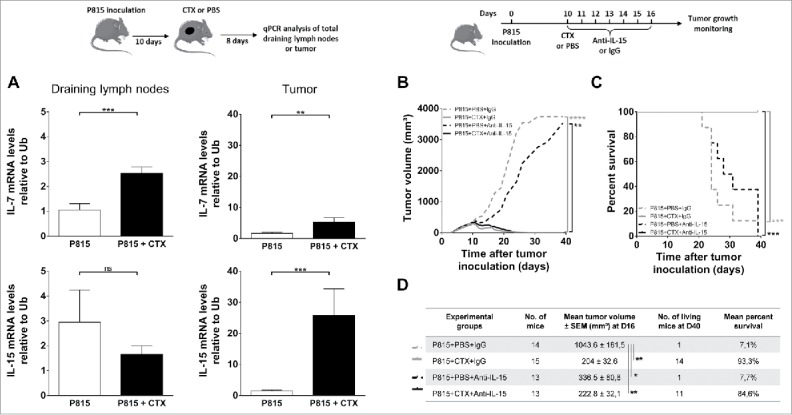
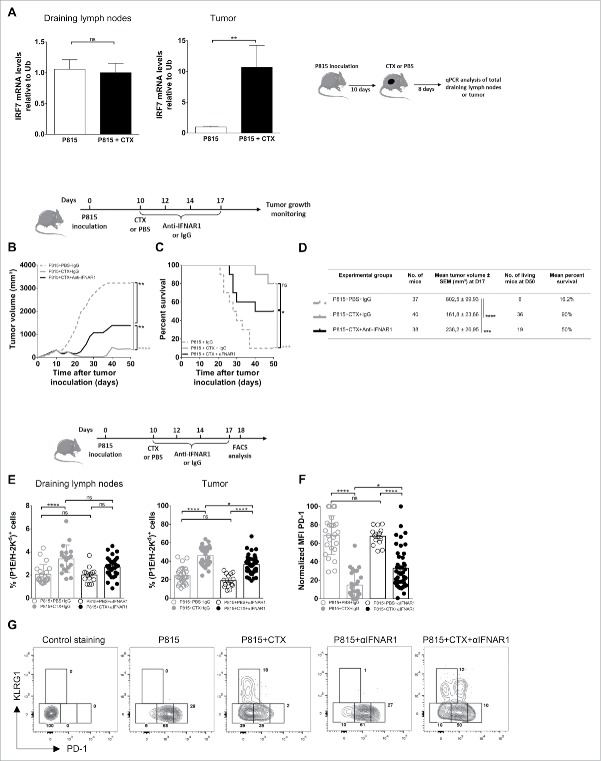
An important question is how chemotherapy may (re-)activate tumor-specific immunity. In this study, we provide a phenotypic, functional and genomic analysis of tumor-specific CD8+ T cells in tumor (P815)-bearing mice, treated or not with cyclophosphamide. Our data show that chemotherapy favors the development of effector-type lymphocytes in tumor bed, characterized by higher KLRG-1 expression, lower PD-1 expression and increased cytotoxicity. This suggests re-engagement of T lymphocytes into the effector program. IFN-I appears involved in this remodeling. Our findings provide some insight into how cyclophosphamide regulates the amplitude and quality of tumor-specific immune responses.

Keywords: CD8+ T cells; cyclophosphamide; effector function; exhaustion; tumor-specific immunity.


Figures

Figure 1.
Figure 1.
Cyclophosphamide treatment favors the emergence of a phenotypically distinct subset of tumor infiltrating, P1E-specific CD8+ T cells. DBA/2 mice were inoculated s.c. with 2 × 10⁶ P815 P1.HTR tumor cells and treated i.p. with CTX (3 mg) or PBS 10 d later. Tumor infiltrating (P1E/H-2Kd)+ CD8+ T cells were single-cell sorted 8 d post-drug treatment and transcriptional profiles determined using a targeted approach. (A) Effect of CTX on tumor growth. Data are representative of four independent experiments with 8–11 mice per group. Statistical significance was determined by the Mann–Whitney test. (B) Mean of tumor volume 8 d after CTX injection. Data display the summary of four independent experiments with 8–11 mice per group. Statistical significance was determined by the Mann–Whitney test. (C) Graph of Scatter Plot correlation obtained with the GenEx qPCR analysis software, showing the expression levels of 56 genes for 90 single cells isolated from 1 CTX-treated mouse (n = 45) and 1 untreated mouse (n = 45). (D) Principal component analysis (PCA) with a selection of 23 genes based on single-cell qPCR data from tumor-infiltrating (P1E/H-2Kd)+ CD8+ T cells. Each symbol represents an individual cell. p = 0.01556. (E) Gene-expression heatmap, obtained after two-way hierarchical clustering using the GenEx qPCR analysis software, showing gene-expression profiles for 40 cells per sample from 3 individual mice per group. *p < 0.05; **p < 0.01; ***p < 0.001; ****p < 0.0001; ns, not significant.
Figure 2.
Figure 2.
Tumor-specific CD8+ T cells acquire features of terminal effector cells following cyclophosphamide treatment. DBA/2 mice were inoculated s.c. with 2 × 10⁶ P815 P1.HTR tumor cells and treated i.p. with CTX (3 mg) or PBS 10 d later. Cells were harvested and analyzed 8 or 9 d after CTX injection. (A) The P1A- and P1E-specific cytotoxic activities were assayed in vivo in draining lymph nodes using CFSE-labeled target cells, pulsed or not with P1A or P1E peptides. Data from six independent experiments with 2–4 mice per group are expressed as percentage of lysis. Statistical significance was determined by the Kruskal–Wallis test. (B, C) Perforin expression on (P1E/H-2Kd)+ CD8+ T cells from (B) draining lymph nodes or (C) tumor. Data are representative of single individuals in each treatment group (left panels) or display the MFI of individual determinations from three independent experiments with 6–9 mice per group (each data point represents one mouse, right panels). Statistical significance was determined by the Mann–Whitney test. (D–F) Representative flow cytometry plots (B) and quantification of KLRG1+ PD-1−/low cells (C) or PD-1high cells (D) among tumor infiltrating (P1E/H-2Kd)+ CD8+ T cells. Data are representative of (B) single individuals in each treatment group or (C, D) the percentage of positive cells for the indicated markers from individual determinations of five independent experiments with 4–8 mice per group (each data point represents one mouse). Statistical significance was determined by the Mann–Whitney test. (G–J) Ki67 (E), Eomes (F), LAG-3 (G) and CD27 (H) expression on tumor infiltrating (P1E/H-2Kd)+ CD8+ T cells. Data are representative of single individuals in each treatment group (left panels) or display the MFI of individual determinations from three to six independent experiments with 3–8 mice per group (each data point represents one mouse, right panels). Statistical significance was determined by the Mann–Whitney test. FMO = full minus one, means that all antibodies were present in the staining cocktail, except those of interest. *p < 0.05; **p < 0.01; ***p < 0.001; ****p < 0.0001; ns, not significant.
Figure 3.
Figure 3.
P1E-specific CD8+ T cells acquire functional properties in the draining lymph nodes following cyclophosphamide treatment. DBA/2 mice were inoculated s.c. with 2 × 10⁶ P815 P1.HTR tumor cells and treated i.p. with CTX (3 mg) or PBS 10 d later. Cells were harvested and analyzed 8 d after CTX injection. Representative flow cytometry plots (A) and quantification of CXCR3+ CD62L cells (B) from draining lymph nodes (P1E/H-2Kd)+ or − CD8+ T cells. (C) Histograms of Ki67 expression on CXCR3+ CD62L cells among (P1E/H-2Kd)+ or − CD8+ T cells. Values indicate mean fluorescence intensity (MFI) and standard error. Data are representative of (A, C) single individuals in each treatment group or (B) display individual determinations from three independent experiments with 6–8 mice per group (each data point represents one mouse). Statistical significance was determined by the unpaired t test. FMO = full minus one, means that all antibodies were present in the staining cocktail, except those of interest. *p < 0.05; **p < 0.01; ***p < 0.001; ****p < 0.0001; ns, not significant.
Figure 4.
Figure 4.
Role of homeostatic cytokines in CTX-induced tumor rejection. DBA/2 mice were inoculated s.c. with 2 × 10⁶ P815 P1.HTR tumor cells and treated i.p. with CTX (1.5 or 3 mg) or PBS 10 d later. Draining lymph nodes and tumor cells were harvested and analyzed 8 d after CTX injection. (A) Relative mRNA levels of IL-7 and IL-15 to Ubiquitin in draining lymph nodes and tumors. Data represent the mean ± SEM from three to five experiments with 2–7 mice per group. Statistical significance was determined by the Mann–Whitney test. (B–D) Effect of IL-15 blockade on tumor growth (B, D) and survival (C, D). 10 d after tumor inoculation, mice were treated i.p. with CTX (1.5 mg) or PBS, and blocking antibodies to IL-15 or rat isotype-matched control Igs (25 µg every other day from day 10 to 16). Data are representative of (B, C) one experiment or (D) display the summary of two independent experiments with 6–9 mice per group. Statistical significance was determined by the Kruskal-Wallis (B, D) or Log-rank tests (C). *p < 0.05; **p < 0.01; ***p < 0.001; ****p < 0.0001; ns, not significant.
Figure 5.
Figure 5.
Role of the cytokinic environment in CTX-induced tumor rejection. DBA/2 mice were inoculated s.c. with 2 × 10⁶ P815 P1.HTR tumor cells and treated i.p. with CTX (1.5 or 3 mg) or PBS 10 d later. Draining lymph nodes and tumor cells were harvested and analyzed 8 d after CTX injection. (A) Relative mRNA levels of IRF7 to Ubiquitin in draining lymph nodes and tumors. Data are from three to four independent experiments with 2–6 mice per group. Statistical significance was determined by the Mann–Whitney test. (B–E) Effect of IFNAR1 blockade on tumor growth (B, D), survival (C, D) and proportion of P1E-specific cells among CD8+ T cells in draining lymph nodes or tumors (E). 10 d after tumor inoculation, mice were treated i.p. with CTX (1.5 mg) or PBS, and with blocking antibodies to IFNAR1 or rat isotype-matched control Igs (500 µg at day 10, followed by 250 µg at days 12, 14 and 17). 8 d after the beginning of the treatment, the frequencies of (P1E/H-2Kd)+ cells were analyzed ex vivo by flow cytometry (E). Data are representative of (B, C) one experiment or (D, E) display the summary of 3–5 independent experiments with 3–13 mice per group. Statistical significance was determined by the Kruskal–Wallis (B, D, E) or Log-rank tests (C). (F) Normalized PD-1 expression on tumor infiltrating (P1E/H-2Kd)+ CD8+ T cells. Data are representative of five independent experiments with 3–13 mice per group. Statistical significance was determined by the Kruskal–Wallis test. MFI is expressed as arbitrary units normalized for each experiment and arbitrarily set at 100. (G) Representative flow cytometry plots showing KLRG1 vs. PD-1 expression by tumor infiltrating (P1E/H-2Kd)+ CD8+ T cells (two independent experiments with 6–13 mice per group). *p < 0.05; **p < 0.01; ***p < 0.001; ****p < 0.0001; ns, not significant.

References

    1. Abu Eid R, Razavi GSE, Mkrtichyan M, Janik J, Khleif SN. Old-school chemotherapy in immunotherapeutic combination in cancer, a low-cost drug repurposed. Cancer Immunol Res 2016; 4:377-82; PMID:27196429; https://doi.org/10.1158/2326-6066.CIR-16-0048 - DOI - PubMed
    1. Suzuki E, Sun J, Kapoor V, Jassar AS, Albelda SM. Gemcitabine has significant immunomodulatory activity in murine tumor models independent of its cytotoxic effects. Cancer Biol Ther 2007; 6:880-5; PMID:17582217; https://doi.org/10.4161/cbt.6.6.4090 - DOI - PubMed
    1. Denkert C, Loibl S, Noske A, Roller M, Muller BM, Komor M, Budczies J, Darb-Esfahani S, Kronenwett R, Hanusch C et al.. Tumor-associated lymphocytes as an independent predictor of response to neoadjuvant chemotherapy in breast cancer. J Clin Oncol 2010; 28:105-13; PMID:19917869; https://doi.org/10.1200/JCO.2009.23.7370 - DOI - PubMed
    1. Fridman WH, Galon J, Pagès F, Tartour E, Sautès-Fridman C, Kroemer G. Prognostic and predictive impact of intra- and peritumoral immune infiltrates. Cancer Res 2011; 71:5601-5; PMID:21846822; https://doi.org/10.1158/0008-5472.CAN-11-1316 - DOI - PubMed
    1. Galluzzi L, Buqué A, Kepp O, Zitvogel L, Kroemer G. Immunological effects of conventional chemotherapy and targeted anticancer agents. Cancer Cell 2015; 28:690-714; PMID:26678337; https://doi.org/10.1016/j.ccell.2015.10.012 - DOI - PubMed

Publication types

LinkOut - more resources