

Zoledronic acid inhibits NFAT and IL-2 signaling pathways in regulatory T cells and diminishes their suppressive function in patients with metastatic cancer
- PMID: 28920001
- PMCID: PMC5593706
- DOI: 10.1080/2162402X.2017.1338238
Zoledronic acid inhibits NFAT and IL-2 signaling pathways in regulatory T cells and diminishes their suppressive function in patients with metastatic cancer
Abstract
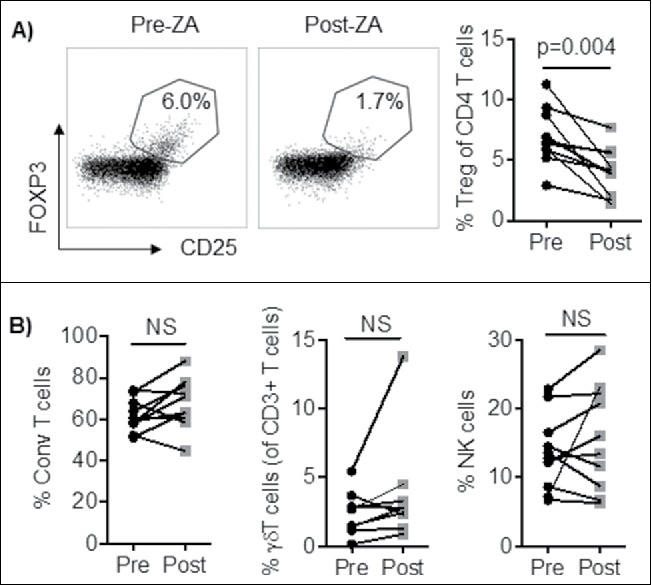
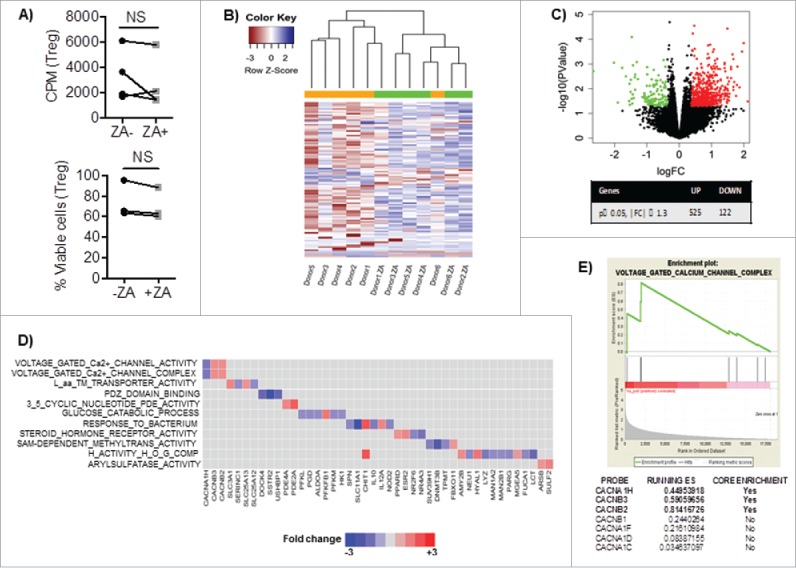
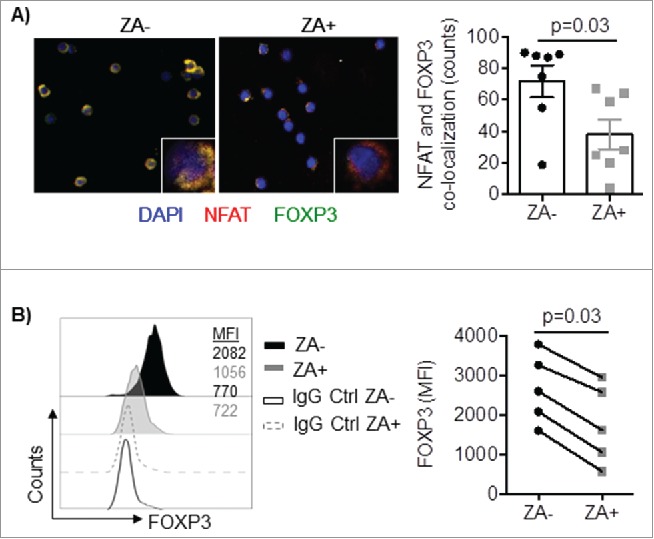
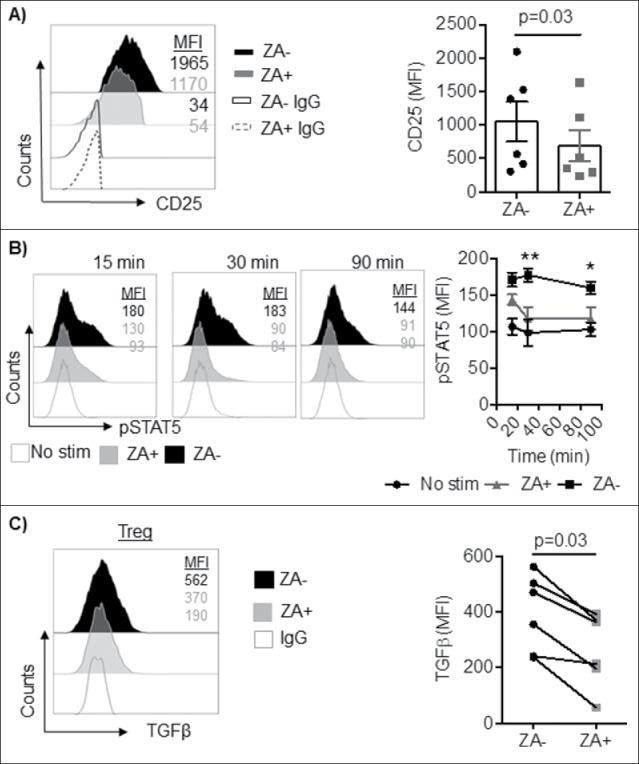
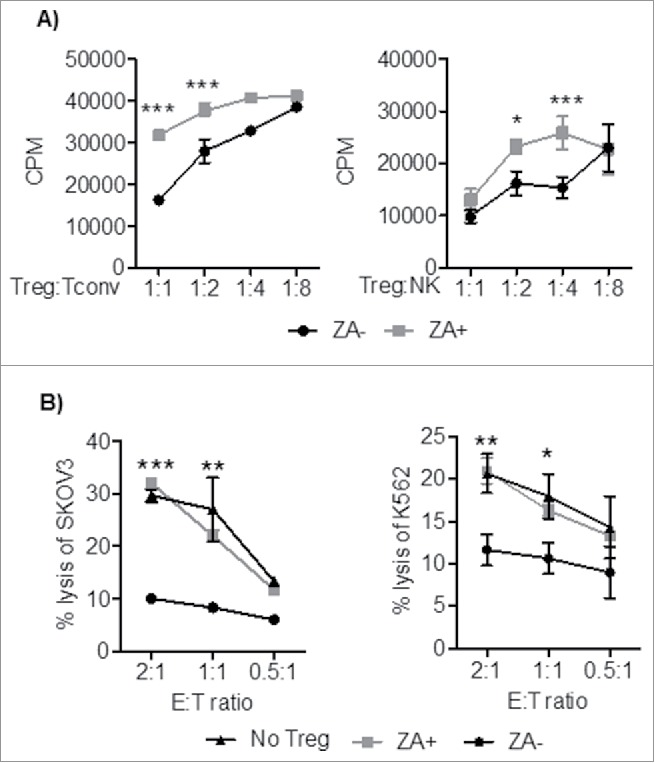
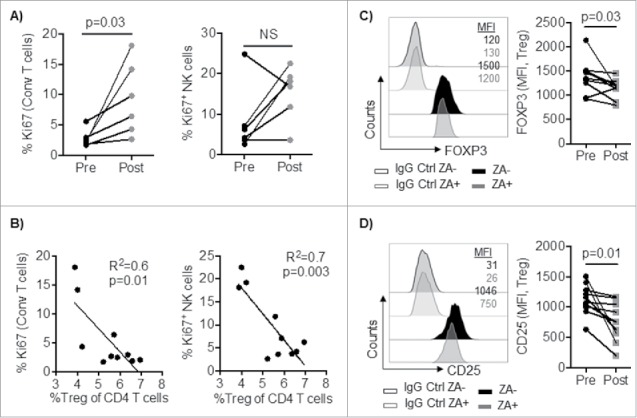
Regulatory T cells (Treg) suppress anti-tumor immune responses and their infiltration in the tumor microenvironment is associated with inferior prognosis in cancer patients. Thus, in order to enhance anti-tumor immune responses, selective depletion of Treg is highly desired. We found that treatment with zoledronic acid (ZA) resulted in a selective decrease in the frequency of Treg that was associated with a significant increase in proliferation of T cells and natural killer (NK) cells in peripheral blood of patients with metastatic cancer. In vitro, genome-wide transcriptomic analysis revealed alterations in calcium signaling pathways in Treg following treatment with ZA. Furthermore, co-localization of the nuclear factor of activated T cells (NFAT) and forkhead box P3 (FOXP3) was significantly reduced in Treg upon ZA-treatment. Consequently, reduced expression levels of CD25, STAT5 and TGFβ were observed. Functionally, ZA-treated Treg had reduced capacity to suppress T and NK cell proliferation and anti-tumor responses compared with untreated Treg in vitro. Treatment with ZA to selectively inhibit essential signaling pathways in Treg resulting in reduced capacity to suppress effector T and NK cell responses represents a novel approach to inhibit Treg activity in patients with cancer.
Keywords: Ca2+/calcineurin/NFAT pathway; NK and T cell function; Zoledronic acid; cancer patients; regulatory T cells.
Figures
Similar articles
-
Immune modulation of CD4+CD25+ regulatory T cells by zoledronic acid.BMC Immunol. 2016 Nov 25;17(1):45. doi: 10.1186/s12865-016-0183-7. BMC Immunol. 2016. PMID: 27887569 Free PMC article.
-
Rubiginosin B selectively inhibits Treg cell differentiation and enhances anti-tumor immune responses by targeting calcineurin-NFAT signaling pathway.Phytomedicine. 2023 Jul 25;116:154898. doi: 10.1016/j.phymed.2023.154898. Epub 2023 May 23. Phytomedicine. 2023. PMID: 37247590
-
CCL11 increases the proportion of CD4+CD25+Foxp3+ Treg cells and the production of IL‑2 and TGF‑β by CD4+ T cells via the STAT5 signaling pathway.Mol Med Rep. 2020 Jun;21(6):2522-2532. doi: 10.3892/mmr.2020.11049. Epub 2020 Apr 1. Mol Med Rep. 2020. PMID: 32323817 Free PMC article.
-
Thymic commitment of regulatory T cells is a pathway of TCR-dependent selection that isolates repertoires undergoing positive or negative selection.Curr Top Microbiol Immunol. 2005;293:43-71. doi: 10.1007/3-540-27702-1_3. Curr Top Microbiol Immunol. 2005. PMID: 15981475 Review.
-
B cell regulation of the anti-tumor response and role in carcinogenesis.J Immunother Cancer. 2016 Jul 19;4:40. doi: 10.1186/s40425-016-0145-x. eCollection 2016. J Immunother Cancer. 2016. PMID: 27437104 Free PMC article. Review.
Cited by
-
Osteoimmuno-Oncology: Therapeutic Opportunities for Targeting Immune Cells in Bone Metastasis.Cells. 2021 Jun 17;10(6):1529. doi: 10.3390/cells10061529. Cells. 2021. PMID: 34204474 Free PMC article. Review.
-
Regulatory T cells in tumor microenvironment: new mechanisms, potential therapeutic strategies and future prospects.Mol Cancer. 2020 Jul 17;19(1):116. doi: 10.1186/s12943-020-01234-1. Mol Cancer. 2020. PMID: 32680511 Free PMC article. Review.
-
Protein serine/threonine phosphatases in tumor microenvironment: a vital player and a promising therapeutic target.Theranostics. 2025 Jan 1;15(3):1164-1184. doi: 10.7150/thno.104529. eCollection 2025. Theranostics. 2025. PMID: 39776803 Free PMC article. Review.
-
Adjunctive Zoledronate + IL-2 administrations enhance anti-tuberculosis Vγ2Vδ2 T-effector populations, and improve treatment outcome of multidrug-resistant tuberculosis1.Emerg Microbes Infect. 2022 Dec;11(1):1790-1805. doi: 10.1080/22221751.2022.2095930. Emerg Microbes Infect. 2022. PMID: 35765887 Free PMC article.
-
Reduced Expression of Natural Killer Cell-Related Activating Receptors by Peripheral Blood Mononuclear Cells from Patients with Breast Cancer and Their Improvement by Zoledronic Acid.Asian Pac J Cancer Prev. 2022 May 1;23(5):1661-1669. doi: 10.31557/APJCP.2022.23.5.1661. Asian Pac J Cancer Prev. 2022. PMID: 35633551 Free PMC article.
References
-
- Mougiakakos D, Choudhury A, Lladser A, Kiessling R, Johansson CC. Regulatory T cells in cancer. Adv Cancer Res 2010; 107:57-117; PMID:20399961; https://doi.org/10.1016/S0065-230X(10)07003-X - DOI - PubMed
-
- Marvel D, Gabrilovich DI. Myeloid-derived suppressor cells in the tumor microenvironment: Expect the unexpected. J Clin Invest 2015; 125:3356-64; PMID:26168215; https://doi.org/10.1172/JCI80005 - DOI - PMC - PubMed
-
- Beyer M, Schultze JL. Regulatory T cells in cancer. Blood 2006; 108:804-11; PMID:16861339; https://doi.org/10.1182/blood-2006-02-002774 - DOI - PubMed
-
- Sun S, Fei X, Mao Y, Wang X, Garfield DH, Huang O, Wang J, Yuan F, Sun L, Yu Q, et al.. PD-1(+) immune cell infiltration inversely correlates with survival of operable breast cancer patients. Cancer Immunol Immunother 2014; 63:395-406; PMID:24514954; https://doi.org/10.1007/s00262-014-1519-x - DOI - PMC - PubMed
-
- Idorn M, Kollgaard T, Kongsted P, Sengelov L, Thor Straten P. Correlation between frequencies of blood monocytic myeloid-derived suppressor cells, regulatory T cells and negative prognostic markers in patients with castration-resistant metastatic prostate cancer. Cancer Immunol Immunother 2014; 63:1177-87; PMID:25085000; https://doi.org/10.1007/s00262-014-1591-2 - DOI - PMC - PubMed
Publication types
LinkOut - more resources
Full Text Sources
Other Literature Sources
Molecular Biology Databases
Miscellaneous