. 2017 Aug 28;2(4):398-414.
doi: 10.1016/j.jacbts.2017.03.014. eCollection 2017 Aug.

The IL-1RI Co-Receptor TILRR (FREM1 Isoform 2) Controls Aberrant Inflammatory Responses and Development of Vascular Disease

Affiliations

The IL-1RI Co-Receptor TILRR (FREM1 Isoform 2) Controls Aberrant Inflammatory Responses and Development of Vascular Disease

Sarah A Smith et al. JACC Basic Transl Sci. .

Abstract

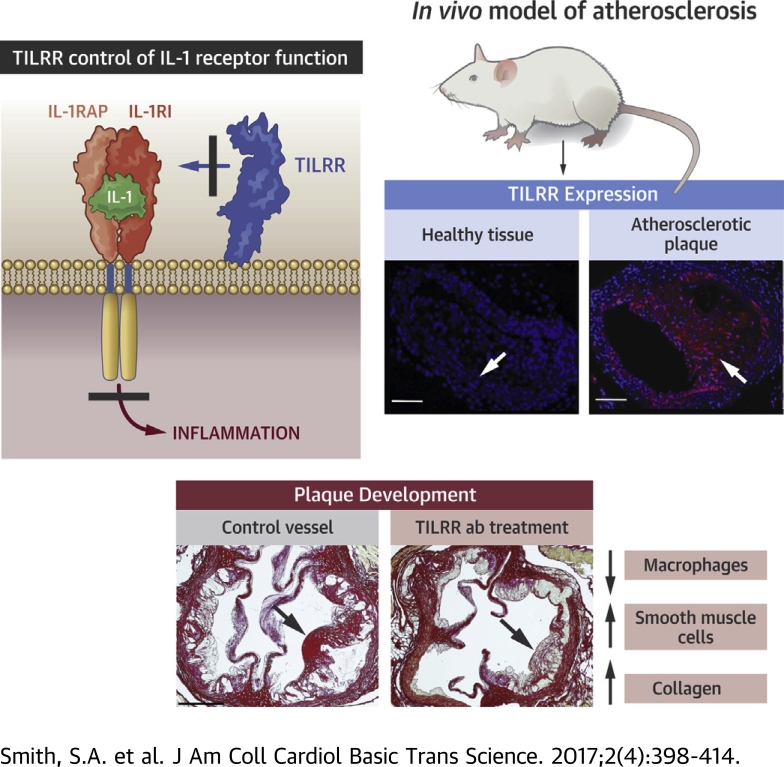
Expression of the interleukin-1 receptor type I (IL-1RI) co-receptor Toll-like and interleukin-1 receptor regulator (TILRR) is significantly increased in blood monocytes following myocardial infarction and in the atherosclerotic plaque, whereas levels in healthy tissue are low. TILRR association with IL-1RI at these sites causes aberrant activation of inflammatory genes, which underlie progression of cardiovascular disease. The authors show that genetic deletion of TILRR or antibody blocking of TILRR function reduces development of atherosclerotic plaques. Lesions exhibit decreased levels of monocytes, with increases in collagen and smooth muscle cells, characteristic features of stable plaques. The results suggest that TILRR may constitute a rational target for site- and signal-specific inhibition of vascular disease.

Keywords: ApoE, apolipoprotein E; DK, double knockout; GAPDH, glyceraldehyde 3-phosphate dehydrogenase; IL, interleukin; IL-1RI; IL-1RI, interleukin-1 receptor type I; IgG, immunoglobulin G; IκBα, inhibitor kappa B alpha; KO, knockout; LDLR–/–, low-density lipoprotein receptor–/–; LPS, lipopolysaccharide; NF-κB; NF-κB, nuclear factor-kappa B; NSTEMI, non–ST-segment elevation myocardial infarction; PBS, phosphate-buffered saline; PCR, polymerase chain reaction; SDS, sodium dodecyl sulfate; STEMI, ST-segment elevation myocardial infarction; TILRR; TILRR, toll-like and interleukin-1 receptor regulator; heparan sulfate proteoglycan; iBALT, inducible bronchus-associated lymphoid tissue; interleukin-1 receptor; qPCR, quantitative polymerase chain reaction.


Figures

None
Graphical abstract
Figure 1
Figure 1
TILRR Controls IL-1RI Levels, Signal Amplification, and Gene Activity (A) Quantitative polymerase chain reaction (qPCR) of TILRR expression in raw cells, stimulated with lipopolysaccharide (LPS) (6 h) over a range of concentrations, as indicated. Data are expressed relative to levels of glyceraldehyde 3-phosphate dehydrogenase (GAPDH) and show mean ± SEM. n = 3.0 μg/ml LPS versus 0.1μg/ml LPS; 0 μg/ml LPS versus 1 μg/ml LPS, **p < 0.01. (B) qPCR of Toll-like and interleukin-1 receptor regulator (TILRR) expression in M1- and M2-like macrophages and undifferentiated cultures (control). Data are expressed relative to levels of GAPDH and show mean ± SEM. n = 3, **p < 0.01,***p < 0.001. (C) Fluorescence-activated cell sorting analysis of inflammatory monocytes from wild-type (WT) and TILRR knockout (KO) mice injected with LPS (10 mg/kg). Data are expressed as percent of total monocyte levels and show mean ± SEM. n = 6 WT, n = 9 TILRR KO. Levels in TILRR KO mice versus levels in WT mice, **p < 0.0088. (D) Western blots of interleukin-1 receptor type I (IL-1RI), tumor necrosis factor receptor (TNFR), Toll-like receptor 4 (TLR4), and Toll-like receptor 2 (TLR2) expressions in spleen from WT and TILRR KO mice. (E) Quantitation of Western blots as in D showing receptor levels in TILRR KO cells relative to levels in WT cells, using to β-actin as loading control. The graph shows mean ± SEM, n = cells from 4 to 6 WT mice and 4 to 6 TILRR KO mice for each receptor. Levels of IL-1RI, TNFR, TLR4, and TLR2 in TILRR KO mice are expressed as percent of levels of the respective receptor in WT mice, IL-1RI expression in TILRR KO mice versus IL-1RI expression in WT mice. ****p < 0.0001. (F) Western blot analysis of interleukin (IL)-1–induced (10−9 M) inhibitor kappa B alpha (IκBα) degradation in bone marrow–derived macrophages from WT and TILRR KO mice. (G) Quantitation of Western blots as in F showing IL-1–induced IκBα degradation in WT (circles) and TILRR KO (squares) cells. Data are expressed as percent of IκBα levels in unstimulated WT and TILRR knockout cells, respectively (time 0) and show mean ± SEM. n = peripheral blood mononuclear cells from 4 WT mice and 4 TILRR KO mice. Levels in TILRR KO cells versus levels in WT cells at 30 min. *p = 0.0124. (H) qPCR of bone marrow–derived macrophages from TILRR KO mice shows reductions in chemokine ligand 2 (CCL2) and C-X3-C motif chemokine ligand 1 (CX3CL1). Data are expressed as percent activation of the respective gene in cells from WT mice and show mean ± SEM. n = cells from 4 TILRR KO mice and 4 WT mice. CCL2 expression in TILRR KO cells versus expression in WT cells, **p = 0.0022; CX3CL1 expression in TILRR KO cells versus expression in WT cells, *p = 0.0482. (I) qPCR of spleen samples from TILRR KO mice shows reductions in proinflammatory cytokines tumor necrosis factor (TNF)-α and IL-6. Data are expressed as percent activation of the respective gene in spleen samples from WT mice, and show mean ± SEM. n = 5 WT and 5 TILRR KO mice. TNF-α expression in TILRR KO cells versus expression in WT cells, ***p = 0.0009. IL-6 expression in TILRR KO cells versus expression in WT cells, *p = 0.0236.
Figure 2
Figure 2
Response to Injury Is Significantly Reduced in the TILRR-Knockout Mouse (A) Immunohistochemistry of a cross-section of a carotid artery in a WT mouse subjected to 4 weeks of ligation. Staining using a nonblocking anti-TILRR antibody followed by a DyLight Fluor-conjugated secondary antibody shows high levels of TILRR expression (red). Scale bar = 150 μm. Trichrome staining of cross-sections of carotid arteries after 4 weeks of ligation in (B) a WT mouse and (C) a TILRR KO mouse. Arrows indicate thickness of the neointima in response to treatment. Scale bar = 150 μm. (D to F) Quantitation of measurements from cross sections as in B and C shows (D, E) a significant reduction in the thickness of the neointima and (F) a decrease in cell number in the adventitia in TILRR KO mice compared with levels in WT mice. Data are expressed as (D, E) area (μm2) and (F) cell number per μm2 and show mean ± SEM. n = 6 WT mice, 7 TILRR KO mice. TILRR KO mice versus WT mice, (D) *p = 0.038, (E) **p = 0.0045, (F) **p = 0.0014. Abbreviations as in Figure 1.
Figure 3
Figure 3
TILRR KO Significantly Reduces Progression of Atherosclerosis in LDLR–/– TILRR–/– (DK) Mice (A) TILRR expression levels in blood samples from patients with myocardial infarction (ST-segment elevation myocardial infarction [STEMI], light gray bar; non–ST-segment elevation myocardial infarction [NSTEMI], dark gray bar) at diagnosis, day 1, and at days 7 and 90. Values are mean ± SEM. n = 6 to 11 triplicate samples per group and time point. TILRR expression levels in each group of patient samples are compared with levels in healthy control samples (black bar). STEMI day 7, *p = 0.0442; day 90, *p = 0.0329. NSTEMI day 7, *p = 0.0445; day 90, *p = 0.0405. (B) Immunohistochemistry of an atherosclerotic plaque in the brachiocephalic artery, using a nonblocking anti-TILRR antibody, followed by a DyLight Fluor-conjugated secondary antibody, shows increased levels of TILRR expression within the lesion (top image, blue arrow), with low levels in the surrounding area (top image, white arrow) and in a healthy vessel (bottom image, white arrow). TILRR (red), nuclear stain (4'6,-diamidino-2-phenylindole, blue). Scale bar =150 μm. (C) Cross-sections of the aortic root (top) and brachiocephalic arteries (bottom) of LDLR–/– mice (control, left) and LDLR–/–/TILRR–/– mice (double knockout [DK], right), stained with Alcian blue & van Gieson. Scale bar = 500 μm (aortic root), 200 μm (brachiocephalic artery). Arrowheads point at plaques in arteries from control mice. (D, E) Quantitation, using images such as in C, shows levels of atherosclerotic plaques in (D) the brachiocephalic artery and (E) the descending aorta in DK mice and control mice. Data are expressed as percent of total area and show mean ± SEM. (D) n = 12 control mice, 15 DK mice. (E) n = 6 control mice, 9 DK mice. Levels in DK mice versus levels in control mice, (D) *p = 0.0396; (E) **p = 0.004. (F) Quantitation of collagen content following staining of sections using Martius scarlet blue. Data are expressed as percent area stained for collagen in control and DK mice and show mean ± SEM. n = 6 control mice, 6 DK mice. Levels in DK mice versus levels in control mice, ***p = 0.0004. (G) Quantitation of macrophage levels in plaques from control and DK mice following staining of sections using anti-Mac-3. Data are expressed as percent stained area and show mean ± SEM. n = 5 control, 5 DK mice. Levels in DK mice versus levels in control mice, **p = 0.003. Abbreviations as in Figure 1.
Figure 4
Figure 4
Administration of a Peptide Antibody Targeting the TILRR Functional Site Reduces Development of Atherosclerosis (A) Fluorescence-activated cell sorting analysis of GR1+ and GR1 blood monocytes as described in the Methods from apolipoprotein E–deficient (ApoE–/–) mice on a high-fat diet (control, top) and littermates injected with a blocking anti-TILRR peptide antibody 2 times/week for 12 weeks (bottom). (B, C) Quantitation of data from experiments such as in A shows (B) high levels of GR1+ monocytes in samples from control animals (black bar) and reduced levels in TILRR antibody–injected mice (light gray bar) and (C) low levels of unactivated GR1 monocytes in control mice (black bar) and high levels in samples from TILRR antibody-injected mice (light gray bar), with no change in total levels. Data show (B) GR1+ and (C) GR1 monocytes expressed as percent of total. Values are mean ± SEM. n = 5 control mice (black bar), 5 TILRR antibody–injected mice (light gray bar). Levels in antibody-injected mice versus levels in control mice, (B) **p = 0.0065; (C) **p = 0.0064. (D) Collagen-stained sections of aortic root (top) and brachiocephalic artery (bottom) from control ApoE–/– mice (left, arrowhead shows fibrous cap) or TILRR antibody–injected mice (right). Scale bar =200 μm. (E, F) Morphometry of (E) plaque area and (F) and collagen content in the brachiocephalic artery in control (black bar) and TILRR antibody–injected (light gray bar) mice. Data are expressed as (E) plaque area × 10−3 and (F) percent area of total, and show mean ± SEM. n = 9/6 control mice, 8/6 TILRR antibody–injected mice. Levels in antibody-injected mice versus levels in control mice, (E) *p = 0.0434; (F) *p = 0.029. (G) Sections of brachiocephalic arteries as in panel D were stained using an anti–smooth muscle cell (SMC) α-actin antibody (green) and nuclear staining (DAPI, blue). Scale bar = 50 μm. (H, I) Quantitation of smooth muscle cell content in the (H) media and (I) plaques in sections as in panel (G). Data show stained area expressed as percent of total and represent mean ± SEM. n = 7 control mice (black bar), n = 5 TILRR antibody–injected mice (light gray bar), for each graph. Levels in antibody-injected mice versus levels in control mice, (H) *p = 0.0414; (I) *p = 0.0459. (J) Sections of brachiocephalic artery from control (left) and TILRR antibody treated mice (right) stained for Mac3 (macrophage marker, green). Scale bar =150 μm. (K) Quantitation of macrophage content in sections of the brachiocephalic artery as in J. Data show stained area expressed as percent of total and represent mean ± SEM. n = 8 control mice (black bar), 6 TILRR antibody–injected mice (light gray bar). Levels in antibody-injected mice versus levels in control mice, *p = 0.0214. Gr-1 = Myeloid differentiation antigen of the Ly-6 family, (Ly-6G/Ly-6C; TILRR = Toll-like and interleukin 1 receptor regulator.
Figure 5
Figure 5
TILRR Antibody Administration Reduces Inflammatory Responses in the Lung (A) Macrophages in lung sections from ApoE–/– mice fed a high-fat diet (left, Mac-3 green) and inducible bronchus-associated lymphoid tissue (iBALT) structures (inset) show high TILRR expression (right, red). Scale bar = 150 μm. (B) Quantitation of macrophages from images as in A. Data are expressed as number of macrophages per 0.15 mm2 and show mean ± SEM. n = 9 control mice (black bar), 7 TILRR antibody–injected mice (light gray bar). Levels in antibody-injected mice versus levels in control mice, ***p = 0.001. (C) Trichrome staining of lung sections from ApoE–/– mice from control (left) and mice injected with the anti-TILRR peptide antibody (right). Scale bar =150 μm. (D) Fibrous grade, (Ralf-Harto Hübner scale) in control (black bar) and TILRR antibody–injected (light gray bar) mice. Data show mean ± SEM, n = 9 control, n = 7 TILRR antibody–injected mice. Levels in antibody-injected mice versus levels in control mice, *p = 0.0472. (E) Granulomas (arrow) and iBALT (arrowhead) in lung tissue from an ApoE–/– mouse. Scale bar =150 μm. (F, G) Quantitation of sections as in panel E shows (F) levels of granulomas and (G) iBALT structures in control mice (black bar) and TILRR antibody–injected mice (light gray bar). Data are expressed as number of structures per cross-sectional area, as indicated. n 9 control mice, 7 antibody-injected mice. Levels in antibody-injected mice versus levels in control mice, (F) *p = 0.0263; (G) *p = 0.0452. (H) Lung section from a control animal with muscularized vessels with TILRR expression in surrounding tissue (top; TILRR, red; SMC α-actin, green; DAPI, blue). Trichrome staining (bottom). Scale bar = 75 μm. (I) Muscularized vessels in a control (top image) and in a TILRR antibody–treated mouse (bottom image). Scale bar = 75 μm. (J) Morphometry of medial area in vessels from control (black bar) and antibody-injected mice (light gray bar). Values are mean ± SEM. n = 7 control, n = 7 TILRR antibody–injected mice. Levels in antibody-injected mice versus levels in control mice, *p = 0.0152. Abbreviations as in Figures 1 and 4.

Similar articles

Cited by

References

    1. Gay N.J., Ganloff M. Structure and function of Toll-like receptors and their ligands. Annu Rev Biochem. 2007;76:141–165. - PubMed
    1. Michel T., Reichhart J.M., Hoffmann J.A., Royet J. Drosophila Toll is activated by gram-positive bacteria through a circulating peptideglycan recognition protein. Nature. 2001;414:756–759. - PubMed
    1. Beutler B. Inferences, questions and possibilities in toll-like receptor signalling. Nature. 2004;430:257–263. - PubMed
    1. O'Neill L.A.J., Golenbock D., Bowie A.G. The history of Toll-like receptors - redefining innate immunity. Nat Rev Immunol. 2013;13:453–460. - PubMed
    1. Kirkbride K.C., Ray B.N., Blobe G.C. Cell-surface co-receptors: emerging roles in signaling and human disease. Trends Biochem Sci. 2005;30:611–621. - PubMed