

ClotChip: A Microfluidic Dielectric Sensor for Point-of-Care Assessment of Hemostasis
- PMID: 28920906
- PMCID: PMC6091230
- DOI: 10.1109/TBCAS.2017.2739724
ClotChip: A Microfluidic Dielectric Sensor for Point-of-Care Assessment of Hemostasis
Abstract
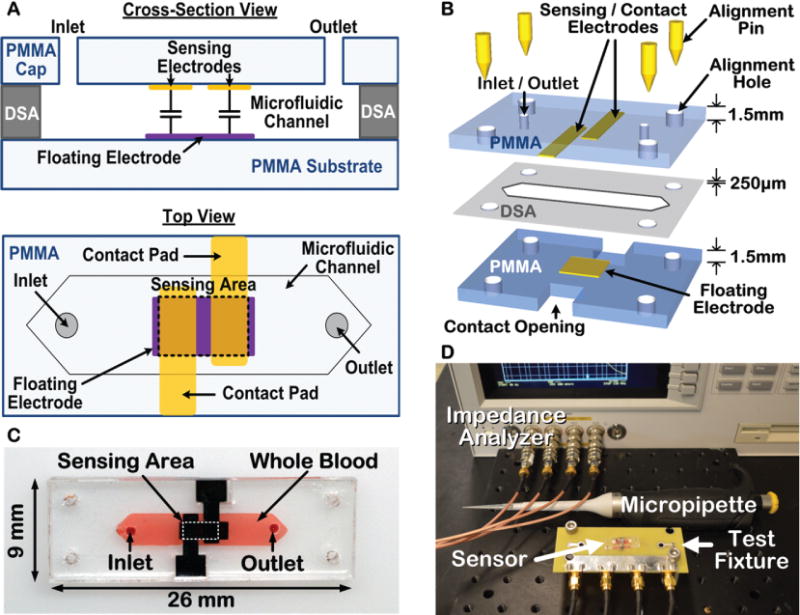
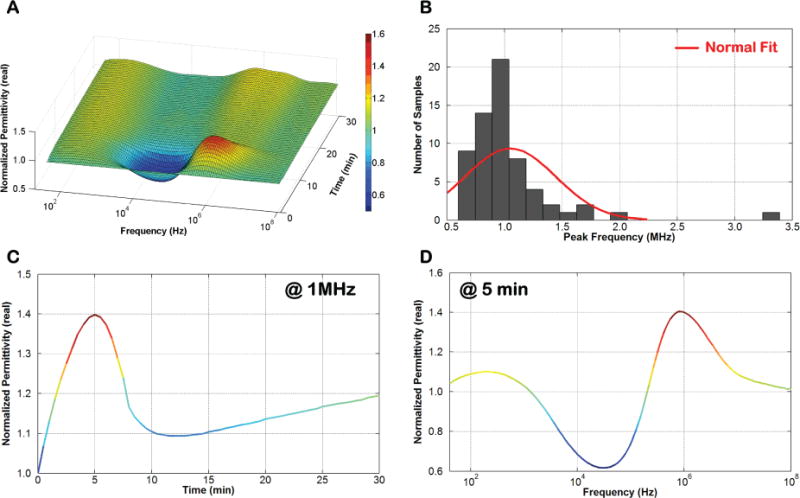
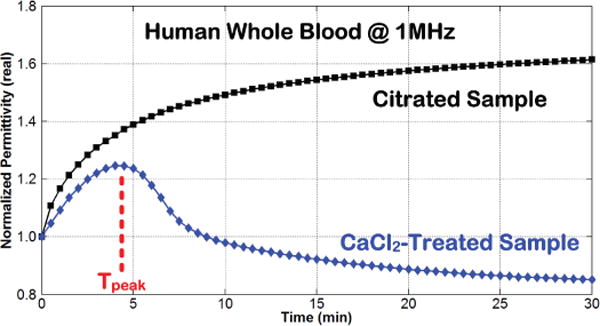
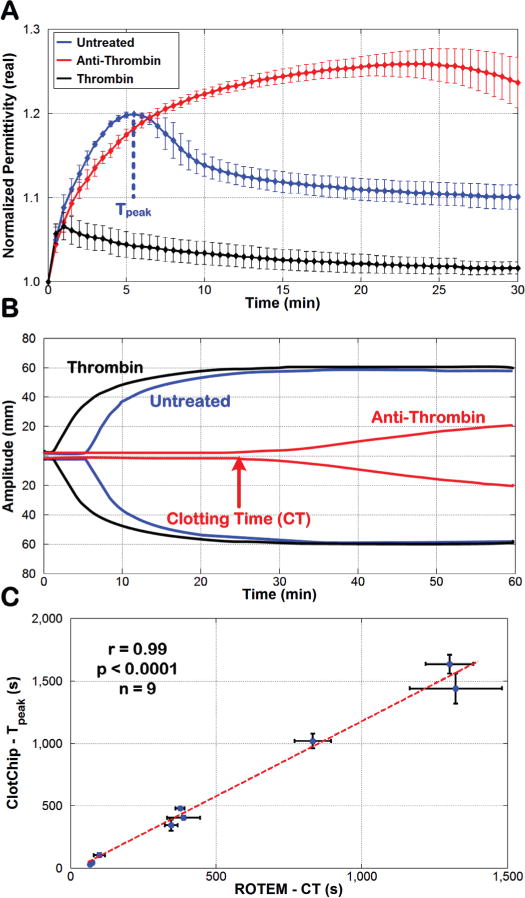
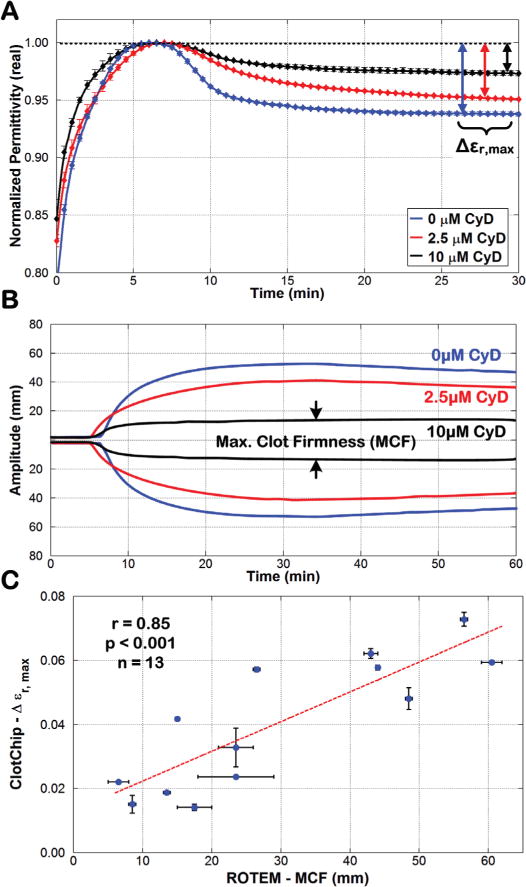
This paper describes the design, fabrication, and testing of a microfluidic sensor for dielectric spectroscopy of human whole blood during coagulation. The sensor, termed ClotChip, employs a three-dimensional, parallel-plate, capacitive sensing structure with a floating electrode integrated into a microfluidic channel. Interfaced with an impedance analyzer, the ClotChip measures the complex relative dielectric permittivity, ϵr , of human whole blood in the frequency range of 40 Hz to 100 MHz. The temporal variation in the real part of the blood dielectric permittivity at 1 MHz features a time to reach a permittivity peak, , as well as a maximum change in permittivity after the peak, , as two distinct parameters of ClotChip readout. The ClotChip performance was benchmarked against rotational thromboelastometry (ROTEM) to evaluate the clinical utility of its readout parameters in capturing the clotting dynamics arising from coagulation factors and platelet activity. exhibited a very strong positive correlation ( r = 0.99, p < 0.0001) with the ROTEM clotting time parameter, whereas exhibited a strong positive correlation (r = 0.85, p < 0.001) with the ROTEM maximum clot firmness parameter. This paper demonstrates the ClotChip potential as a point-of-care platform to assess the complete hemostatic process using <10 μL of human whole blood.
Conflict of interest statement
Conflict Of Interests Disclosure
Debnath Maji, Michael Suster, Umut Gurkan, Evi Stavrou, and Pedram Mohseni are inventors of intellectual property related to the ClotChip that has been licensed by Case Western Reserve University to XaTek, Inc., Cleveland, OH.
Figures
Similar articles
-
Assessment of whole blood coagulation with a microfluidic dielectric sensor.J Thromb Haemost. 2018 Oct;16(10):2050-2056. doi: 10.1111/jth.14244. Epub 2018 Sep 25. J Thromb Haemost. 2018. PMID: 30007048 Free PMC article.
-
Assessment of fibrinolytic status in whole blood using a dielectric coagulometry microsensor.Biosens Bioelectron. 2022 Aug 15;210:114299. doi: 10.1016/j.bios.2022.114299. Epub 2022 Apr 26. Biosens Bioelectron. 2022. PMID: 35533507 Free PMC article.
-
A Multichannel Portable Platform With Embedded Thermal Management for Miniaturized Dielectric Blood Coagulometry.IEEE Trans Biomed Circuits Syst. 2023 Aug;17(4):843-856. doi: 10.1109/TBCAS.2023.3291875. Epub 2023 Oct 6. IEEE Trans Biomed Circuits Syst. 2023. PMID: 37399149
-
Microfluidics in Haemostasis: A Review.Molecules. 2020 Feb 14;25(4):833. doi: 10.3390/molecules25040833. Molecules. 2020. PMID: 32075008 Free PMC article. Review.
-
Neurosurgical applications of viscoelastic hemostatic assays.Neurosurg Focus. 2017 Nov;43(5):E9. doi: 10.3171/2017.8.FOCUS17447. Neurosurg Focus. 2017. PMID: 29088950 Review.
Cited by
-
Monitoring DOACs with a Novel Dielectric Microsensor: A Clinical Study.Thromb Haemost. 2021 Jan;121(1):58-69. doi: 10.1055/s-0040-1715589. Epub 2020 Sep 2. Thromb Haemost. 2021. PMID: 32877954 Free PMC article.
-
Carbon Nanotube Strain Sensor Based Hemoretractometer for Blood Coagulation Testing.ACS Sens. 2018 Mar 23;3(3):670-676. doi: 10.1021/acssensors.7b00971. Epub 2018 Feb 27. ACS Sens. 2018. PMID: 29485284 Free PMC article.
-
Blood Flow Velocimetry in a Microchannel During Coagulation Using Particle Image Velocimetry and Wavelet-Based Optical Flow Velocimetry.J Biomech Eng. 2021 Sep 1;143(9):091004. doi: 10.1115/1.4050647. J Biomech Eng. 2021. PMID: 33764427 Free PMC article.
-
Assessment of whole blood coagulation with a microfluidic dielectric sensor.J Thromb Haemost. 2018 Oct;16(10):2050-2056. doi: 10.1111/jth.14244. Epub 2018 Sep 25. J Thromb Haemost. 2018. PMID: 30007048 Free PMC article.
-
Assessment of fibrinolytic status in whole blood using a dielectric coagulometry microsensor.Biosens Bioelectron. 2022 Aug 15;210:114299. doi: 10.1016/j.bios.2022.114299. Epub 2022 Apr 26. Biosens Bioelectron. 2022. PMID: 35533507 Free PMC article.
References
-
- Harris L, Castro-López V, Killard A. Coagulation monitoring devices: past, present, and future at the point-of-care. TrAC Trends in Analytical Chemistry. 2013;50:85–95.
-
- Eastridge B, et al. Death on the battlefield (2001–2011) J Trauma and Acute Care Surgery. 2012;73:S431–S437. - PubMed
Publication types
MeSH terms
Grants and funding
LinkOut - more resources
Full Text Sources
Other Literature Sources
