. 2017 Oct 2;127(10):3877-3896.
doi: 10.1172/JCI94668. Epub 2017 Sep 18.

Impaired angiopoietin/Tie2 signaling compromises Schlemm's canal integrity and induces glaucoma

Affiliations

Impaired angiopoietin/Tie2 signaling compromises Schlemm's canal integrity and induces glaucoma

Jaeryung Kim et al. J Clin Invest. .

Abstract

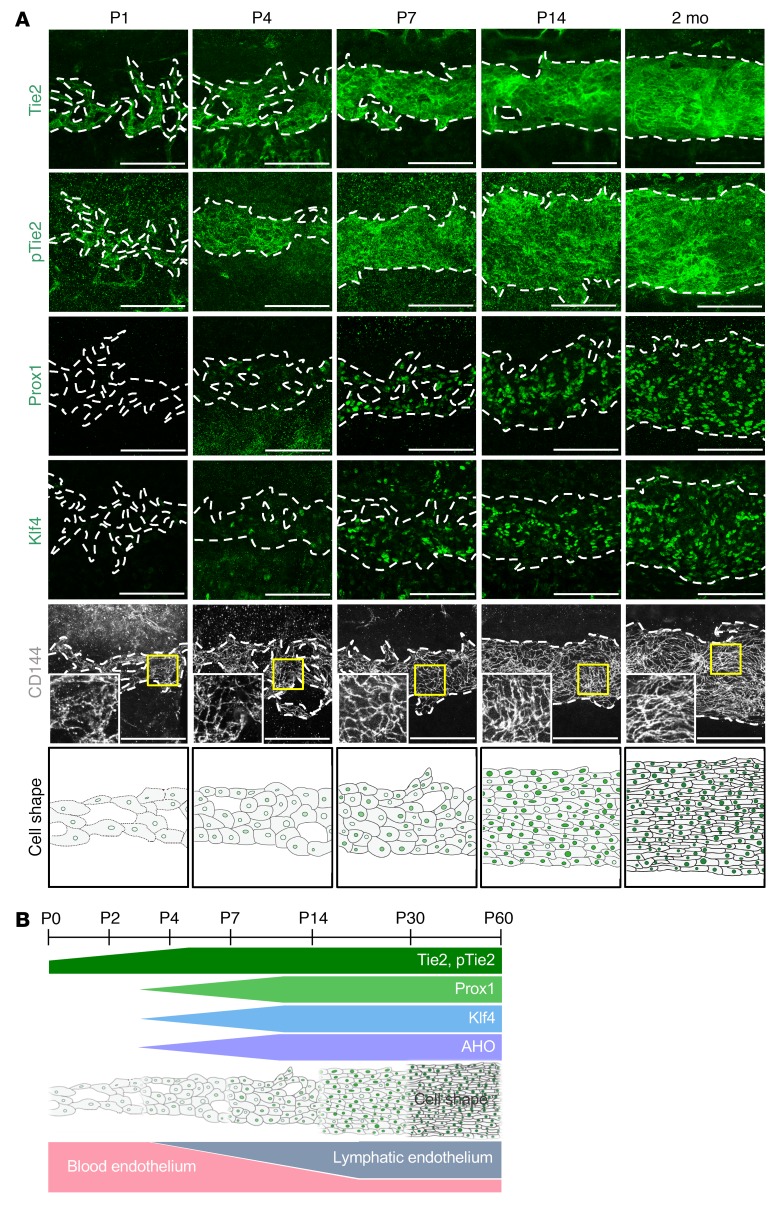
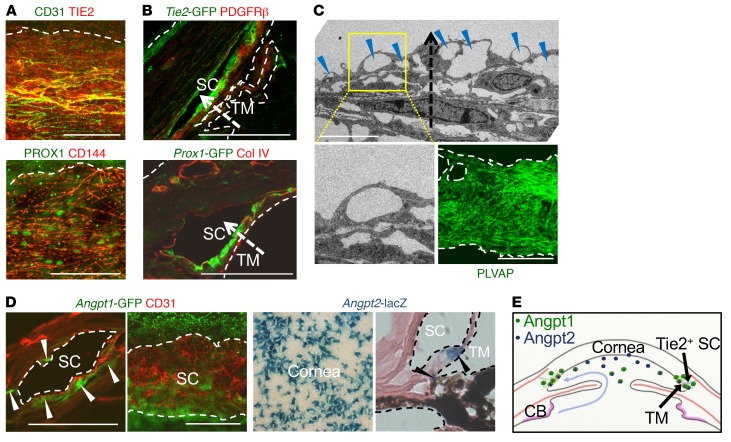
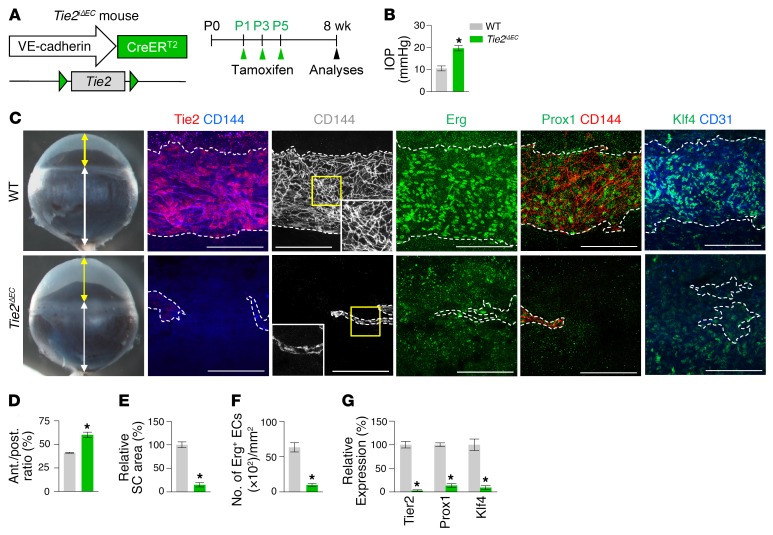
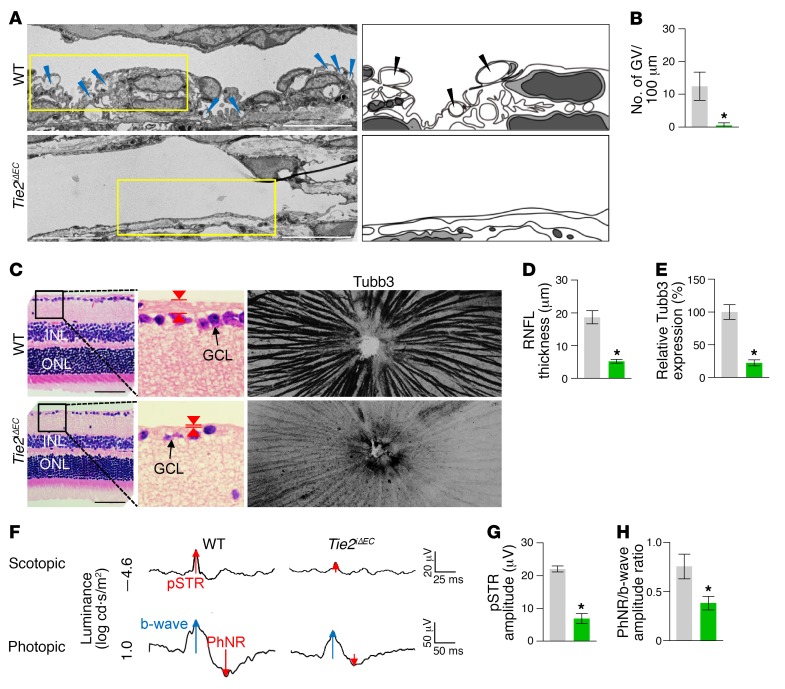
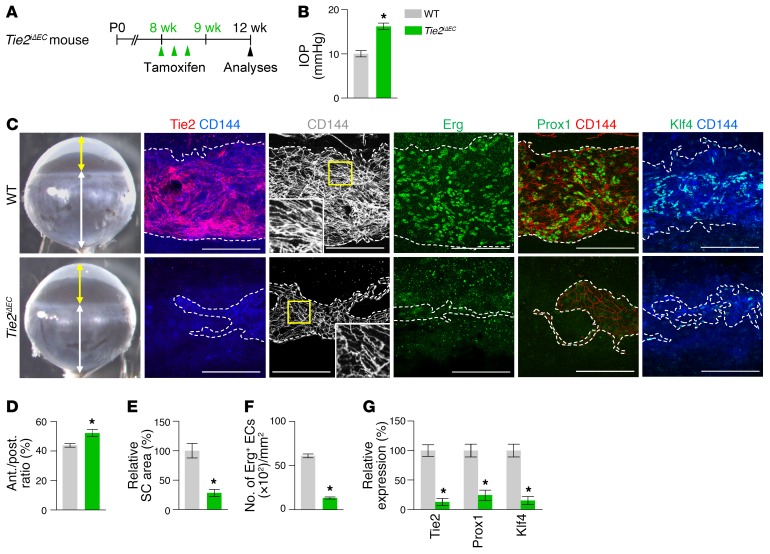
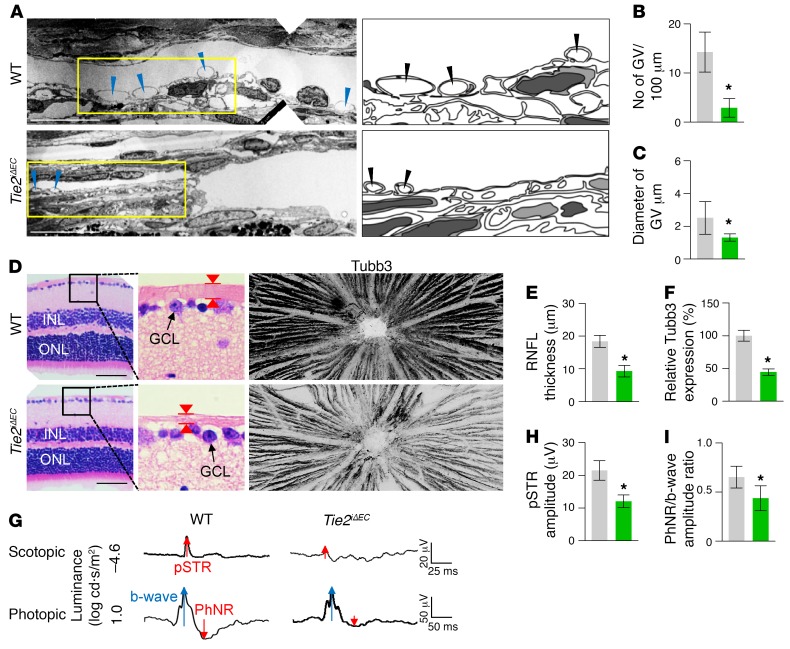
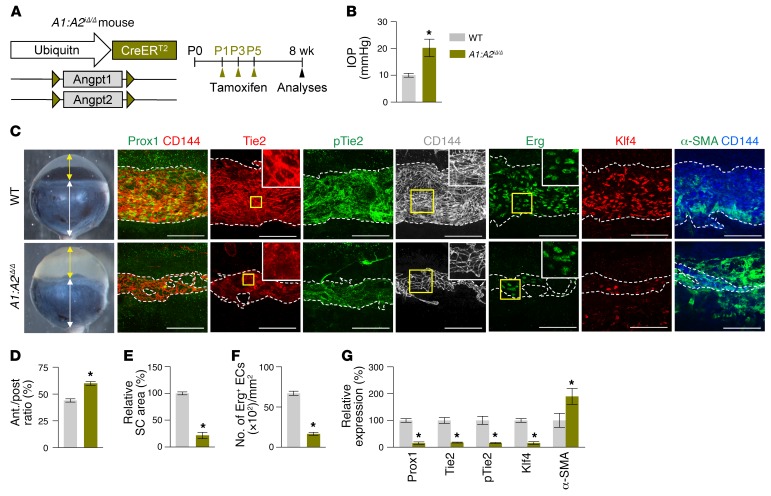
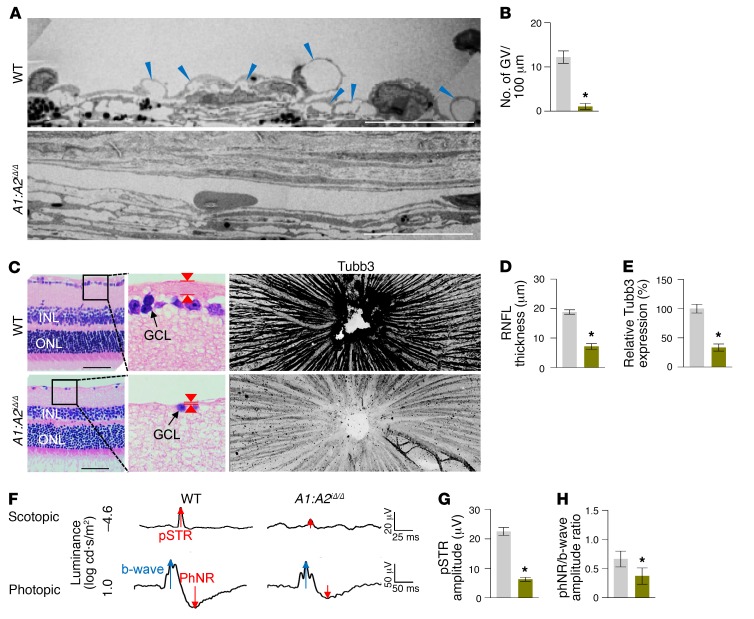
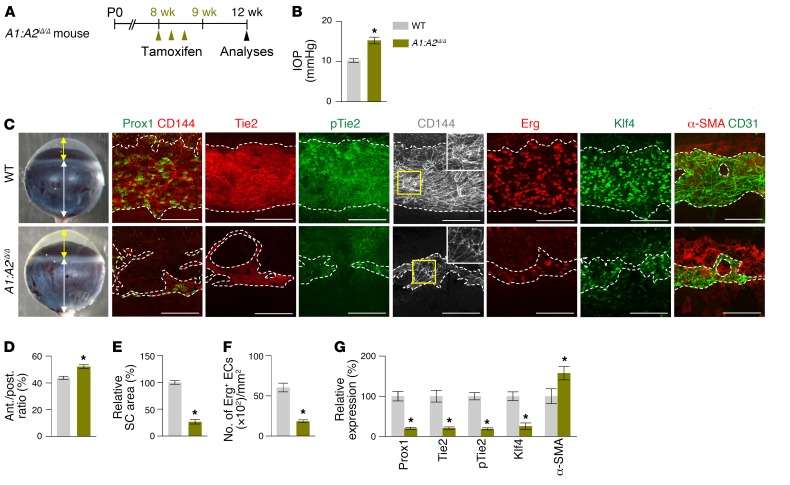
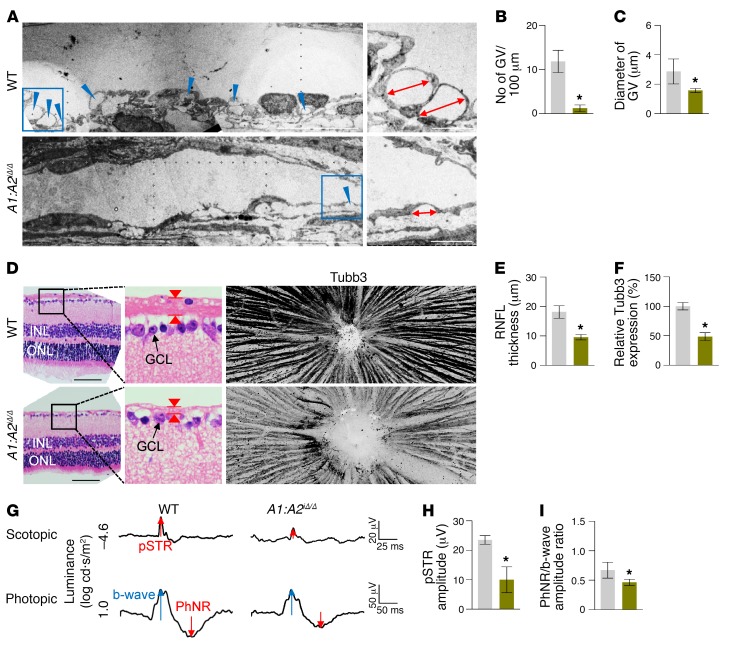
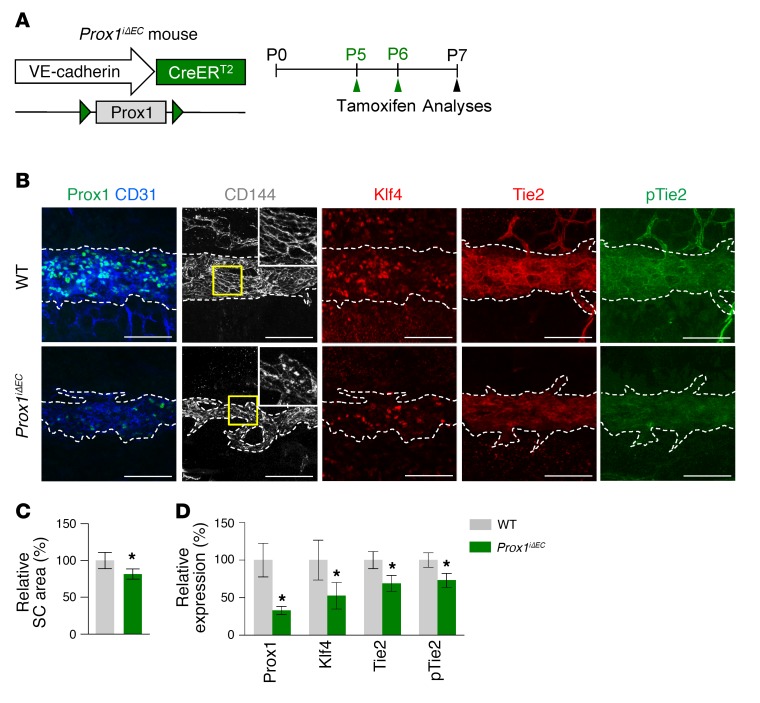
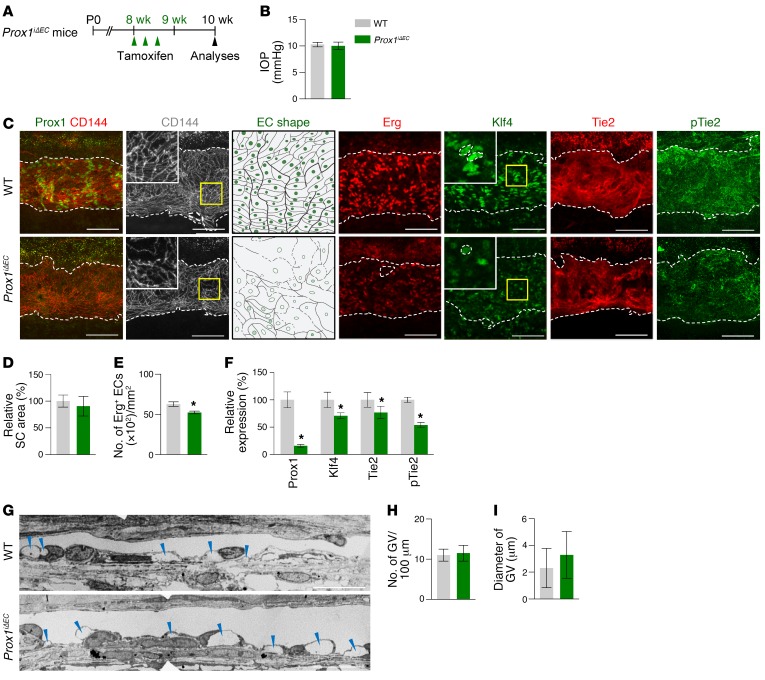
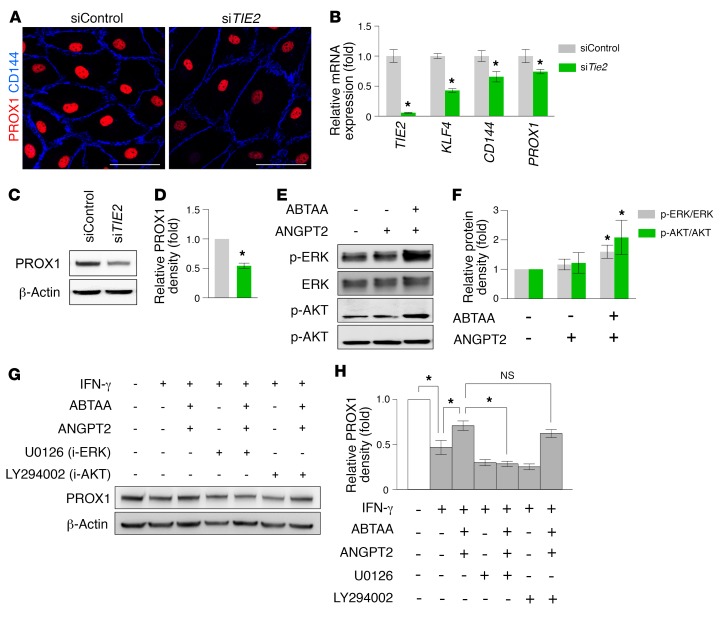
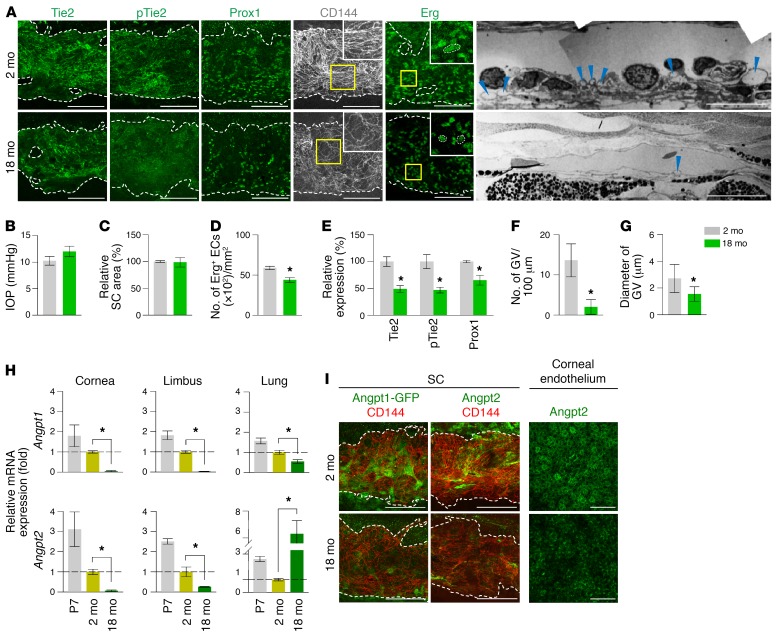
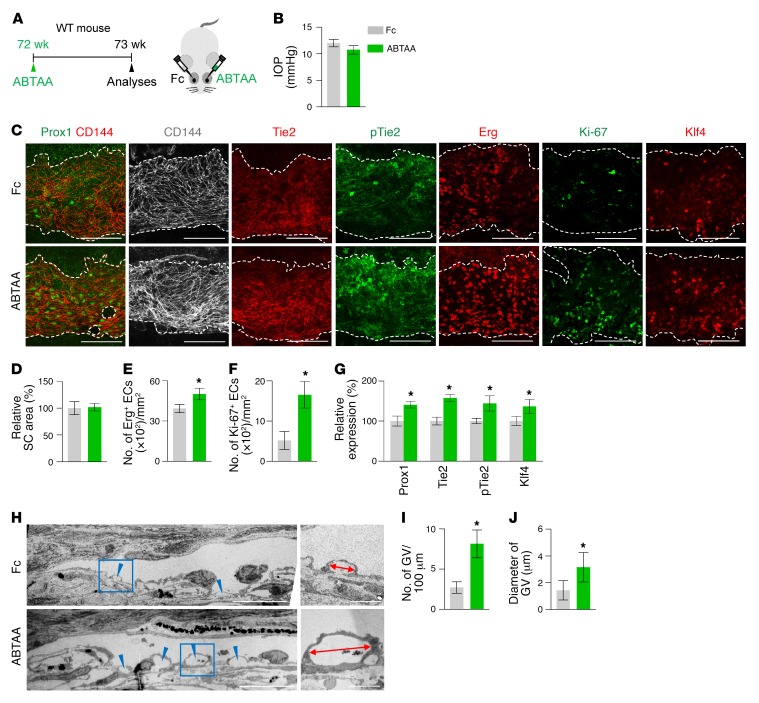
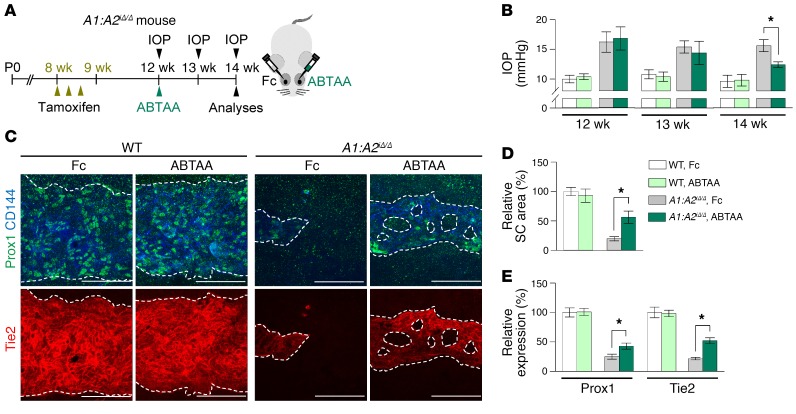
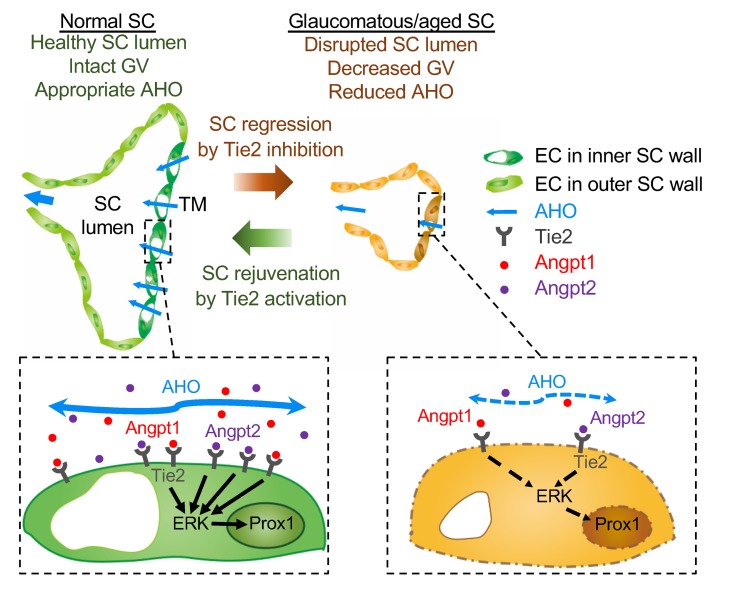
Primary open-angle glaucoma (POAG) is often caused by elevated intraocular pressure (IOP), which arises due to increased resistance to aqueous humor outflow (AHO). Aqueous humor flows through Schlemm's canal (SC), a lymphatic-like vessel encircling the cornea, and via intercellular spaces of ciliary muscle cells. However, the mechanisms underlying increased AHO resistance are poorly understood. Here, we demonstrate that signaling between angiopoietin (Angpt) and the Angpt receptor Tie2, which is critical for SC formation, is also indispensable for maintaining SC integrity during adulthood. Deletion of Angpt1/Angpt2 or Tie2 in adult mice severely impaired SC integrity and transcytosis, leading to elevated IOP, retinal neuron damage, and impairment of retinal ganglion cell function, all hallmarks of POAG in humans. We found that SC integrity is maintained by interconnected and coordinated functions of Angpt-Tie2 signaling, AHO, and Prox1 activity. These functions diminish in the SC during aging, leading to impaired integrity and transcytosis. Intriguingly, Tie2 reactivation using a Tie2 agonistic antibody rescued the POAG phenotype in Angpt1/Angpt2-deficient mice and rejuvenated the SC in aged mice. These results indicate that the Angpt-Tie2 system is essential for SC integrity. The impairment of this system underlies POAG-associated pathogenesis, supporting the possibility that Tie2 agonists could be a therapeutic option for glaucoma.


Conflict of interest statement

Conflict of interest: The authors have declared that no conflict of interest exists.

Figures

Figure 1
Figure 1. Tie2 expression precedes Prox1 expression in the SC.
(A) Temporal changes of protein expression and distribution of Tie2, p-Tie2, Prox1, Klf4, and CD144 in SC during postnatal development in mice. Dashed lines demarcate the margins of SC. Magnified view of each area marked by a yellow box is shown in the corner. Bottom panels are drawings highlighting the changes in cell shape and cell-cell junctions in ECs of SC. Scale bars: 100 μm. (B) Diagram depicting the temporal changes in expression of Tie2, p-Tie2, Prox1, and Klf4, gain of predicted AHO, EC shape, and acquisition of lymphatic phenotypes in SC during postnatal development in mice.
Figure 2
Figure 2. Tie2 in the inner SC wall is constantly exposed to Angpts.
(A) Images showing PROX1 and TIE2 in healthy adult human SCs. Scale bars: 100 μm. (B) Cross-section images showing Prox1+ and Tie2+ SC ECs and distribution of collagen IV or PDGFRβ in corneal limbus of 2-month-old Prox1-GFP and Tie2-GFP mice. Dashed arrows indicate direction of AHO. Scale bars: 100 μm. (C) EM images of SC and distribution of PLVAP in the ECs of the inner SC walls in 2-month-old mice. Yellow-lined box is magnified in left lower panel. Blue arrowheads indicate GVs in the inner SC wall, and dashed arrow indicates the direction of AHO. Scale bars: 5 μm (upper panel); 100 μm (right lower panel). (D) Images showing expression of Angpt1 (white arrowheads) in pericytes of SC and Angpt2 in corneal endothelium and TM (black arrowheads) in 2-month-old Angpt1-GFP and Angpt2-lacZ mice. Scale bars: 100 μm. (E) Diagram depicting the sources and distributions of secreted Angpt1 and Angpt2 for the formation and maintenance of Tie2+ SC. CB, ciliary body.
Figure 3
Figure 3. Tie2 is critical for SC generation.
(A) Diagram for EC-specific depletion of Tie2 in SC starting at P1 and analyses 8 weeks later using Tie2iΔEC mice. (BG) Images and comparisons of IOP, an anterior (yellow double arrow)/posterior (white double arrow) (ant./post.) segment ratio of the eyeball, relative area, number of Erg+ ECs, and intensities of Tie2, Prox1, and Klf4 immunostaining in CD144+ SC. Dashed lines demarcate the margins of SC. Each yellow-lined image is magnified in the corner. Scale bars: 100 μm. SC area and expression of each molecule in WT mice are normalized to 100%, and their relative levels in Tie2iΔEC mice are presented. n = 4–5 for each group. *P < 0.05 versus WT by Mann-Whitney U test.
Figure 4
Figure 4. Inadequate SC development by Tie2 depletion impairs AHO and retinal ganglion cell function.
(A and B) EM images and comparison of the number of GVs (blue and black arrowheads) in the inner SC wall. Right panels depict illustrative views of GVs. Scale bars: 10 μm. n = 4 for each group. *P < 0.05 versus WT by Mann-Whitney U test. (CE) Images and comparison of thickness (red arrowheads) and Tubb3 distribution of RNFL. Black-lined box is magnified in middle panel. INL, inner nuclear layer; ONL, outer nuclear layer; GCL, ganglion cell layer. Scale bars: 200 μm. (FH) Representative wave responses of electroretinogram and comparisons of pSTR amplitude and PhNR/b-wave amplitude ratio. n = 4 for each group. *P < 0.05 versus WT by Mann-Whitney U test.
Figure 5
Figure 5. Tie2 is critical for maintenance of SC.
(A) Diagram for EC-specific depletion of Tie2 in SC in 8-week-old mice and analyses 4 weeks later using Tie2iΔEC mice. (B-G) Images and comparisons of IOP, an anterior (yellow double arrow)/posterior (white double arrow) segment ratio of the eyeball, relative area, number of Erg+ ECs, and intensities of Tie2, Prox1, and Klf4 immunostaining in CD144+ SC. Dashed lines demarcate the margins of SC. Each area marked by a yellow box is magnified in the corner. Scale bars: 100 μm. SC area and expression of each molecule in WT mice are normalized to 100%, and their relative levels in Tie2iΔEC mice are presented. n = 4–5 for each group. *P < 0.05 versus WT by Mann-Whitney U test.
Figure 6
Figure 6. Defective SC integrity by Tie2 depletion impairs AHO and retinal ganglion cell function.
(AC) EM images and comparisons of number and diameter of GVs (blue and black arrowheads) in the inner SC wall. Right panels depict schematic views of yellow-lined boxes. n = 4 for each group. *P < 0.05 versus WT by Mann-Whitney U test. Scale bars: 10 μm. (DF) Images and comparisons of the thickness (red arrowheads) and Tubb3 distribution of RNFL. Black-lined box is magnified in middle panel. Scale bars: 200 μm. (GI) Representative wave responses of electroretinogram and comparisons of pSTR amplitude and PhNR/b-wave amplitude ratio. n = 4 for each group. *P < 0.05 versus WT by Mann-Whitney U test.
Figure 7
Figure 7. Combined depletion of Angpt1 and Angpt2 impairs SC formation.
(A) Diagram for global depletion of Angpt1 and Angpt2 starting at P1 and analyses at 8 weeks after birth using A1:A2iΔ/Δ mice. (BG) Images and comparisons of IOP, an anterior (yellow double arrow)/posterior (white double arrow) segment ratio of the eyeball, relative area, number of Erg+ ECs, and intensities of Prox1, Tie2, p-Tie2, Klf4, and α-SMA immunostaining in CD144+ SC. Dashed lines demarcate the margins of SC. Each area marked by a yellow box is magnified in the right top corner. Scale bars: 100 μm. SC area and expression of each molecule in WT mice are normalized to 100%, and their relative levels in A1:A2iΔ/Δ mice are presented. n = 4–5 for each group. *P < 0.05 versus WT by Mann-Whitney U test.
Figure 8
Figure 8. Impaired SC formation in A1:A2iΔ/Δ mice leads to glaucoma.
(A and B) EM images and comparisons of the number of GVs (blue arrowheads) in the inner SC wall. Scale bars: 10 μm. n = 4 for each group. *P < 0.05 versus WT by Mann-Whitney U test. (CE) Images and comparisons of thickness (red arrowheads) and Tubb3 distribution of RNFL. Black-lined box is magnified in middle panel. Scale bars: 200 μm. (FH) Representative wave responses of electroretinogram and comparisons of pSTR amplitude and PhNR/b-wave amplitude ratio. n = 4 for each group. *P < 0.05 versus WT by Mann-Whitney U test.
Figure 9
Figure 9. Combined depletion of Angpt1 and Angpt2 in adult mice causes SC regression.
(A) Diagram for combined global depletion of Angpt1 and Angpt2 in 8-week-old mice and analyses 4 weeks later using A1:A2iΔ/Δ mice. (BG) Images and comparisons of IOP, an anterior (yellow double arrow)/posterior (white double arrow) segment ratio of the eyeball, relative area, number of Erg+ ECs, and intensities of Prox1, Tie2, p-Tie2, Klf4, and α-SMA immunostaining in CD144+ or CD31+ SC. Dashed lines demarcate the margins of SC. Each area marked by a yellow box is magnified in the corner. Scale bars: 100 μm. SC area and expression of each molecule in WT mice are normalized to 100%, and their relative levels in A1:A2iΔ/Δ mice are presented. n = 4–5 for each group. *P < 0.05 versus WT by Mann-Whitney U test.
Figure 10
Figure 10. SC regression in A1:A2iΔ/Δ mice leads to adult-onset glaucoma.
(AC) EM images and comparisons of the number and diameter of GVs (blue arrowheads) in the inner SC wall. Blue-lined box is magnified in right panel. Red double arrows indicate diameters of GV. Scale bars: 10 μm (left panels); 2 μm (right panels). n = 4 for each group. *P < 0.05 versus WT by Mann-Whitney U test. (DF) Images and comparisons of thickness (red arrowheads) and Tubb3 distribution of RNFL. Black-lined box is magnified in middle panel. Scale bars: 200 μm. (GI) Representative wave responses of electroretinogram and comparisons of pSTR amplitude and PhNR/b-wave amplitude ratio. n = 4 for each group. *P < 0.05 versus WT by Mann-Whitney U test.
Figure 11
Figure 11. Prox1 is required for SC development.
(A) Diagram for EC-specific depletion of Prox1 in SC starting at P5 and analyses at P7 using Prox1iΔEC mice. (BD) Images and comparisons of relative area of SC and intensities of Prox1, Klf4, Tie2, and p-Tie2 immunostaining in CD31+ or CD144+ SC. Dashed lines demarcate the margins of SC, and each area marked by a yellow box is magnified in the top corner. Scale bars: 100 μm. SC area and expression of each molecule in WT group are normalized to 100%, and their relative levels in Prox1iΔEC mice are presented. n = 4 for each group. *P < 0.05 versus WT by Mann-Whitney U test.
Figure 12
Figure 12. Prox1 is required for SC maintenance.
(A) Diagram for EC-specific depletion of Prox1 in SCs in 8-week-old mice and analyses 2 weeks later using Prox1iΔEC mice. (BF) Images and comparisons of IOP, relative area, number of Erg+ ECs, and intensities of Prox1, Klf4, Tie2, and p-Tie2 immunostaining in CD144+ SC. Dashed lines demarcate the margins of SC, and each area marked by a yellow box is magnified in the top corner. Scale bars: 100 μm. SC area and expression of each molecule in WT group are normalized to 100%, and their relative levels in Prox1iΔEC mice are presented. n = 4 for each group. *P < 0.05 versus WT by Mann-Whitney U test. (GI) EM images and comparisons of the number and diameter of GVs (blue arrowheads) in the inner SC wall. n = 4 for each group. Scale bar: 10 µm (G).
Figure 13
Figure 13. PROX1 expression in hDLECs is regulated by ANGPT-TIE2 signaling.
(A) Images showing PROX1 (red) and CD144 (blue) in siControl-LECs and siTIE2-LECs. Scale bars: 50 μm. (B) Comparison of TIE2, KLF4, CD144, and PROX1 mRNA expression in siControl-LECs and siTIE2-LECs. Fold changes in mRNA expression relative to the levels of siControl-LECs are presented. n = 4 for each group. *P < 0.05 versus siControl-LECs by Mann-Whitney U test. (C and D) Immunoblot detection of PROX1 protein in siControl-LECs and siTIE2-LECs. Densitometric analysis of the relative level of PROX1 is shown. n = 5 for each group. *P < 0.05 versus siControl-LECs by Mann-Whitney U test. (E and F) Immunoblot detection of TIE2 downstream signaling proteins ERK, p-ERK, AKT, and p-AKT in hDLECs stimulated with ABTAA. Densitometric analyses of the p-ERK/ERK ratio and p-AKT/AKT ratio are shown. n = 5 for each group. *P < 0.05 by Kruskal-Wallis test followed by Tukey’s HSD test with ranks. (G and H) Immunoblot images showing modulation of PROX1 expression in hDLECs cultured with or without ABTAA and with or without inhibitors of ERK or AKT pathways. Densitometric analysis of the relative level of PROX1 is shown. n = 5 for each group. *P < 0.05 by Kruskal-Wallis test followed by Tukey’s HSD test with ranks.
Figure 14
Figure 14. Reduced Angpts and Tie2, cellularity, cell-cell junction, and transcytosis in aged SC.
(AE) Images and comparisons of IOP, relative area, number of Erg+ ECs, and intensities of Tie2, p-Tie2, and Prox1 immunostaining in CD144+ SC of 2-month-old versus 18-month-old mice. Dashed lines demarcate the margins of SC. Each area marked by a yellow box is magnified in the top corner. Scale bars: 100 μm; 10 µm (EM). SC area and expression of each molecule in 2-month-old mice are normalized to 100%, and their relative levels in 18-month-old mice are presented. n = 5 for each group. *P < 0.05 versus 2 months by Mann-Whitney U test. (A, F, and G) EM images and comparisons of the number and diameter of GV (blue arrowheads) in the inner SC wall. n = 4 for each group. *P < 0.05 versus 2 months by Mann-Whitney U test. (H) Comparison of Angpt1 and Angpt2 mRNA expression in cornea, limbus, and lung of mice at P7, 2 months, and 18 months of age. Fold changes in mRNA expression relative to the levels of 2-month-old mice are presented. n = 4 for each group. *P < 0.05 by Kruskal-Wallis test followed by Tukey’s HSD test with ranks. (I) Images showing expression of Angpt1, Angpt2, and CD144 in SC and Angpt2 in corneal endothelium. Scale bars: 100 μm.
Figure 15
Figure 15. Tie2 activation rejuvenates SC in aged mice.
(A) Diagram depicting the experiment schedule in 72-week-old WT mice for intraocular administration of ABTAA (~5 μg, left eye) and Fc (~5 μg, right eye) and analyses 1 week later. (BG) Images and comparisons of IOP, relative area, number of Erg+ and Ki-67+ ECs, and intensities of Prox1, Tie2, p-Tie2, and Klf4 immunostaining in CD144+ SC. Dashed lines demarcate SC. Scale bars: 100 μm. Area and expression of each molecule in Fc-treated SC are normalized to 100%, and their relative levels of ABTAA-treated SC are presented. n = 4 for each group. *P < 0.05 versus Fc by Mann-Whitney U test. (HJ) EM images and comparisons of the number and diameter of GVs (blue arrowheads) in the inner SC wall. Blue-lined box is magnified in right panel. Red double arrows indicate diameters of GV. Scale bars: 10 μm (left panels); 2 μm (right panels). n = 4 for each group. *P < 0.05 versus Fc by Mann-Whitney U test.
Figure 16
Figure 16. Tie2 activation rescues regressed SC of A1:A2iΔ/Δ mice.
(A) Diagram depicting the experiment schedule in WT and A1:A2iΔ/Δ mice for administration of tamoxifen, intraocular ABTAA (~5 μg, left eye), and Fc (~5 μg, right eye), periodic measurements of IOP, and analyses of their SCs. (BE) Images and comparisons of IOP, relative area, and intensities of Prox1 and Tie2 immunostaining in CD144+ SC. Dashed lines demarcate SC. Scale bars: 100 μm. SC area and expression of each molecule in WT mice treated with Fc are normalized to 100%, and relative levels of other groups are presented. n = 5 for each group. *P < 0.05 by Kruskal-Wallis test followed by Tukey’s HSD test with ranks.
Figure 17
Figure 17. Schematic diagrams depicting how impairment of Angpt-Tie2 signaling disintegrates the maintenance of SC integrity, leading to glaucomagenesis.
In normal adult SC, controlled Angpt–Tie2–ERK–Prox1 signaling cascade maintains appropriate AHO and intact GV. On the other hand, in glaucomatous or aged SC, inhibition of Angpt-Tie2 signaling attenuates ERK-Prox1 signaling and subsequently disrupts SC lumen, which consequently leads to decreased AHO. This, in turn, reduces transport of Angpt1 and Angpt2 through AH, resulting in further inhibition of the Angpt-Tie2 system in a vicious cycle manner. These exacerbating processes eventually trigger further disintegration of SC, inducing elevated IOP and accelerating POAG progression. Tie2 activation rejuvenates SC through upregulation of ERK-Prox1 signaling, which promotes AHO while decreasing IOP and eventually prevents POAG progression.

Comment in

  • All TIEd up: mechanisms of Schlemm’s canal maintenance doi: 10.1172/JCI96840

References

    1. Tham YC, Li X, Wong TY, Quigley HA, Aung T, Cheng CY. Global prevalence of glaucoma and projections of glaucoma burden through 2040: a systematic review and meta-analysis. Ophthalmology. 2014;121(11):2081–2090. doi: 10.1016/j.ophtha.2014.05.013. - DOI - PubMed
    1. Weinreb RN, Aung T, Medeiros FA. The pathophysiology and treatment of glaucoma: a review. JAMA. 2014;311(18):1901–1911. doi: 10.1001/jama.2014.3192. - DOI - PMC - PubMed
    1. Goel M, Picciani RG, Lee RK, Bhattacharya SK. Aqueous humor dynamics: a review. Open Ophthalmol J. 2010;4:52–59. doi: 10.2174/1874364101004010052. - DOI - PMC - PubMed
    1. Gabelt BT, Kaufman PL. Changes in aqueous humor dynamics with age and glaucoma. Prog Retin Eye Res. 2005;24(5):612–637. doi: 10.1016/j.preteyeres.2004.10.003. - DOI - PubMed
    1. Janssen SF, et al. The vast complexity of primary open angle glaucoma: disease genes, risks, molecular mechanisms and pathobiology. Prog Retin Eye Res. 2013;37:31–67. doi: 10.1016/j.preteyeres.2013.09.001. - DOI - PubMed

MeSH terms