. 2017 Nov;20(11):1560-1568.
doi: 10.1038/nn.4641. Epub 2017 Sep 18.

Dopamine induces soluble α-synuclein oligomers and nigrostriatal degeneration

Affiliations

Dopamine induces soluble α-synuclein oligomers and nigrostriatal degeneration

Danielle E Mor et al. Nat Neurosci. 2017 Nov.

Abstract

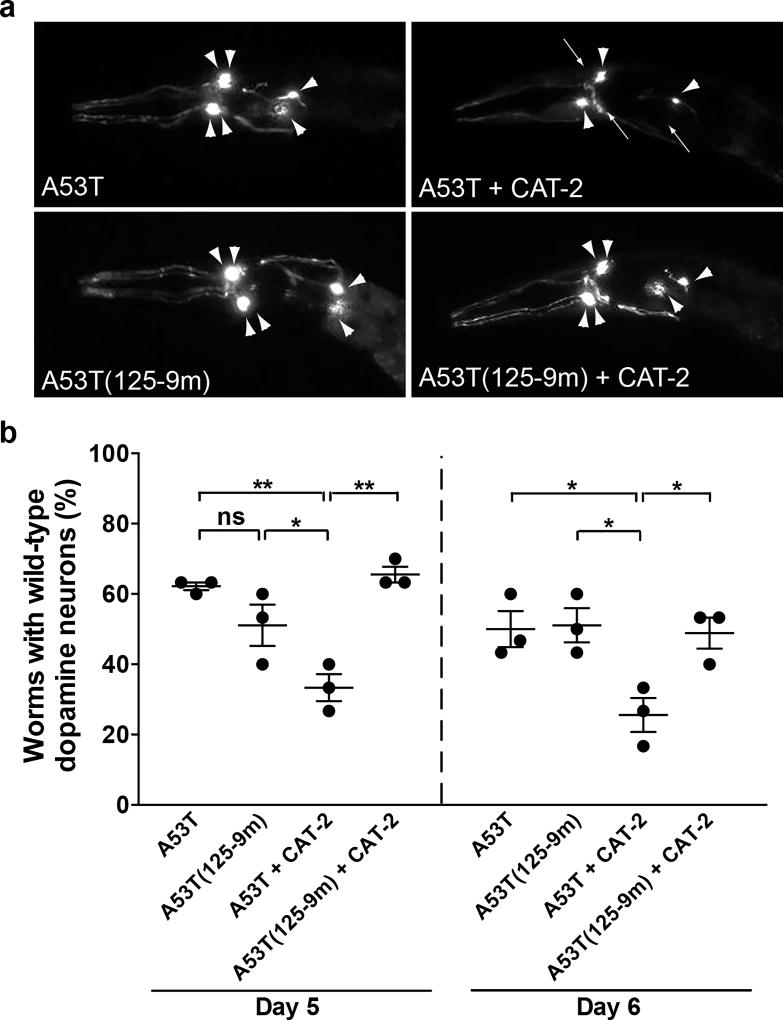
Parkinson's disease (PD) is defined by the loss of dopaminergic neurons in the substantia nigra and the formation of Lewy body inclusions containing aggregated α-synuclein. Efforts to explain dopamine neuron vulnerability are hindered by the lack of dopaminergic cell death in α-synuclein transgenic mice. To address this, we manipulated both dopamine levels and α-synuclein expression. Nigrally targeted expression of mutant tyrosine hydroxylase with enhanced catalytic activity increased dopamine levels without damaging neurons in non-transgenic mice. In contrast, raising dopamine levels in mice expressing human A53T mutant α-synuclein induced progressive nigrostriatal degeneration and reduced locomotion. Dopamine elevation in A53T mice increased levels of potentially toxic α-synuclein oligomers, resulting in conformationally and functionally modified species. Moreover, in genetically tractable Caenorhabditis elegans models, expression of α-synuclein mutated at the site of interaction with dopamine prevented dopamine-induced toxicity. These data suggest that a unique mechanism links two cardinal features of PD: dopaminergic cell death and α-synuclein aggregation.


Conflict of interest statement

Competing Financial Interests Statement

The authors declare no competing financial interests.

Figures

Figure 1
Figure 1. TH-RREE lentiviral vector increases dopamine levels and causes hyperactivity in NonTg mice
(a) TH protein levels were increased in the striatum of TH-RREE vector injected mice relative to empty vector-injected controls (CtrlVect) at 5 mpi. Densitometric analysis was conducted by normalizing TH to the GAPDH loading control. Blots are cropped; for full-length blots see Supplementary Fig. 11. (n = 3 mice per group, P = 0.0201, t = 3.742, d.f. = 4; two-tailed unpaired Student’s t test). (b) Increased TH expression was confirmed by immunohistochemistry in the SN (left panels) and striatum (right panels). Scale bar, 200 µm. (n = 4 mice per group). (c) TH overexpression significantly increased the steady state concentrations of striatal catecholamines L-DOPA and dopamine (DA), but did not alter DOPAC or 5-HT. (L-DOPA, n = 4 mice per group, P = 0.0235, t = 3.017, d.f. = 6; DA, n = 4 mice per group, P = 0.0137, t = 3.445, d.f. = 6; DOPAC, n = 5 mice for CtrlVect and n = 4 mice for TH-RREE, P = 0.2713, t = 1.194, d.f. = 7; 5-HT, n = 4 mice for CtrlVect and n = 3 mice for TH-RREE, P = 0.658, t = 0.4703, d.f. = 5; two-tailed unpaired Student’s t test). (d) TH-RREE injected NonTg mice exhibited greater locomotion as measured by open field activity. (n = 5 mice per group, P = 0.0399, t = 2.451, d.f. = 8; two-tailed unpaired Student’s t test). (e) There was no change in rotarod performance between the injection groups. (n = 3 mice per group, P = 0.9959, t = 0.005455, d.f. = 4; two-tailed unpaired Student’s t test). Box plots show median, 25th and 75th percentiles, minimum and maximum values. *P < 0.05.
Figure 2
Figure 2. Dopamine-induced neurodegeneration of the SN is dependent on α-synuclein
(a) At 5 mpi, fewer VMAT2-positive cells (arrows) were present in the SN of A53T TH-RREE mice compared with all other injection groups. Scale bar, 100 µm. (n = 3 mice per group). (b) Unbiased stereological counting of Nissl-positive neurons in the SN revealed a significant 25% loss of cells in A53T TH-RREE mice. The data are presented as mean ± s.e.m. (n = 3 mice per group except n = 4 mice for A53T TH-RREE, PA53T TH-RREE versus A53T CtrlVect = 0.0049, PA53T TH-RREE versus NonTg CtrlVect = 0.0316, PA53T TH-RREE versus NonTg TH-RREE = 0.0253, F(3,9) = 8.810; one-way ANOVA with Tukey’s correction for multiple comparisons). (c–d) Histological analysis of VMAT2 staining in the striatum, with subtraction of background staining in the cortex, indicated severe dopaminergic denervation in A53T TH-RREE mice. Scale bar, 200 µm. (n = 3 mice per group, PA53T TH-RREE versus A53T CtrlVect = 0.0043, PA53T TH-RREE versus NonTg CtrlVect = 0.0163, PA53T TH-RREE versus NonTg TH-RREE = 0.0163, F(3,8) = 10.02; one-way ANOVA with Tukey’s correction for multiple comparisons). (e–f) Striatal DAT levels normalized to the actin loading control were increased in NonTg TH-RREE mice relative to NonTg CtrlVect, whereas DAT levels were decreased in A53T TH-RREE mice as compared to A53T CtrlVect. Blots are cropped; for full-length blots see Supplementary Fig. 11. (n = 3 mice per group except n = 4 mice for NonTg CtrlVect, PA53T TH-RREE versus A53T CtrlVect = 0.0211, PA53T CtrlVect versus NonTg CtrlVect = 0.0097, PNonTg TH-RREE versus NonTg CtrlVect = 0.0466, F(3,9) = 8.411; one-way ANOVA with Tukey’s correction for multiple comparisons). Box plots show median, 25th and 75th percentiles, minimum and maximum values. *P < 0.05, **P < 0.01.
Figure 3
Figure 3. Dopaminergic neurodegeneration in A53T TH-RREE mice is progressive and ultimately leads to locomotor deficit
(a) At the early timepoint of 2.5 mpi, A53T TH-RREE mice did not yet exhibit loss of neuronal cell bodies in the SN. The data are presented as mean ± s.e.m. (n = 4 mice for CtrlVect and n = 3 mice for TH-RREE, P = 0.8453, t = 0.2055, d.f. = 5; two-tailed unpaired Student’s t test). (b) VMAT2 staining in the striatum revealed a modest loss of terminals suggesting that dopaminergic synapses had degenerated prior to overt cell death. Scale bar, 200 µm. (n = 4 mice per group, P = 0.0424, t = 2.569, d.f. = 6; two-tailed unpaired Student’s t test). (c) A53T TH-RREE mice exhibited an elevation of dopamine (DA) levels only transiently, with an initial increase of 71% at 2.5 mpi compared with age-matched A53T CtrlVect mice. Subsequently, however, A53T TH-RREE mice underwent a significant 37% drop in striatal dopamine between 2.5 and 5 mpi, which was not observed in A53T CtrlVect mice. (n = 3 mice per group except n = 5 mice for TH-RREE 2.5 mpi, PTH-RREE 2.5 mpi versus CtrlVect 2.5 mpi = 0.0092, PTH-RREE 2.5 mpi versus TH-RREE 5 mpi = 0.0187, F(3,10) = 7.460; one-way ANOVA with Tukey’s correction for multiple comparisons). (d) Levels of DOPAC in the striatum remained unchanged over time regardless of lentiviral treatment. (CtrlVect, n = 3 mice per group; TH-RREE, n = 6 mice for 2.5 mpi and n = 4 mice for 5 mpi, F(3,12) = 0.5481; one-way ANOVA with Tukey’s correction for multiple comparisons). (e) Consistent with a late-onset depletion of dopamine in the striatum, from 2.5 to 5 mpi A53T TH-RREE mice developed a reduction in locomotor activity that was not observed in CtrlVect mice. (n = 3 mice per group, PTH-RREE 5 mpi versus CtrlVect 5 mpi = 0.0152, PTH-RREE 5 mpi versus TH-RREE 2.5 mpi = 0.0488, PTH-RREE 5 mpi versus CtrlVect 2.5 mpi = 0.0213, F(3,8) = 7.107; one-way ANOVA with Tukey’s correction for multiple comparisons). (f) The motor deficit in A53T TH-RREE mice was not severe enough to affect coordination or balance, as rotarod performance remained intact. (n = 4 mice per group except n = 3 mice for TH-RREE 2.5 mpi and n = 3 mice for CtrlVect 5 mpi, F(3,10) = 0.07172; one-way ANOVA with Tukey’s correction for multiple comparisons). Box plots show median, 25th and 75th percentiles, minimum and maximum values. *P < 0.05, **P < 0.01.
Figure 4
Figure 4. Dopamine induces conformationally distinct α-synuclein oligomers in the mouse brain
(a–d) The SN of A53T TH-RREE and A53T CtrlVect mice at 5 mpi was extracted with 1% Triton and the soluble fraction was analyzed by SDS-PAGE (a–b). The soluble extract was further subjected to native size exclusion chromatography and fractions corresponding to 31–38 Å, 41–65 Å, and 72–122 Å were pooled and analyzed by SDS-PAGE (c–d). Neural specific enolase (NSE) was used as a loading control. The quantification revealed a decrease in soluble α-synuclein monomer and a corresponding increase in α-synuclein oligomers in A53T TH-RREE compared with A53T CtrlVect. The oligomer species in A53T TH-RREE mice were present in higher Å fractions than in controls and had a range of molecular weights. Monomer α-synuclein and NSE blots are cropped; for full-length blots see Supplementary Fig. 11. (Monomer, n = 3 mice for CtrlVect and n = 5 mice for TH-RREE, P = 0.0401, t = 2.611, d.f. = 6; Oligomer, n = 3 mice for CtrlVect and n = 4 mice for TH-RREE, P = 0.0338, t = 2.900, d.f. = 5; two-tailed unpaired Student’s t test). (e) Immunoelectron microscopy on low (41–65) and high (72–122) Å fractions from A53T mice using Syn505 (N-terminal) and LB509 (C-terminal) α-synuclein antibodies, with 10 nm gold-conjugated secondary. Scale bar, 10 nm. (n = 3 mice per group). (f) Pooled oligomeric fractions (41–122 Å) from indicated mice were added to aggregation reactions with fresh recombinant α-synuclein, and fibril formation was monitored by Thioflavin T (ThioT). Prior immunodepletion of α-synuclein from A53T CtrlVect fractions was performed as a control. rfu, relative fluorescence units. The data are presented as mean ± s.e.m. (n = 3 mice per group except n = 4 mice for no seed and n = 4 mice for immunodepl; PA53T CtrlVect 20 hour versus no seed 20 hour = 0.0114, PA53T CtrlVect 20 hour versus A53T TH-RREE 20 hour = 0.0172, PA53T CtrlVect 20 hour versus A53T CtrlVect Immunodepl. 20 hour = 0.0292, PA53T CtrlVect 24 hour versus no seed 24 hour = 0.0158, PA53T CtrlVect 24 hour versus A53T TH-RREE 24 hour = 0.0019, PA53T CtrlVect 24 hour versus A53T CtrlVect Immunodepl. 24 hour = 0.0139, F(3,10) = 4.563; repeated measures two-way ANOVA with Tukey’s correction for multiple comparisons). Box plots show median, 25th and 75th percentiles, minimum and maximum values. *P < 0.05, **P < 0.01.
Figure 5
Figure 5. C. elegans expressing A53T α-synuclein lacking the site of interaction with dopamine are resistant to dopamine neurotoxicity
(a–b) Expression of A53T human α-synuclein in dopaminergic neurons of C. elegans resulted in 62% of worms with wild-type dopamine neurons at day 5 post-hatching, and 50% at day 6 post-hatching. Overexpression of CAT-2 in A53T worms significantly exacerbated toxicity at both timepoints, whereas co-expression of CAT-2 with A53T α-synuclein mutated at the site of interaction with dopamine [A53T(125-9m)] showed significant resistance to CAT-2 induced toxicity. Representative images from day 5 post-hatching are shown in (a), with intact neurons marked by arrowheads and degenerating or missing neurons by arrows. ns, not significant. The data are presented as mean ± s.e.m. (n = 30 worms per genotype per replicate, 3 independent replicates, PA53T + CAT-2 Day 5 versus A53T Day 5 = 0.0026, PA53T + CAT-2 Day 5 versus A53T(125-9m) Day 5 = 0.0393, PA53T + CAT-2 Day 5 versus A53T(125-9m) + CAT-2 Day 5 = 0.0013, F(3,8) = 15.19; PA53T + CAT-2 Day 6 versus A53T Day 6 = 0.029, PA53T + CAT-2 Day 6 versus A53T(125-9m) Day 6 = 0.0232, PA53T + CAT-2 Day 6 versus A53T(125-9m) + CAT-2 Day 6 = 0.0365, F(3,8) = 6.488; one-way ANOVA on each timepoint with Tukey’s correction for multiple comparisons). *P < 0.05, **P < 0.01.

Comment in

Similar articles

Cited by

References

    1. Ehringer H, Hornykiewicz O. Verteilung von Noradrenalin und Dopamin (3-Hydroxytyramin) im Gehirn des Menschen und ihr Verhalten bei Erkrankungen des extrapyramidalen Systems. Klin Wschr. 1960;38:1236–1239. - PubMed
    1. Graham DG. Oxidative pathways for catecholamines in the genesis of neuromelanin and cytotoxic quinones. Mol Pharmacol. 1978;14:633–43. - PubMed
    1. Jenner P, Olanow CW. Oxidative stress and the pathogenesis of Parkinson's disease. Neurology. 1996;47:S161–70. - PubMed
    1. Dexter DT, Carter CJ, Wells FR, Javoy-Agid F, Agid Y, Lees A, Jenner P, Marsden CD. Basal lipid peroxidation in substantia nigra is increased in Parkinson's disease. J Neurochem. 1989;52:381–9. - PubMed
    1. Zhang J, Perry G, Smith MA, Robertson D, Olson SJ, Graham DG, Montine TJ. Parkinson’s disease is associated with oxidative damage to cytoplasmic DNA and RNA in substantia nigra neurons. Am J Pathol. 1999;154:1423–1429. - PMC - PubMed

MeSH terms