. 2017 Oct;19(10):1153-1163.
doi: 10.1038/ncb3607. Epub 2017 Sep 18.

Lifelong haematopoiesis is established by hundreds of precursors throughout mammalian ontogeny

Affiliations

Lifelong haematopoiesis is established by hundreds of precursors throughout mammalian ontogeny

Miguel Ganuza et al. Nat Cell Biol. 2017 Oct.

Abstract

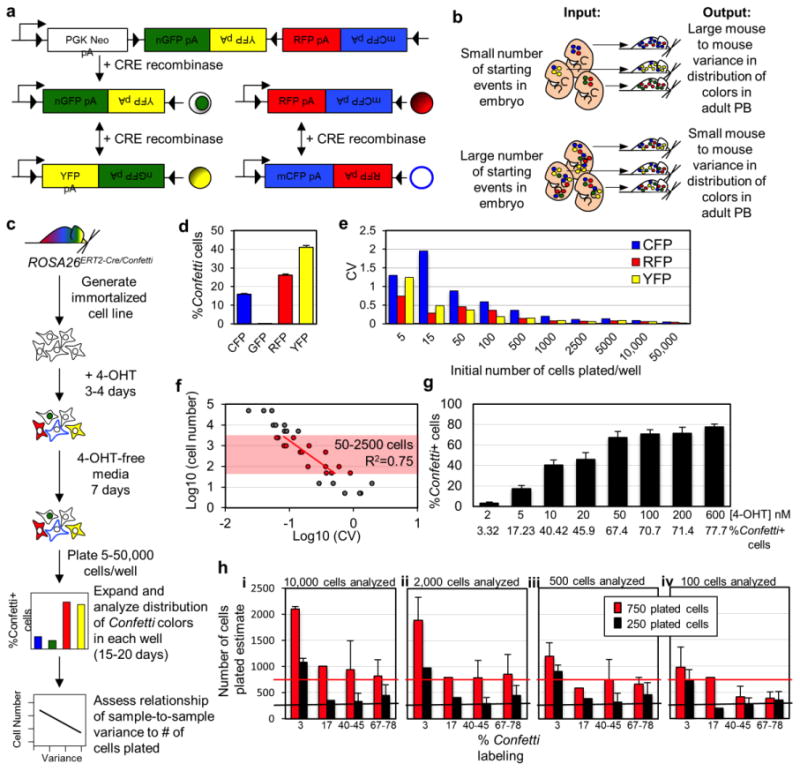
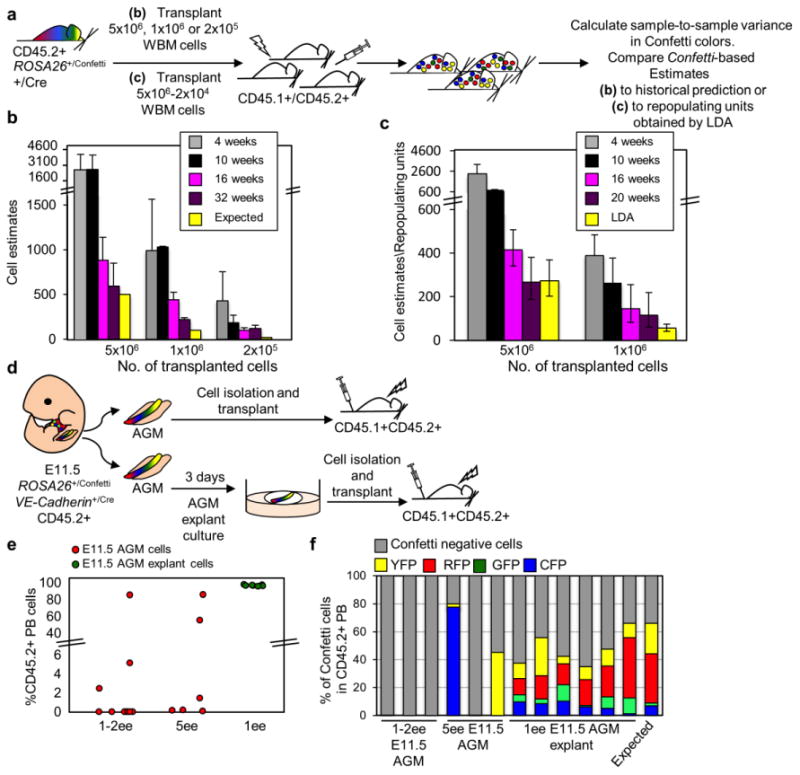
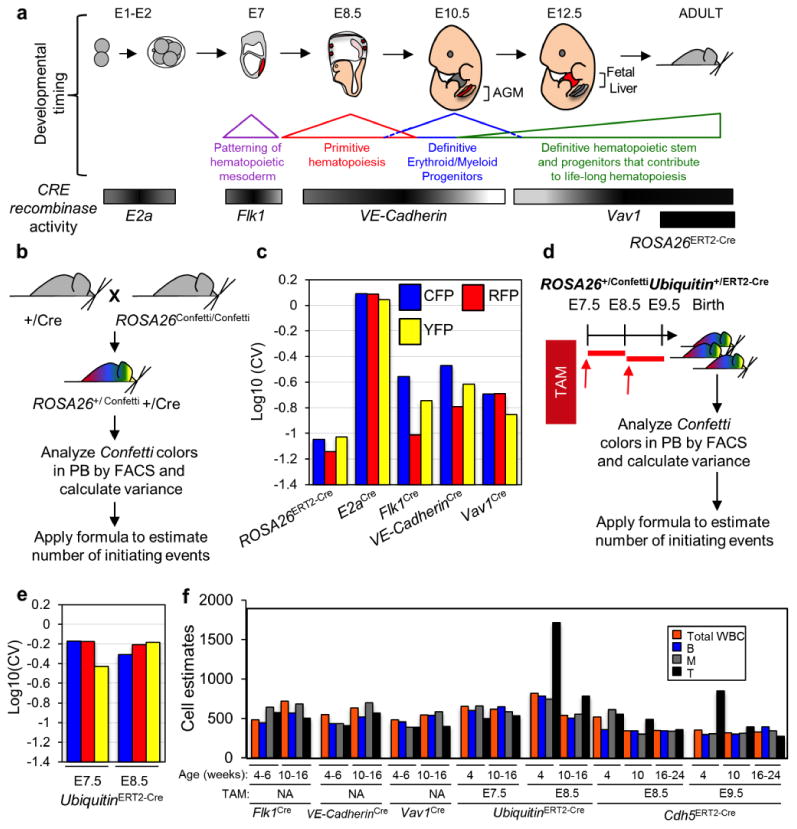
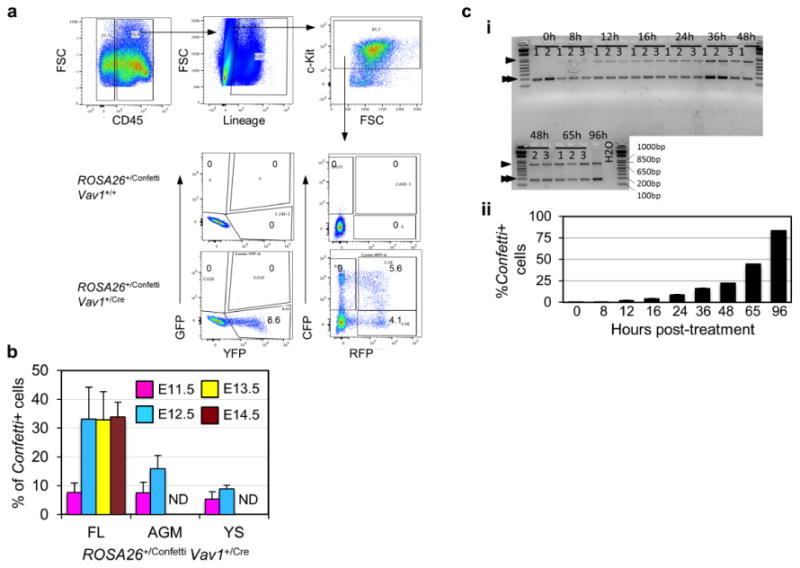
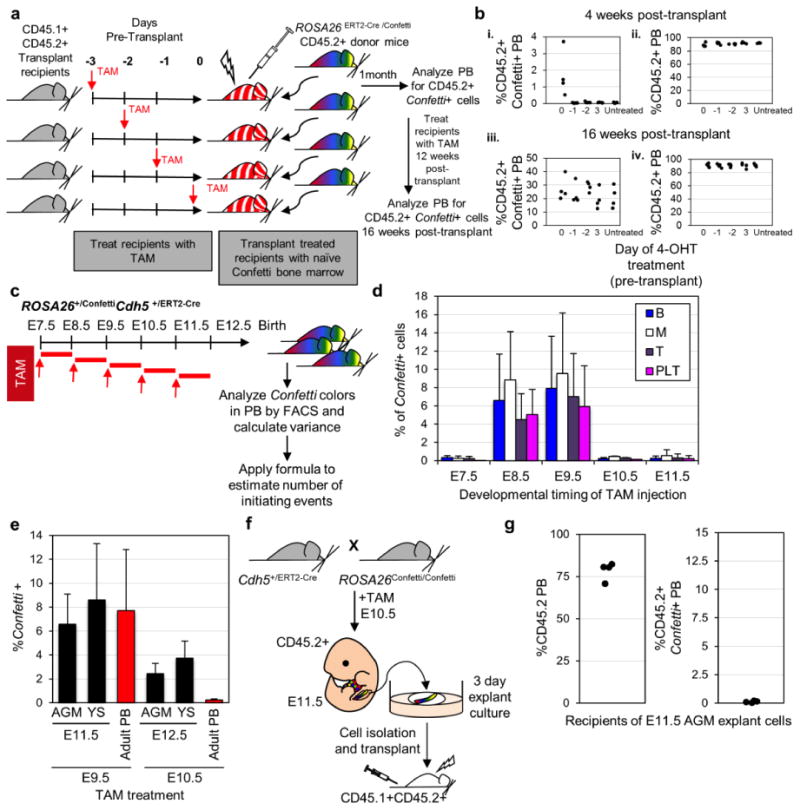
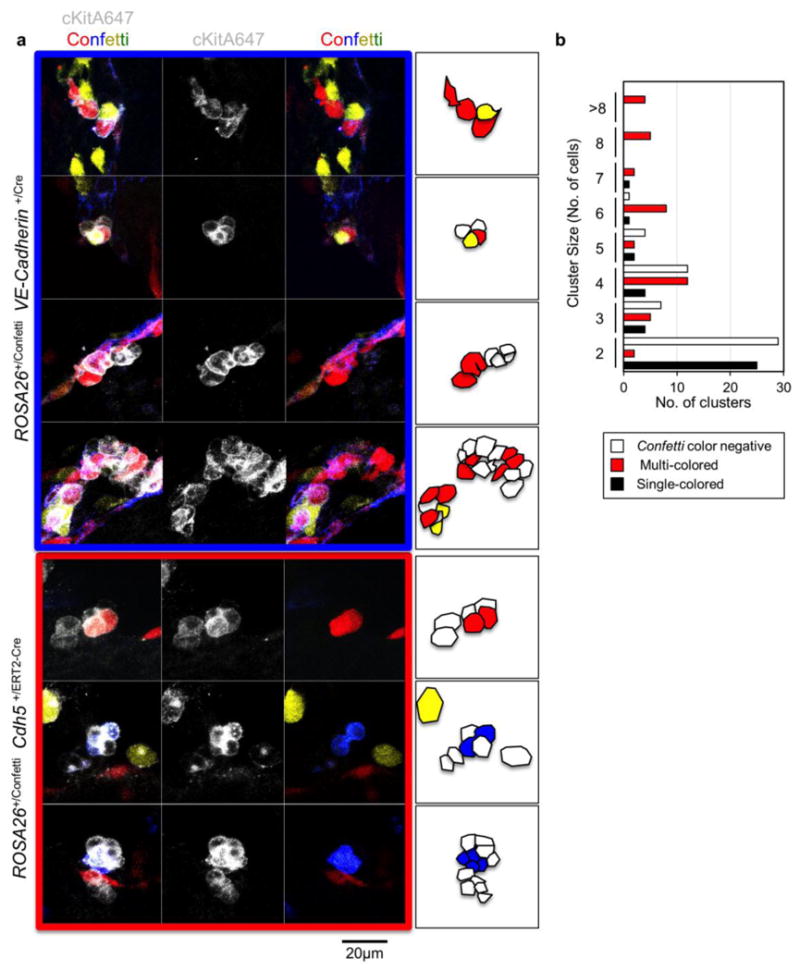
Current dogma asserts that mammalian lifelong blood production is established by a small number of blood progenitors. However, this model is based on assays that require the disruption, transplantation and/or culture of embryonic tissues. Here, we used the sample-to-sample variance of a multicoloured lineage trace reporter to assess the frequency of emerging lifelong blood progenitors while avoiding the disruption, culture or transplantation of embryos. We find that approximately 719 Flk1+ mesodermal precursors, 633 VE-cadherin+ endothelial precursors and 545 Vav1+ nascent blood stem and progenitor cells emerge to establish the haematopoietic system at embryonic days (E)7-E8.5, E8.5-E11.5 and E11.5-E14.5, respectively. We also determined that the spatio-temporal recruitment of endothelial blood precursors begins at E8.5 and ends by E10.5, and that many c-Kit+ clusters of newly specified blood progenitors in the aorta are polyclonal in origin. Our work illuminates the dynamics of the developing mammalian blood system during homeostasis.


Figures

Figure 1
Figure 1. Sample-to-sample variance reliably estimates number of initiating events
a, Schematic of Confetti allele. b, Sample-to-sample variance in the distribution of Confetti colors (output) inversely correlates with initiating events (input). c, Schematic of iCC experiment. d, Confetti labeling of 4-OHT treated iCCs. e, Well-to-well coefficient of variance (CV, standard deviation/mean) of each Confetti color in expanded iCCs. f, Average Log10(CV) of RFP, CFP, and YFP vs. Log10(cells plated/well). Shaded region indicates cell range in which slope minimally diverged from slope of Log10(CV) vs. Log10 (starting cell number) line yielded in simulations (50-2500 cells, Supplemental Fig. 1c). Linear regression yielded: cell number = 10(-1.56*Log10(CV)+1.47) with 95% confidence intervals defined by cell number = 10(-2.1*Log10(CV)+1.06) (lower bound) and cell number = 10(-1.02*(Log10(CV)+1.89) (upper bound). This linear regression had an R2 of 0.75 and an adjusted R2 of 0.73 and p-value <0.00001 (F(1,13) == 39.21). For the 15 residuals within the range tested the skew was 0.06 and the kurtosis 2.34, where a perfectly normal distribution would have a skew of 0 and a kurtosis of three. d, e, f, Results represent 3 independent similar experiments. g, Labeling efficiency of iCCs treated with different concentrations of 4-OHT. Error bars indicate ±s.d. of mean (n=9). This experiment was repeated twice. h, Confetti-based estimates were normalized to labeling efficiency as follows: Total initiating events = Estimate*(100/%Confetti+ cells). The resulting reporter labeling efficiencies were grouped into four categories (3%, 17%, 40-45% and 67-78%). The average Confetti-based estimate of numbers of initially plated cells after normalization is shown (error bars indicate ± s.d. of mean). Confetti-based estimates of numbers of initiating events maintains fidelity when the labeling efficiency is >3% and >500 cells are examined. Estimates were obtained from n≥9 plated replicates. Results represent two independent similar experiments.
Figure 2
Figure 2. Mouse-to-Mouse peripheral blood Confetti variance reliably estimates number of repopulating units after transplantation
a, Experimental schematic. Here, “+/Cre” refers to any mouse heterozygous for CRE. b, 5×10⁶, 1×10⁶, 2×10⁵ ROSA26 +/ConfettiVE-Cadherin+/Cre WBM cells were transplanted into irradiated mice. Sample-to-sample variance in the PB Confetti colors estimated the number of repopulating units (RUs). Confetti estimate of RU relative to expected number of RU based on historical controls (i.e. 1 LT-HSC/10,000 WBM cells). Data are the average of 3 independent experiments (Supplementary Table 2). Error bars = s.d. c, CD45.2+ ROSA26+/ConfettiFlk1+/Cre WBM was transplanted at limiting dilution into irradiated CD45.1+CD45.2+ mice along with 2×10⁵ CD45.1+ WBM cells. Confetti colors in the CD45.2+ PB was examined between 4-20 weeks post-transplant, along with the distribution of total CD45.2+ PB chimerism (see Supplementary Fig. 2a-b). LDA indicates 1 RU/18,320 WBM cells transplanted (yellow bars, Supplementary Fig. 2b). Confetti-based estimates of RUs is shown at 4, 10, 16 and 20 weeks post-transplant. Error bars in LDA bar represent standard error. For Confetti-based estimates, error bars represent the 95% CI (Supplementary Table 3). d, Experimental schematic. CD45.2+ ROSA26+/ConfettiVE-Cadherin+/Cre cells from E11.5 AGM (n=16) or E11.5 AGM explants (n=7) were transplanted into irradiated CD45.1+CD45.2+ mice along with 2×10⁵ CD45.1+ WBM cells . e, %CD45.2+ PB 16 weeks post-transplantation. Each circle is an individual recipient. f, Frequency of unlabeled and Confetti+ cells within CD45.2+ PB of recipients. Each bar is an individual recipient (Supplementary Table 4).
Figure 3
Figure 3. Estimate of hematopoietic precursor numbers and activity during distinct stages of hematopoietic development
a, Schematic of window and site of CRE activity during murine development for E2aCre, Flk1Cre, VE-CadherinCre and Vav1Cre. ROSA26ERT2-Cre was activated by TAM in adult mice. b, +/Cre mice were mated with ROSA26Confetti/Confetti and the resulting adult offspring analyzed by flow cytometry for Confetti labeling. c, Log10(CV) of each Confetti color in ROSA26+/Confetti+/Cre mice. GFP is excluded because it represented <10% PB (Supplementary Table 4). d, 10 week old ROSA26+/ConfettiUbiquitin+/ERT2-Cre mice were analyzed for Confetti label after exposure to a single dose of TAM at E7.5 (n=5) or E8.5 (n=6). e, Log10(CV) of each Confetti color in ROSA26+/Confetti Ubiquitin+/ERT2-Cre mice. GFP is excluded because it represented <10% PB (Supplementary Table 4). f, The number of precursors generating Myeloid (M), B-cells (B) and T-cells (T) are depicted in parallel to the global estimate (total white blood cells, WBC) in PB of adult (age indicated in weeks) ROSA26+/ConfettiFlk1+/Cre, ROSA26+/ConfettiVE-Cadherin+/Cre, and ROSA26+/ConfettiVav1+/Cre mice. ROSA26+/Confetti Ubiquitin+/ERT2-Cre and ROSA26+/ConfettiCdh5+/ERT2-Creanimals exposed to TAM at different embryonic stages are also shown (Supplementary Table 4).
Figure 4
Figure 4. Onset of Confetti labeling in ROSA26+/Confetti Vav1+/Cre embryos
a, Representative Confetti analysis of CD45+Lineage-c-Kit+ E14.5 ROSA26+/ConfettiVav1+/Cre FL cells. RFP+CFP+ cells likely result from residual fluorophore protein previously expressed from same cassette before it “flipped” to allow expression of second fluorophore. b, Confetti labeling in CD45+ cells of the FL, AGM, and yolk sac of E11.5 (n=5) and CD45+c-Kit+ cells of E12.5 (n=3), E13.5 (n=13), and E14.5 (n=11) ROSA26+/ConfettiVav1+/Cre embryos (Supplementary Table 5). c, To assess the temporal delay between allele recombination and detectable fluorescence, iCCs treated with 4-OHT were monitored from 0 to 96 hours post-treatment by genomic PCR (i) and flow cytometry (ii). The average of % of Confetti+ cells is shown (error bars indicate ± s.d. of mean) (n=3) (Supplementary Table 5). Single arrow in (i) indicates recombined Confetti allele and double arrow in (i) indicates Cre allele as a control for gDNA content. Numbers indicate biological replicates. See Supplementary Fig. 6 for unprocessed scan of the gel.
Figure 5
Figure 5. Hemogenic endothelium is specified between E8.5 and E10.5 of murine ontogeny
a, Experimental schematic. ROSA26ERT2-Cre /Confetti (CD45.2+) WBM was transplanted into irradiated CD45.1+CD45.2+ mice treated with a single dose of TAM at 3, 2, 1, or 0 days pre-transplant (n=4 for each time-point). Recipients were treated again with five doses of TAM 12 weeks post-transplant. b, i) Confetti label in CD45.2+ PB of transplant recipients 4 weeks post-transplant. ii) CD45.2+ PB cells in transplant recipients 4 weeks post-transplant. iii) Confetti label in PB of transplant recipients treated again with TAM 12 weeks post-transplant. iv) PB CD45.2+ cells of transplant recipients treated again with TAM 12 weeks post-transplant. c, 10 week old ROSA26+/ConfettiCdh5+/ERT2-Cre mice were analyzed for Confetti label after exposure to a single dose of TAM at E7.5 (n=6), E8.5 (n=5), E9.5 (n=7), E10.5 (n=5) and E11.5 (n=3, which were 0.03, 0.69, 0.3% Confetti+ of total white cells). ≥Two independent litters were analyzed in each cohort. d, % Confetti label at 10 weeks of age in PB lineages of ROSA26+/ConfettiCdh5+/ERT2-Cre mice exposed to TAM during gestation. Error bars indicate ± s.d. of mean (Supplementary Table 5). e, Confetti labeling in VE-Cadherin+ endothelial cells in the AGM and YS; and in adult PB cells isolated from ROSA26+/ConfettiCdh5+/ERT2-Cre mice exposed to TAM during gestation (Supplementary Table 5). f, Dams pregnant with CD45.2+ ROSA26+/ConfettiCdh5+/ERT2-Cre embryos were treated with a single dose of TAM at E10.5. At E11.5, AGMs were collected (n=4), cultured as explants, and then transplanted. g, %CD45.2+ and %CD45.2+Confetti+ PB of recipients of ROSA26+/ConfettiCdh5+/ERT2-Cre AGM explant cells four weeks post-transplant (Supplementary Table 5).
Figure 6
Figure 6. Intra-aortic cell clusters are polyclonal in origin
a, Analysis of c-Kit+Confetti+ intra-aortic clusters in E10.5 and E11.5 AGMs isolated from ROSA26+/ConfettiVE-Cadherin+/Cre embryos or ROSA26+/ConfettiCdh5+/ERT2-Cre embryos exposed to TAM at E7.5 and E8.5 of gestation. b, E10.5 and E11.5 ROSA26+/Confetti VE-Cadherin+/Cre intra-aortic clusters classified by size and cell composition. (2-cell clusters, n=56; 3-cell clusters, n=16; 4-cell clusters, n=28; 5-cell clusters, n=8; 6-cell clusters, n=10; 7-cell clusters, n=3; 8-cell clusters, n=5; ≥8-cell clusters, n=4) (Supplementary Table 5).

References

    1. Medvinsky A, Rybtsov S, Taoudi S. Embryonic origin of the adult hematopoietic system: advances and questions. Development. 2011;138:1017–1031. doi:138/6/1017[pii]10.1242/dev.040998. - PubMed
    1. Kumaravelu P, et al. Quantitative developmental anatomy of definitive haematopoietic stem cells/long-term repopulating units (HSC/RUs): role of the aorta-gonad-mesonephros (AGM) region and the yolk sac in colonisation of the mouse embryonic liver. Development. 2002;129:4891–4899. - PubMed
    1. Medvinsky A, Dzierzak E. Definitive hematopoiesis is autonomously initiated by the AGM region. Cell. 1996;86:897–906. doi:S0092-8674(00)80165-8 [pii] - PubMed
    1. Muller AM, Medvinsky A, Strouboulis J, Grosveld F, Dzierzak E. Development of hematopoietic stem cell activity in the mouse embryo. Immunity. 1994;1:291–301. - PubMed
    1. de Bruijn MF, Speck NA, Peeters MC, Dzierzak E. Definitive hematopoietic stem cells first develop within the major arterial regions of the mouse embryo. EMBO J. 2000;19:2465–2474. doi: 10.1093/emboj/19.11.2465. - DOI - PMC - PubMed

MeSH terms